. 2019 Sep 9;10(1):4093.
doi: 10.1038/s41467-019-12104-w.

Muscarinic acetylcholine receptor signaling generates OFF selectivity in a simple visual circuit

Affiliations

Muscarinic acetylcholine receptor signaling generates OFF selectivity in a simple visual circuit

Bo Qin et al. Nat Commun. .

Abstract

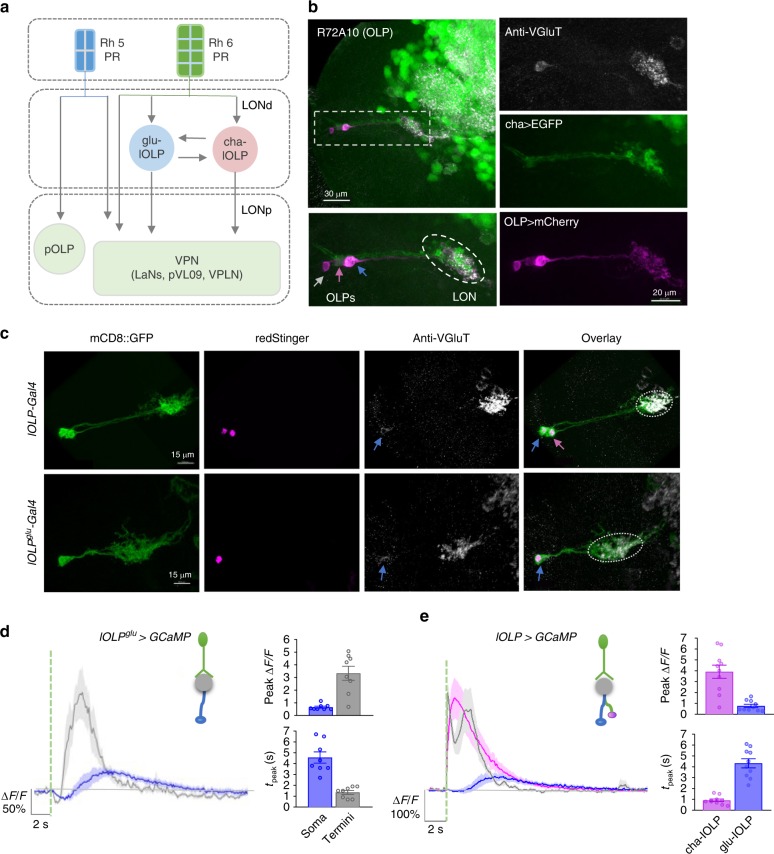
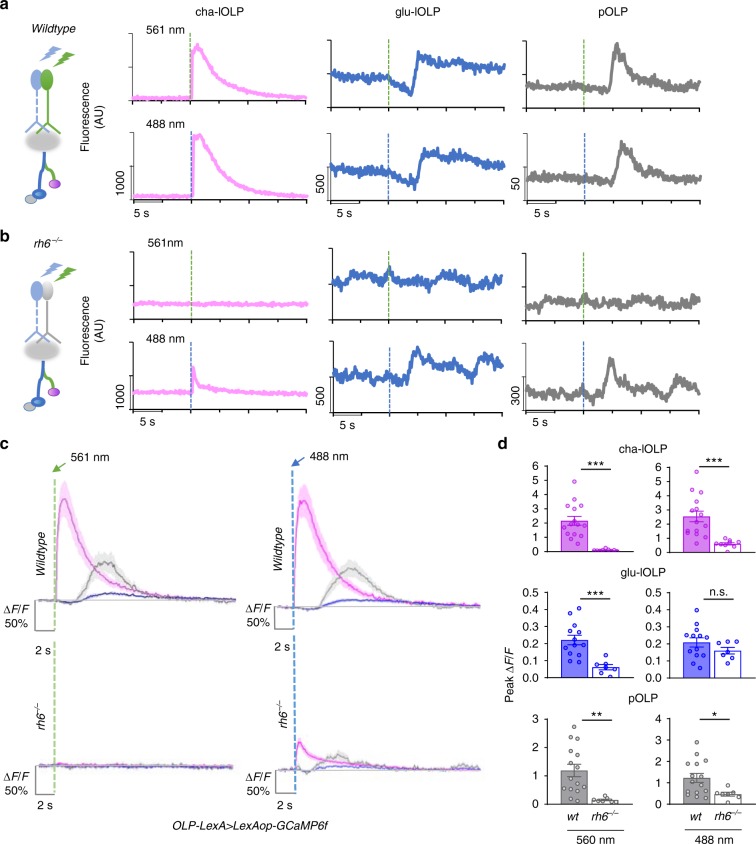
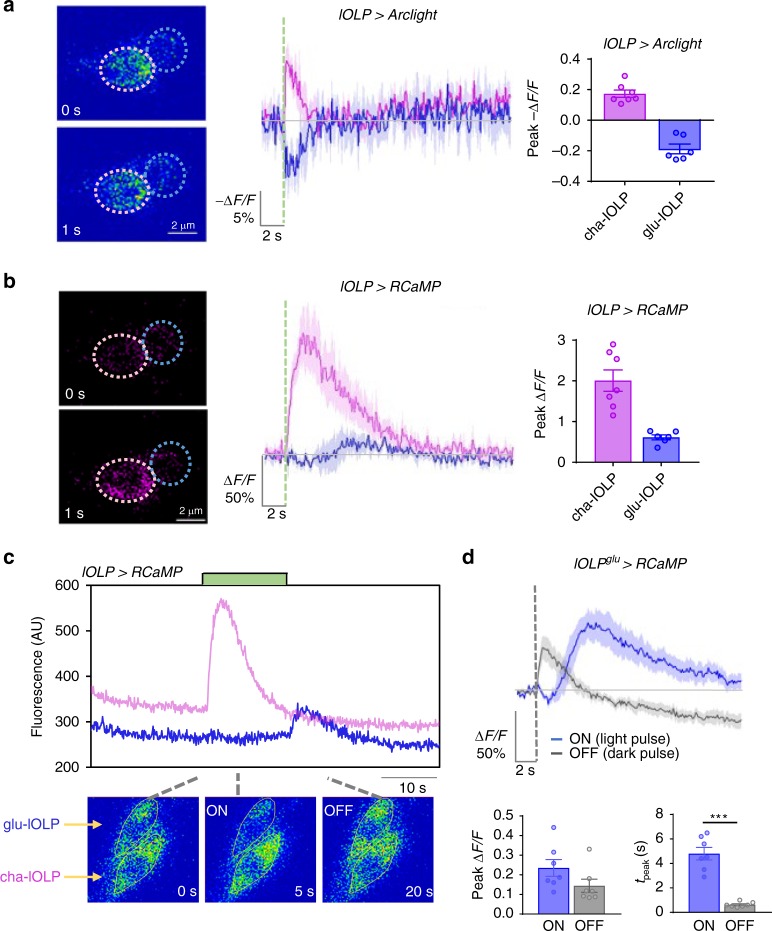
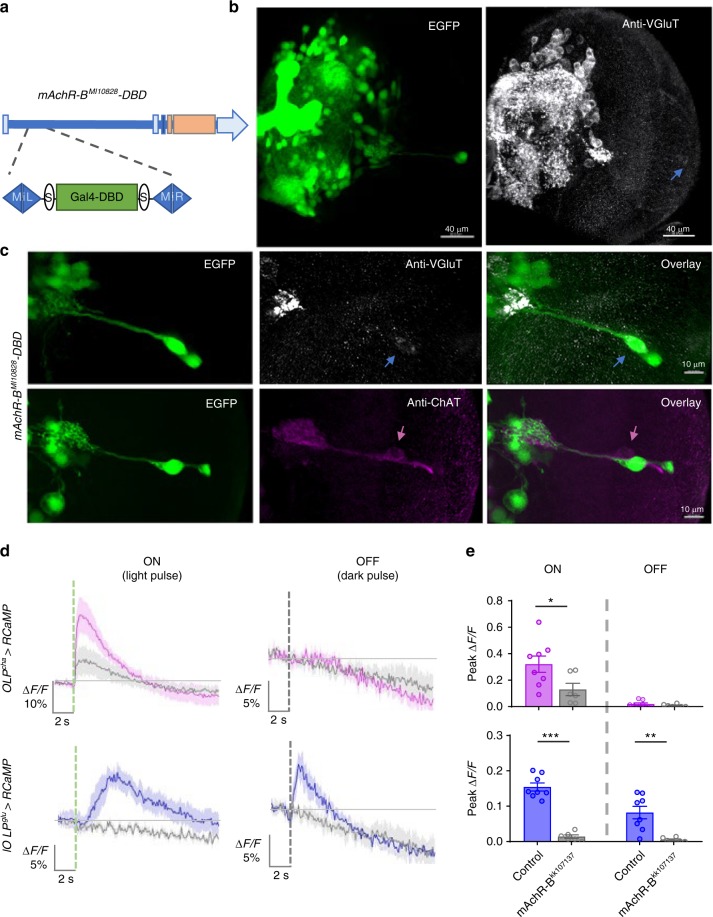
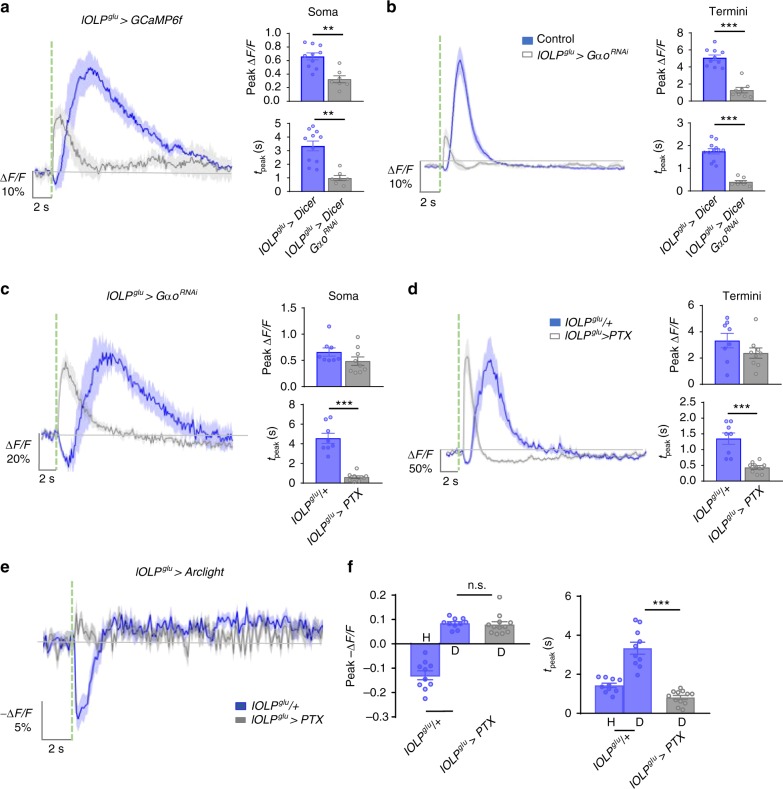
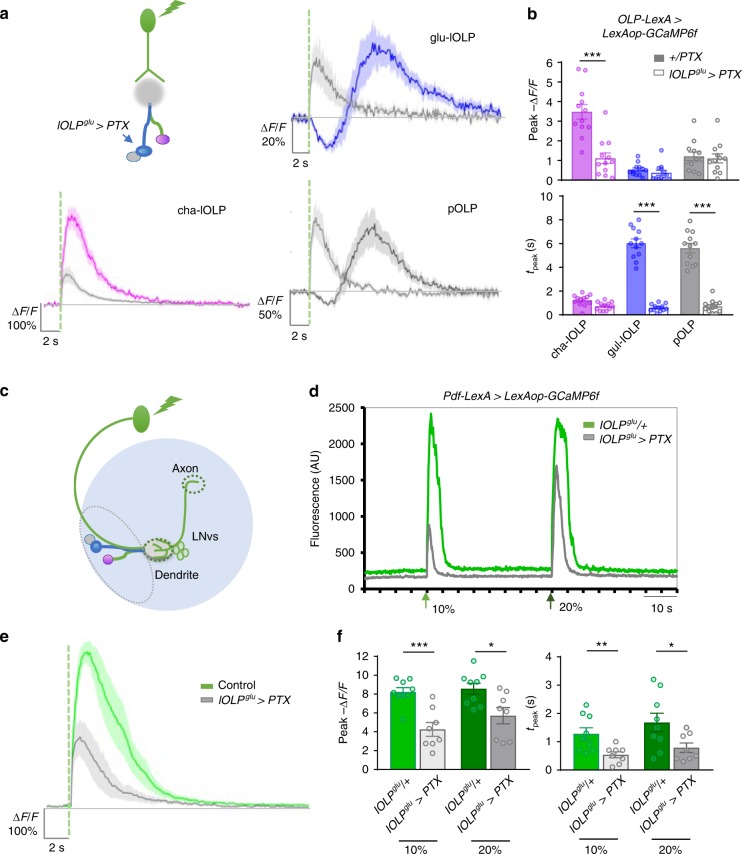
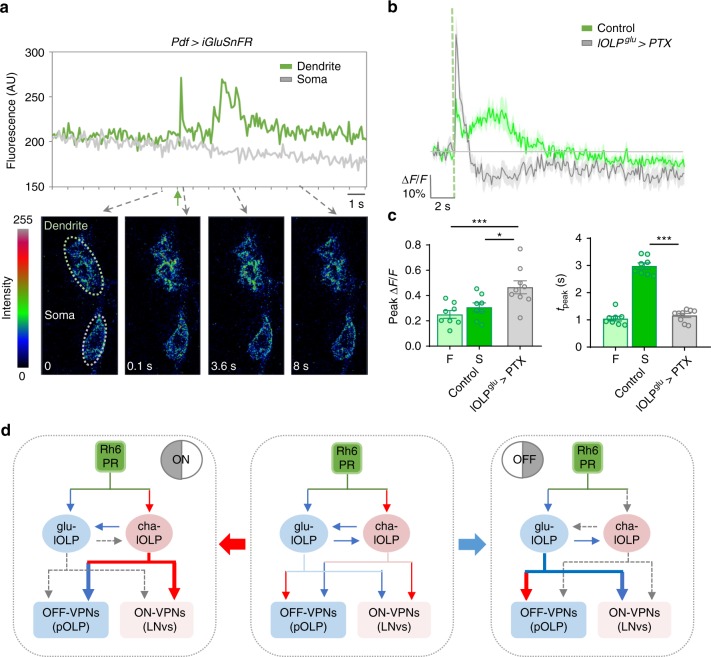
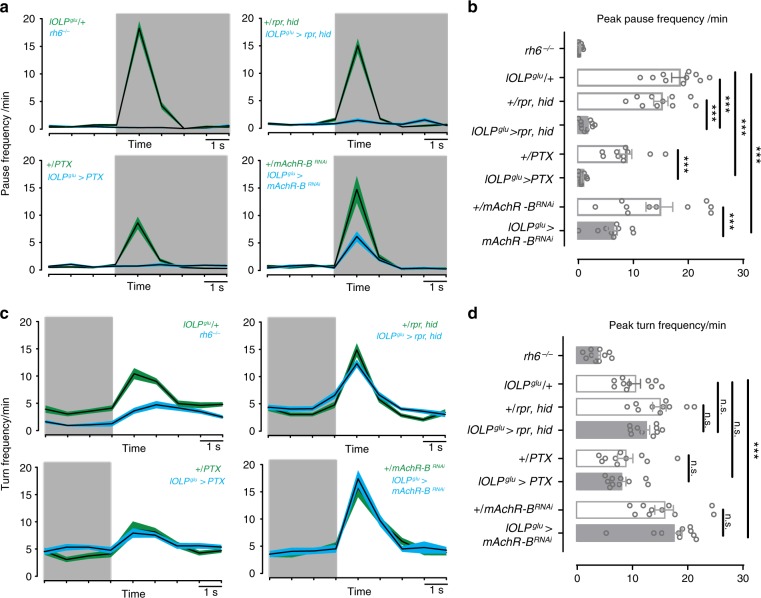
ON and OFF selectivity in visual processing is encoded by parallel pathways that respond to either light increments or decrements. Despite lacking the anatomical features to support split channels, Drosophila larvae effectively perform visually-guided behaviors. To understand principles guiding visual computation in this simple circuit, we focus on investigating the physiological properties and behavioral relevance of larval visual interneurons. We find that the ON vs. OFF discrimination in the larval visual circuit emerges through light-elicited cholinergic signaling that depolarizes a cholinergic interneuron (cha-lOLP) and hyperpolarizes a glutamatergic interneuron (glu-lOLP). Genetic studies further indicate that muscarinic acetylcholine receptor (mAchR)/Gαo signaling produces the sign-inversion required for OFF detection in glu-lOLP, the disruption of which strongly impacts both physiological responses of downstream projection neurons and dark-induced pausing behavior. Together, our studies identify the molecular and circuit mechanisms underlying ON vs. OFF discrimination in the Drosophila larval visual system.


Conflict of interest statement

The authors declare no competing interests.

Figures

Fig. 1
Fig. 1
Distinct light-elicited calcium responses in larval visual interneurons. a Circuit diagram of the Drosophila larval visual system. Rh5-expressing photoreceptor neurons (Rh5-PRs) project to the proximal layer of the LON (LONp) and transmit visual signals into the brain via direct synaptic connections with visual projection neurons (VPNs). Rh6-PRs project to the distal layer of the LON (LONd) and predominantly synapse onto two local interneurons, one cholinergic (cha-lOLP) and one glutamatergic (glu-lOLP), which then connect to the VPNs. Gray arrows indicate the unknown effects of light input on OLPs and most VPNs, as well as the undetermined interactions between the lOLPs. b Enhancer screens identified enhancer elements that label three OLPs. R72A10-LexA-driven LexAop-mCherry expression (magenta) reveals three somas near the lateral edge of the brain lobe, including the VGluT-positive glu-lOLP (blue arrow), the ChAT-positive cha-lOLP (pink arrow), and the projection OLP (pOLP, gray arrow). The LON region is marked by a dashed oval. c Enhancer Gal4 lines specifically labeling two local OLPs (lOLP-Gal4) and the single glu-lOLP (lOLPglu-Gal4) were identified. Representative confocal images of larval brains expressing mCD8::GFP and RedStinger driven by enhancer Gal4 lines are shown. Glu-lOLP is positive for anti-VGluT staining in the soma (blue arrows) and terminal processes (dashed circles) that project to the LON. Scale bars = 15 μm. d, e Calcium imaging experiments reveal differential physiological responses to light in two lOLPs. d Delayed calcium transients in glu-lOLP are observed using lOLPglu-Gal4 driving GCaMP6f. The calcium transients obtained at the terminal region (termini) show reduced latency and increased amplitude compared to the ones from the soma. n = 8. e Light pulses induce fast calcium transients in cha-lOLP (magenta) and slow transients in glu-lOLP (blue). The calcium transient generated at the terminal region is in gray. The average traces of GCaMP6f driven by lOLP-Gal4 and the quantifications of peak value and peak time of changed intensity (ΔF/F) are shown. n = 10. The dashed green line represents a 100 ms light pulse at 561 nm. Shaded areas on traces and error bars on quantifications represent SEM
Fig. 2
Fig. 2
OLPs receive presynaptic inputs predominantly from Rh6-PRs. a, b The contribution of Rh5- and Rh6-PRs to light-evoked calcium responses in OLPs as revealed by stimulation at different wavelengths in wild-type and Rh6 mutants. Left: schematic diagram illustrating the stimulation scheme used in calcium imaging experiments. Green or blue light pulses (dashed lines, green: 561 nm, blue: 488 nm) activate Rh5- or Rh6-PRs and elicit OLP-LexA-driven GCaMP6f signals in the somas of OLPs. Right: Representative raw traces of OLP > GCaMP6f collected from wild-type and Rh6 mutants (rh6−/−). Magenta: cha-lOLP; blue: glu-lOLP; gray: pOLP. c, d OLPs are functionally connected to Rh6-PRs in the third instar larval brain. Light pulses (dashed lines, green: 561 nm, blue: 488 nm) induced fast calcium transients in cha-lOLP (magenta) and slow transients in glu-lOLP (blue) and pOLP (gray). Compared to wild-type controls, OLPs in Rh6 mutants showed no response towards green light (561 nm) stimulation and dampened responses toward blue light (488 nm) stimulation except for glu-lOLP, which remained equally responsive. The c average traces and d quantification of peak value of changed intensity (ΔF/F) are shown. Shaded areas on traces and error bars on quantifications represent SEM. Wild-type control: cha-lOLP, n = 15; glu-lOLP, n = 13; pOLP, n = 15. Rh6 mutant (rh6−/−): cha-lOLP, n = 9; glu-lOLP, n = 7; pOLP, n = 7. cha-OLP, 561 nm: p < 0.0001, t = 5.102, df = 22; cha-OLP, 488 nm: p = 0.0007, t = 3.929, df = 22; glu-OLP, 561 nm: p = 0.0009, t = 3.977, df = 18; glu-OLP, 488 nm: p = 0.2362, t = 1.225, df = 18; pOLP, 561 nm: p = 0.0044, t = 3.207, df = 20; pOLP, 488 nm: p = 0.0261, t = 2.402, df = 20. Statistical significance was determined by Student’s t test. p ≥ 0.05 was considered not significant (n.s.), ***p < 0.001, **p < 0.01, and *p < 0.05
Fig. 3
Fig. 3
Light activates cha-lOLP and inhibits glu-lOLP. a, b Optical recordings using the voltage sensor Arclight together with the calcium sensor RCaMP reveal light-induced depolarization and fast calcium transients in cha-lOLP (magenta) as well as hyperpolarization and delayed calcium transients in glu-lOLP (blue). Representative frames from the recordings (left), averaged traces (middle), and the quantification of peak values of the changed intensity (ΔF/F) (right) are shown. Scale bars and time are as indicated. Somatic regions used for quantification are marked by dashed circles. The dashed green line represents a 100 ms light pulse. cha-lOLP, n = 7; glu-lOLP, n = 6. c cha-lOLP exhibits ON responses, while glu-lOLP exhibits OFF responses. A representative raw trace from the lOLP > RCaMP recording is shown (top). The sample was subjected to an extended (12.5 s) light stimulation (green bar). cha-lOLP responded to the light onset, but not to the light offset. In contrast, the light onset induced a small reduction of calcium signal in glu-lOLP, while the light offset produced a rapid calcium rise. Representative frames of the recording are shown (bottom). d ON and OFF signals generate calcium transients with different temporal profiles in glu-lOLP. Average traces of calcium transients generated by recordings of lOLPglu-Gal4 driving RCaMP are shown, demonstrating the slow calcium response to the light pulse (ON response, blue) and the fast calcium response to the dark pulse (OFF response, gray). The response amplitudes were not significantly different. The average traces (top) and the quantification of peak value and peak time of changed intensity (ΔF/F) (bottom) are as shown. n = 7 in both groups. ON: p = 0.1205; OFF: p < 0.001. Shaded areas on traces and error bars on quantifications represent SEM. The dashed line represents a 100 ms light or dark pulse. Statistical significance was determined by Student’s t test. p ≥ 0.05 was considered not significant, ***p < 0.001
Fig. 4
Fig. 4
mAchR-B mediates light-induced inhibition of glu-OLP. a Schematic diagram illustrating the insertion of a Gal4-DBD element into the 5′-UTR region of the mAchR-B gene. Orange bar: coding exons. Light blue bar: introns. b The mAchR-B enhancer line reveals broad expression of the receptor in the third instar larval brain. Representative projected confocal images with EGFP expression driven by the mAchR-B enhancer (green) and anti-VGluT staining (gray) are shown. Blue arrow: glu-lOLP. c mAchR-B expresses in glu-lOLP but not cha-lOLP. The mAchR-B enhancer-driven EGFP signal colocalizes with the VGluT-positive glu-lOLP (blue arrow), but not with the ChAT-positive cha-lOLP (pink arrow). Representative projected confocal images are shown. Scale bars are as indicated. d, e Expression of mAchR-BRNAi dampens cha-lOLP’s ON response and eliminates both glu-lOLP’s ON and OFF responses. The dashed green and gray lines indicate the 100 ms light or dark pulse, respectively. The genotypes are as indicated. The d average traces of the changes in lOLP > RCaMP signals and e quantification of peak values of changed intensity (ΔF/F) are shown. Shaded areas on traces and error bars on quantifications represent SEM. Control, n = 8; mAchR-BKK107137, n = 6. cha-lOLP, ON: p = 0.0388, t = 2.320, df = 12; cha-lOLP, OFF: p = 0.3201, t = 1.037, df = 12; glu-lOLP, ON: p < 0.0001, t = 10.09, df = 12; glu-lOLP, OFF: p = 0.0028, t = 3.736, df = 12. Statistical significance was determined by Student’s t test. p ≥ 0.05 was considered not significant, ***p < 0.001, **p < 0.01, and *p < 0.05
Fig. 5
Fig. 5
Gαo signaling regulates light-evoked responses in glu-lOLP. a, b RNAi knockdown of Gαo reduces the amplitude and latency of the calcium rise in glu-lOLP. Average traces of the changes in GCaMP signals (left) and the quantifications of peak value and peak time (right) of changed intensity (ΔF/F) are shown. lOLPglu > Dicer, n = 10; lOLPglu > Dicer, GαoRNAi, soma: n = 7; termini: n = 8. Soma—peak value: p = 0.0005; peak time: p = 0.0002. Termini—peak value: p < 0.0001; peak time: p < 0.0001. Statistical significance was determined by Student’s t test. c, d Expression of the Gαo inhibitor PTX accelerates the light-induced calcium rise in glu-lOLP without affecting its amplitude. lOLPglu > GCaMP6f signals were collected at the soma and termini of glu-lOLPs. Average traces of the changes in GCaMP signals (left) and the quantifications of the peak value and peak time (right) of changed intensity (ΔF/F) are shown. lOLPglu/+, n = 8; lOLPglu > PTX, n = 9. Soma—peak value: p = 0.145; peak time: p < 0.0001. Termini—peak value: p = 0.1723; peak time: p = 0.0001. Statistical significance was determined by Student’s t test. e, f PTX expression transforms light-induced hyperpolarization into depolarization in glu-lOLP. Light-evoked voltage changes in glu-lOLP measured by Arclight expression driven by lOLPglu-Gal4 exhibits a biphasic response, a large hyperpolarization (H) followed by a small depolarization (D), in the control group. PTX expression eliminates the hyperpolarization and reveals a depolarization. Average traces of changes in Arclight signals (left) and the quantifications of the peak value and peak time (right) of changed intensity (−ΔF/F) are shown. lOLPglu/+, n = 10, lOLPglu > PTX, n = 12. Peak value: ANOVA: p < 0.0001, F = 66.92, df = 35; lOLPglu/+-lOLPglu > PTX: p = 0.9883. Peak time: ANOVA: p < 0.001, F = 42.32, df = 35; lOLPglu/+-lOLPglu > PTX: p < 0.0001. Shaded areas on traces and error bars on quantifications represent SEM. The dashed green line represents a 100 ms light pulse at 561 nm. Statistical significance was determined by one-way ANOVA with post hoc Tukey’s multiple comparison’s test. n.s.: p ≥ 0.05 was considered not significant, **p < 0.01, ***p < 0.001
Fig. 6
Fig. 6
Glu-lOLP regulates light responses in cha-lOLP, pOLP, and LNvs. a, b glu-lOLP inhibits cha-lOLP and activates pOLP. a Schematic diagram illustrating the experimental design, with PTX expression restricted to glu-lOLP while light responses in the three OLPs are reported by OLP-LexA-driven LexAop-GCaMP6f. PTX expression accelerates glu-lOLP’s and pOLP’s activations and dampens the response in cha-lOLP. Average traces of changes in GCaMP signals are shown. The dashed green line represents a 100 ms light pulse at 561 nm. Shaded areas on traces represent SEM. b Quantifications of the peak value and peak time of changed intensity (ΔF/F) of GCaMP6f are shown. n = 12 in all groups. Peak values—cha-lOLP: p < 0.001; glu-OLP: p = 0.9967; pOLP: p = 0.9995. Peak times: cha-lOLP: p = 0.6956; glu-lOLP: p < 0.001; pOLP: p < 0.001. Error bars represent SEM. Statistical significance was determined by one-way ANOVA with post hoc Tukey’s multiple comparison’s test. c Schematic diagram showing the optical recording of light-induced responses in LNvs. Pdf-LexA-driven GCaMP6f signals are recorded in the axon terminal region (dashed circle). d A representative raw trace is shown. 100 ms light stimulations (green arrows) were delivered with either 10% or 20% laser power and induced robust calcium increases in LNvs. Compared to the controls, PTX expression in glu-lOLP (lOLPglu > PTX) leads to dampened responses with reduced durations. e, f PTX expression in glu-lOLP reduced the light-induced calcium response in LNvs. Average traces (e) and quantifications (f) of the peak value (left) and peak time (right) of changed intensity (ΔF/F) of GCaMP6f signals are shown. The dashed green line represents a 100 ms light stimulation at 10% intensity. Two different intensities of light stimulation generated similar results. Control: n = 9; lOLPglu > PTX: n = 8. Peak values: 10%: p = 0.0003, t = 4.758, df = 15; 20%: p = 0.0136, t = 2.795, df = 15. Peak times: 10%: p = 0.0090, t = 2.998, df = 15; 20%: p = 0.0354, t = 2.311, df = 15. Statistical significance was determined by Student’s t test. *p < 0.05, **p < 0.01, and ***p < 0.001
Fig. 7
Fig. 7
Light elicits delayed glutamate release from glu-lOLP. a Top: A representative raw trace of the light-induced glutamate transient generated by iGluSnFR recording on LNv dendrites. Bottom: representative frames from the same recording show increased iGluSnFR signals in the LNvs’ dendritic region but not the soma. The green arrow indicates the light pulse. b, c A light pulse (green dashed line) induces a biphasic release of glutamate onto the LNv dendrites. PTX expression in glu-lOLP eliminates the slow phase of the glutamate transient. b Average traces of the glutamate transients. c Quantification of changed intensity (∆F/F) in iGluSnFR signals on LNv dendrites. The fast phase (F) and slow phase (S) have different latencies and similar amplitudes. PTX expression in glu-lOLP eliminates the slow phase and generates one fast transient with an increased amplitude compared to the controls. Control: n = 8; lOLPglu > PTX: n = 9. Peak value: ANOVA: p = 0.0033, F = 7.473, df = 22; F/lOLPglu > PTX: p = 0.0034; S/lOLPglu > PTX: p = 0.0318. Peak time: p < 0.0001, F = 134.6, df = 22; F/lOLPglu > PTX: p = 0.6569; S/lOLPglu > PTX: p < 0.0001. Shaded areas on traces and error bars on quantifications represent SEM. Statistical significance determined by one-way ANOVA with post hoc Tukey’s multiple comparison’s test. *p < 0.05, ***p < 0.001. d A proposed model illustrating the emergence of ON and OFF selectivity in the larval visual circuit. Middle: lOLPs detect and transmit the ON and OFF signals in the larval visual circuit. Light induces acetylcholine release from Rh6-PRs, which activates cha-OLP and inhibits glu-lOLP through differentially expressed AChRs. During an ON response (left panel), the cholinergic transmission is dominant, activating ON-VPNs and suppressing OFF-VPNs. During an OFF response (right panel), glu-lOLP activates OFF-VPNs and suppresses ON-VPNs. The synaptic interactions are labeled blue for inhibitory and red for excitatory
Fig. 8
Fig. 8
Glu-lOLP is required for dark-induced pausing behavior. a, b Genetic manipulations of glu-lOLP affect dark-induced pausing behavior in larvae. a Plots of average pause frequency are shown. The transition from light to dark is indicated by the shade of the area. b Quantification of dark-induced pause frequency reveals the critical role of Rh6-PRs and glu-lOLP in this behavioral response. Statistical significance determined by one-way ANOVA: p < 2e − 16, F = 35.6, df = 7, 72 followed by post hoc Dunnetts’s multiple comparison’s test: lOLPglu/+-lOLPglu > rpr, hid: p < 1e − 04, t = 9.907; +/rpr,hid-lOLPglu > rpr, hid: p < 1e − 04, t = 7.990; lOLPglu/+- lOLPglu > PTX: p < 1e − 04, t = 10.337; +/PTX-lOLPglu > PTX: p = 0.000108, t = 4.648; lOLPglu/+-lOLPglu > mAChR-BRNAi: p < 1e − 04, t = 7.120; +/mAChR-BRNAi-lOLPglu > mAChR-BRNAi: p < 1e −04, t = 5.044. ***P < 0.001. n = 10 for each genotype. c, d The light-induced increase in turning frequency is reduced in Rh6 mutants but unaffected by glu-lOLP manipulations. c Plots of average turn frequency are shown. The transition from dark to light is indicated by the shade of the area. d Quantifications of the light-induced turn frequency reveals that glu-lOLP does not influence the behavioral responses induced by the dark to light transition. Statistical significance determined by one-way ANOVA: p < 7.16e − 12, F = 14.93, df = 7, 72 followed by post hoc Dunnetts’s multiple comparison’s test: lOLPglu/+-lOLPglu > rpr, hid: p = 0.753, t = −1.159; +/rpr,hid-lOLPglu > rpr, hid: p = 0.538, t = 1.472; lOLPglu/+-lOLPglu > PTX: p = 0.530, t = 1.483; +/PTX-lOLPglu > PTX: p = 0.996, t = 0.445; lOLPglu/+-lOLPglu > mAChR-BRNAi: p < 0.001, t = −4.134; +/mAChR-BRNAi-lOLPglu > mAChR-BRNAi: p = 0.849, t = −0.996. n.s., p > 0.05, ***p < 0.001. n = 10 for each genotype

Similar articles

Cited by

References

    1. Schiller PH, Sandell JH, Maunsell JH. Functions of the ON and OFF channels of the visual system. Nature. 1986;322:824–825. - PubMed
    1. Wassle H. Parallel processing in the mammalian retina. Nat. Rev. Neurosci. 2004;5:747–757. - PubMed
    1. Demb JB, Singer JH. Functional circuitry of the retina. Annu Rev. Vis. Sci. 2015;1:263–289. - PMC - PubMed
    1. Sanes JR, Zipursky SL. Design principles of insect and vertebrate visual systems. Neuron. 2010;66:15–36. - PMC - PubMed
    1. Perry M, Konstantinides N, Pinto-Teixeira F, Desplan C. Generation and evolution of neural cell types and circuits: insights from the drosophila visual system. Annu Rev. Genet. 2017;51:501–527. - PMC - PubMed

Publication types

MeSH terms

LinkOut - more resources