Multi-omic biomarker identification and validation for diagnosing warzone-related post-traumatic stress disorder
- PMID: 31501510
- PMCID: PMC7714692
- DOI: 10.1038/s41380-019-0496-z
Multi-omic biomarker identification and validation for diagnosing warzone-related post-traumatic stress disorder
Abstract
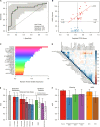
Post-traumatic stress disorder (PTSD) impacts many veterans and active duty soldiers, but diagnosis can be problematic due to biases in self-disclosure of symptoms, stigma within military populations, and limitations identifying those at risk. Prior studies suggest that PTSD may be a systemic illness, affecting not just the brain, but the entire body. Therefore, disease signals likely span multiple biological domains, including genes, proteins, cells, tissues, and organism-level physiological changes. Identification of these signals could aid in diagnostics, treatment decision-making, and risk evaluation. In the search for PTSD diagnostic biomarkers, we ascertained over one million molecular, cellular, physiological, and clinical features from three cohorts of male veterans. In a discovery cohort of 83 warzone-related PTSD cases and 82 warzone-exposed controls, we identified a set of 343 candidate biomarkers. These candidate biomarkers were selected from an integrated approach using (1) data-driven methods, including Support Vector Machine with Recursive Feature Elimination and other standard or published methodologies, and (2) hypothesis-driven approaches, using previous genetic studies for polygenic risk, or other PTSD-related literature. After reassessment of ~30% of these participants, we refined this set of markers from 343 to 28, based on their performance and ability to track changes in phenotype over time. The final diagnostic panel of 28 features was validated in an independent cohort (26 cases, 26 controls) with good performance (AUC = 0.80, 81% accuracy, 85% sensitivity, and 77% specificity). The identification and validation of this diverse diagnostic panel represents a powerful and novel approach to improve accuracy and reduce bias in diagnosing combat-related PTSD.
Conflict of interest statement
The authors declare that they have no conflict of interest.
Figures


Comment in
-
What are the merits of a multi-omic approach to diagnosing PTSD?Mol Psychiatry. 2020 Dec;25(12):3127-3128. doi: 10.1038/s41380-020-0694-8. Epub 2020 Feb 26. Mol Psychiatry. 2020. PMID: 32103151 No abstract available.
Similar articles
-
Molecular signatures of post-traumatic stress disorder in war-zone-exposed veteran and active-duty soldiers.Cell Rep Med. 2023 May 16;4(5):101045. doi: 10.1016/j.xcrm.2023.101045. Cell Rep Med. 2023. PMID: 37196634 Free PMC article.
-
Epigenetic biotypes of post-traumatic stress disorder in war-zone exposed veteran and active duty males.Mol Psychiatry. 2021 Aug;26(8):4300-4314. doi: 10.1038/s41380-020-00966-2. Epub 2020 Dec 18. Mol Psychiatry. 2021. PMID: 33339956 Free PMC article.
-
Pre-deployment risk factors for PTSD in active-duty personnel deployed to Afghanistan: a machine-learning approach for analyzing multivariate predictors.Mol Psychiatry. 2021 Sep;26(9):5011-5022. doi: 10.1038/s41380-020-0789-2. Epub 2020 Jun 2. Mol Psychiatry. 2021. PMID: 32488126 Free PMC article.
-
Human brain evolution and the "Neuroevolutionary Time-depth Principle:" Implications for the Reclassification of fear-circuitry-related traits in DSM-V and for studying resilience to warzone-related posttraumatic stress disorder.Prog Neuropsychopharmacol Biol Psychiatry. 2006 Jul;30(5):827-53. doi: 10.1016/j.pnpbp.2006.01.008. Epub 2006 Mar 23. Prog Neuropsychopharmacol Biol Psychiatry. 2006. PMID: 16563589 Free PMC article. Review.
-
[Posttraumatic stress disorder (PTSD) as a consequence of the interaction between an individual genetic susceptibility, a traumatogenic event and a social context].Encephale. 2012 Oct;38(5):373-80. doi: 10.1016/j.encep.2011.12.003. Epub 2012 Jan 24. Encephale. 2012. PMID: 23062450 Review. French.
Cited by
-
Abnormal intestinal milieu in posttraumatic stress disorder is not impacted by treatment that improves symptoms.Am J Physiol Gastrointest Liver Physiol. 2022 Aug 1;323(2):G61-G70. doi: 10.1152/ajpgi.00066.2022. Epub 2022 May 31. Am J Physiol Gastrointest Liver Physiol. 2022. PMID: 35638693 Free PMC article.
-
Molecular signatures of post-traumatic stress disorder in war-zone-exposed veteran and active-duty soldiers.Cell Rep Med. 2023 May 16;4(5):101045. doi: 10.1016/j.xcrm.2023.101045. Cell Rep Med. 2023. PMID: 37196634 Free PMC article.
-
Translational bioinformatics and data science for biomarker discovery in mental health: an analytical review.Brief Bioinform. 2024 Jan 22;25(2):bbae098. doi: 10.1093/bib/bbae098. Brief Bioinform. 2024. PMID: 38493340 Free PMC article. Review.
-
Tai Chi and Qigong for trauma exposed populations: A systematic review.Ment Health Phys Act. 2022 Mar;22:10.1016/j.mhpa.2022.100449. doi: 10.1016/j.mhpa.2022.100449. Ment Health Phys Act. 2022. PMID: 37885833 Free PMC article.
-
The Greater Houston Area Bipolar Registry-Clinical and Neurobiological Trajectories of Children and Adolescents With Bipolar Disorders and High-Risk Unaffected Offspring.Front Psychiatry. 2021 Jun 4;12:671840. doi: 10.3389/fpsyt.2021.671840. eCollection 2021. Front Psychiatry. 2021. PMID: 34149481 Free PMC article.
References
-
- Kulka RA, et al. Trauma and the Vietnam war generation: report of findings from the National Vietnam Veterans Readjustment Study. Philadelphia, PA: Brunner/Mazel; 1990.
-
- Kang HK, Natelson BH, Mahan CM, Lee KY, Murphy FM. Post-traumatic stress disorder and chronic fatigue syndrome-like illness among gulf war veterans: a population-based survey of 30,000 veterans. Am J Epidemiol. 2003;157:141–8. - PubMed
-
- Seal KH, Bertenthal D, Miner CR, Sen S, Marmar C. Bringing the war back home. Arch Intern Med. 2007;167:476–82. - PubMed
-
- Marmar CR, et al. Course of posttraumatic stress disorder 40 years after the Vietnam war. JAMA Psychiatry. 2015;72:875. - PubMed
-
- American Psychiatric Association. Diagnostic and statistical manual of mental disorders. Arlington, VA: American Psychiatric Publishing; 2013.
Publication types
MeSH terms
Substances
LinkOut - more resources
Full Text Sources
Other Literature Sources
Medical

