. 2019 Sep 9;9(1):12892.
doi: 10.1038/s41598-019-49316-5.

Yeast PAF1 complex counters the pol III accumulation and replication stress on the tRNA genes

Affiliations

Yeast PAF1 complex counters the pol III accumulation and replication stress on the tRNA genes

Pratibha Bhalla et al. Sci Rep. .

Abstract

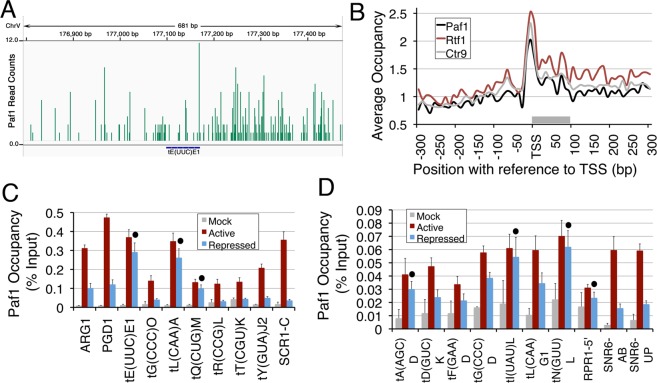
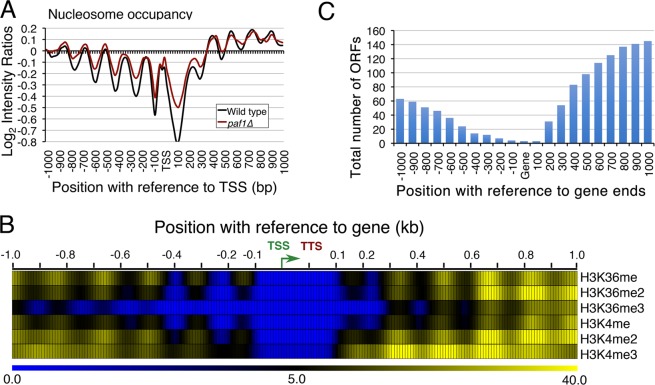
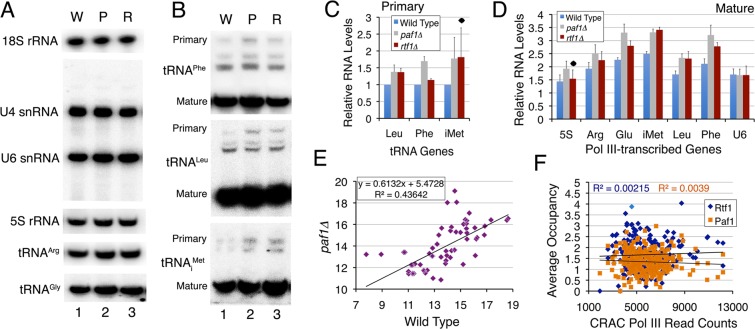
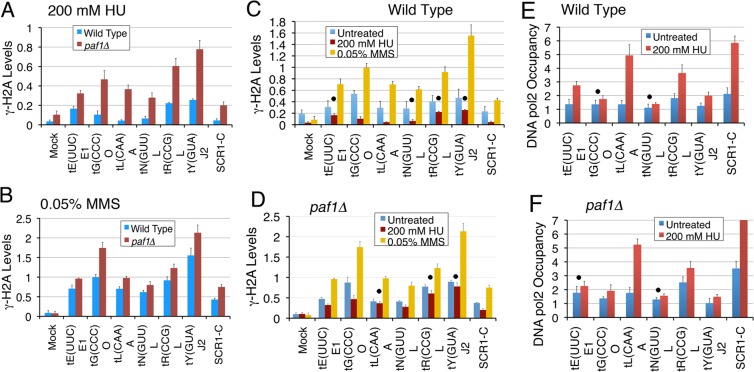
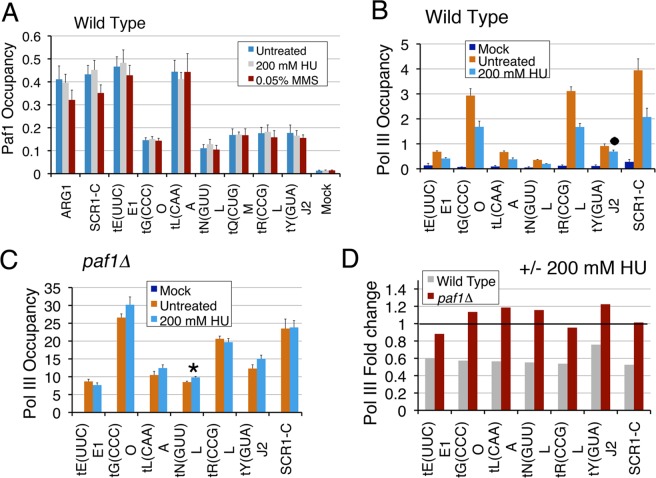
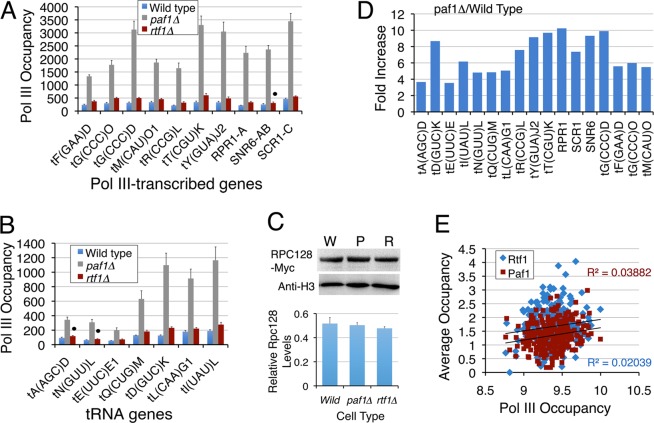
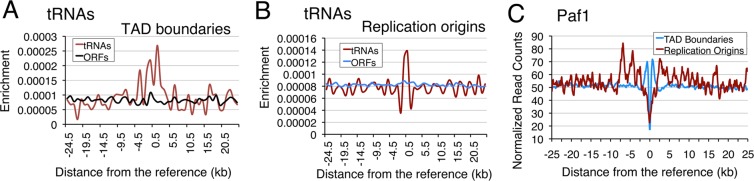
The RNA polymerase (pol) III transcribes mostly short, house-keeping genes, which produce stable, non-coding RNAs. The tRNAs genes, highly transcribed by pol III in vivo are known replication fork barriers. One of the transcription factors, the PAF1C (RNA polymerase II associated factor 1 complex) is reported to associate with pol I and pol II and influence their transcription. We found low level PAF1C occupancy on the yeast pol III-transcribed genes, which is not correlated with nucleosome positions, pol III occupancy and transcription. PAF1C interacts with the pol III transcription complex and causes pol III loss from the genes under replication stress. Genotoxin exposure causes pol III but not Paf1 loss from the genes. In comparison, Paf1 deletion leads to increased occupancy of pol III, γ-H2A and DNA pol2 in gene-specific manner. Paf1 restricts the accumulation of pol III by influencing the pol III pause on the genes, which reduces the pol III barrier to the replication fork progression.


Conflict of interest statement

The authors declare no competing interests.

Figures

Figure 1
Figure 1
Paf1 localizes to the pol III-transcribed genes. Low level of Paf1 occupancy is found at the pol III-transcribed gene loci. The genome-wide data on Paf1 occupancy was analysed. (A) Screenshot of a view with Integrative Genomic Viewer (IGV) of Paf1 occupancy on the gene tE(UUC)E1 in a window spanning 300 bp upstream and downstream of the gene ends. (B) Similar average occupancy profiles were found for the PAF1C subunits on the tRNA genes. The average occupancies on both 300 bp upstream and downstream of TSS are plotted. The grey bar marks the tRNA gene region on the X-axis. (C,D) Paf1 occupancy over pol III-transcribed genes relative to TelVIR region were estimated by ChIP and Real time PCR in active and repressed states. The changes were found to be significant (p value < 0.04) for all except those marked with a dot.
Figure 2
Figure 2
Paf1 does not affect chromatin around tRNA genes. (A) Paf1 does not influence nucleosome occupancy on tRNA genes. (B) Methylation levels on K4 and K36 residues of the histone H3 are very low near tRNA genes. Heat map is shown for 1 kb upstream and downstream of the gene. Color gradient code is shown at the bottom, TTS and TSS (bent arrow) are marked. (C) ORF content in the 1 kb up- and downstream regions of the tRNA genes is shown. The number of ORFs were counted at every 100 bp upstream or downstream of tRNA gene body using the available annotations in the SGD database (https://www.yeastgenome.org). Only those ORFs found on the same strand as tRNA were counted.
Figure 3
Figure 3
Paf1 has repressive role in RNA pol III transcription. (A,B) Estimation of transcript levels in paf1Δ and rtf1∆ cells by northern analysis for different genes in wild type [W], paf1Δ [P] and rtf1∆ [R] cells. Radiolabeled oligonucleotide probes against 18 S rRNA (pol I transcribed), U4 snRNA (pol II transcribed) and pol III transcribed U6 snRNA, 5 S rRNA and different tRNA genes were used individually. Primary and mature transcript level positions are marked. (C) Quantifications of pre-tRNA products in panel B for tRNAiMet, tRNAPhe and tRNALeu normalized with U4 levels. Averages and scatter from three independent experiments are plotted. (D) Quantifications of mature RNA products in panel A for 5 S rRNA and tRNAiMet, tRNAArg, tRNAGlu, tRNAPhe and tRNALeu normalized with U4 levels. Average and scatter from three independent experiments are plotted. Dots mark the statistically insignificant changes. (E) Paf1 deletion causes gene-specific differences in the individual tRNA levels between the wild type and mutant cells. The log2 transformed, normalized read counts of each tRNA from the wild type and paf1Δ cells obtained in the HySeq data are compared. (F) Paf1 and Rtf1 mean occupancies (, between −205 to + 155 bp) are not correlated to the pol III levels associated with the nascent RNAs estimated by the CRAC (UV Crosslinking and Analysis of cDNA) method.
Figure 4
Figure 4
Paf1 is required to counter the replication stress at pol III-transcribed genes. Levels were measured in cells with or without exposure to genotoxins by using ChIP and Real Time PCR method. Dots mark the genes, which do not show significant change under a specific condition (p value > 0.05). Rest of the changes are significant. (A) and (B) As compared to the wild type, γ-H2A levels increase in paf1Δ cells when both types of cells are similarly treated with (A) HU; all p values < 0.0045 or (B) MMS; all p values < 0.05. (C,D) As compared to the levels in the untreated condition, the γ-H2A levels increase (p value < 0.009) after MMS exposure. (C) As compared to the low, normal (untreated) levels in the wild type cells, γ-H2A levels decrease when exposed to HU. The p values for the genes marked with a dot vary between 0.06 and 0.076; rest are < 0.035. (D) Higher than the wild type γ-H2A levels in the paf1Δ cells mostly do not change when exposed to HU. The p values for the genes marked with a dot vary between 0.05 and 0.16; rest are < 0.04. (E,F) The DNA pol2-9XMyc occupancy on the tRNA genes increases upon exposure to 200 mM HU for 2 hr. (E) In the wild type cells, DNA pol2 shows gene-specific increases on most of the genes, except tG(CCC)O (p value = 0.061 and tN(GUU)L (p value = 0.052), marked with a dot. (F) HU treatment of the paf1Δ cells takes the DNA pol 2 levels on all the tested genes to same as that in the wild type cells, except on the SCR1 gene where levels were found beyond the given scale (increase of ~6.8 fold).
Figure 5
Figure 5
Pol III is lost from the genes under replication stress in a gene-specific manner. (A) Paf1 occupancy on the tested genes in the wild type cells does not change when exposed to the genotoxins HU or MMS. (B) Pol III occupancies in normally cycling wild type cells decrease upon exposure to HU. The dot marks the gene with insignificant decrease (p value = 0.29). (C) In the paf1Δ cells, pol III occupancies are not affected upon exposure to HU, except on tN(GUU)L (p value = 0.045), marked with an asterisk. (D) Data in the panel B for wild type and panel C for the paf1Δ cells were used to obtain the ratios HU treated/untreated cells. As a value of 1.0 (marked with a horizontal line) denotes no change, ratios on the y axis reveal that HU causes ~40% loss of pol III in the wild type but no change in the paf1Δ cells.
Figure 6
Figure 6
Pol III occupancy shows gene-specific increases in the paf1Δ and rtf1Δ cells. (A,B) Rpc128 occupancy on the pol III-transcribed genes relative to TelVIR region in wild type, rtf1Δ and paf1Δ cells. Averages and scatters from three biological replicates are plotted. The dot denotes that the change is non-significant in rtf1∆ cells, probably due to higher scatter. (C) Western quantification of the total levels of Rpc128 protein in the wild type (W), PAF1 (P) or RTF1 (R) deletion cells. Lower panel shows that the Rpc128 protein levels normalized against H3 do not differ in the three types of cells. (D) Fold increase of pol III occupancy in the paf1Δ cells on the individual genes was calculated by using the data in the panels A and B. (E) Paf1, Rtf1 and pol III occupancies on the tRNA genes are compared. Occupancies of Paf1 and Rtf1 (at −205 to +155 bp) do not show any correlation with pol III levels (at −200 to +300 bp).
Figure 7
Figure 7
Paf1 is enriched around TAD boundaries. The normalized average enrichment across all the origins and TAD boundaries are shown. The bin sizes of 1000 bp and 100 bp for calculating the enrichment of tRNA start sites and Paf1 ChIP-exo reads respectively were used. Zero as reference point represents either the TAD boundary or the replication origin. (A,B) ORF enrichment was taken as a control. Average enrichment across (A) TAD boundaries and (B) replication origins was further normalized by the total TSS counts of tRNAs (299) and ORFs (6621), to bring the curves at comparable scale. (C) The average Paf1 enrichment (Normalized Read counts) across all the origins and TAD boundaries are shown.

Similar articles

Cited by

References

    1. Vannini A, Cramer P. Conservation between the RNA polymerase I, II, and III transcription initiation machineries. Mol. Cell. 2012;45:439–446. doi: 10.1016/j.molcel.2012.01.023. - DOI - PubMed
    1. Geiduschek EP, Kassavetis GA. The RNA polymerase III transcription apparatus. J, Mol. Biol. 2001;310:1–26. doi: 10.1006/jmbi.2001.4732. - DOI - PubMed
    1. Schramm L, Hernandez N. Recruitment of RNA polymerase III to its target promoters. Genes Dev. 2002;16:2593–2620. doi: 10.1101/gad.1018902. - DOI - PubMed
    1. Dieci G, Conti A, Pagano A, Carnevali D. Identification of RNA polymerase III-transcribed genes in eukaryotic genomes. Biochim. Biophys. Acta. 2013;1829:296–305. doi: 10.1016/j.bbagrm.2012.09.010. - DOI - PubMed
    1. Les´niewska E, Boguta M. Novel layers of RNA polymerase III control affecting tRNA gene transcription in eukaryotes. Open Biol. 2017;7:170001. doi: 10.1098/rsob.170001. - DOI - PMC - PubMed

MeSH terms