

doi: 10.1038/s41592-019-0535-3.
Epub 2019 Sep 9.
Supervised classification enables rapid annotation of cell atlases
Affiliations
- PMID: 31501545
- PMCID: PMC6791524
- DOI: 10.1038/s41592-019-0535-3
Item in Clipboard
Supervised classification enables rapid annotation of cell atlases
Nat Methods.
2019 Oct.
Abstract
Single-cell molecular profiling technologies are gaining rapid traction, but the manual process by which resulting cell types are typically annotated is labor intensive and rate-limiting. We describe Garnett, a tool for rapidly annotating cell types in single-cell transcriptional profiling and single-cell chromatin accessibility datasets, based on an interpretable, hierarchical markup language of cell type-specific genes. Garnett successfully classifies cell types in tissue and whole organism datasets, as well as across species.
Conflict of interest statement
Competing Financial Interests Statement
The authors declare no competing interests.
Figures
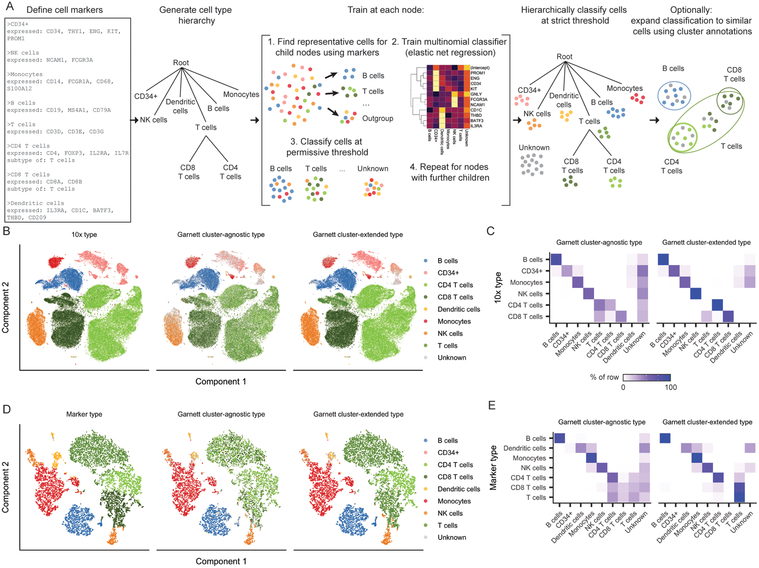
A) Overview of Garnett algorithm. See Methods for algorithmic details. Briefly, Garnett takes as input a marker file that defines cell types using marker genes, and builds a cell type hierarchy that can include cell subtypes. Next, Garnett trains a classifier using elastic net multinomial regression at each node beginning at the root of the tree by comparing cell type representative cells. Lastly, Garnett hierarchically classifies all cells and optionally provides a second cluster-extended classification. B) t-SNE plots of 10x Genomics’ 100,000 cell PBMC dataset (n = 94,571 cells). The first panel is colored by cell type based on FACS sorting, the second panel is colored by cluster-agnostic cell type according to Garnett classification, and the third panel is colored by the Garnett cluster-extended type, which labels cells based on the composition of their cluster or community. C) A heatmap of data in (B) comparing the labels based on FACS (rows) with the cluster-agnostic (left) and cluster-extended (right) cell type assignments by Garnett (columns). Color represents the percent of cells of a certain FACS type labeled each type by Garnett. D) t-SNE plots of 10x Genomics V2 chemistry applied to PBMCs from a healthy donor (n = 8,381 cells). The first panel is colored by type determined manually using known gene markers. The second and third panels are colored by Garnett cluster-agnostic and cluster-extended cell type assignments by a classifier trained on the data shown in panels (B) and (C). E) Similar to panel (C), a heatmap of data in (D).
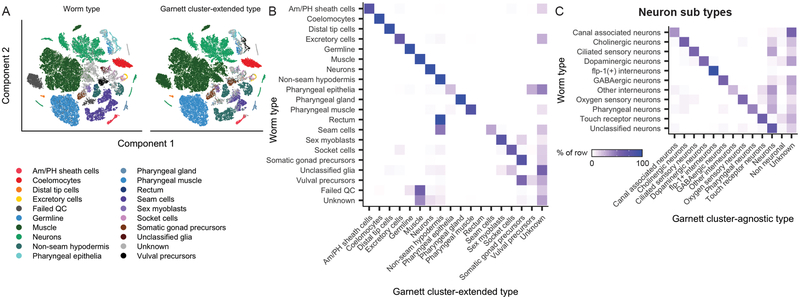
Garnett classification results for sci-RNA-seq data from whole C. elegans, published in ref. A) t-SNE plots of the whole worm dataset (n = 42,035 cells). First panel is colored by published type from ref, second panel colored by the major (top level) Garnett cluster-extended classification. Garnett cluster-agnostic type is available in Supplementary Figure 7. B) Heatmap comparing the reported cell types versus the Garnett cluster-extended cell types. Color represents the percent of cells of a certain reported type labelled as each type by Garnett. C) Heatmap comparing the reported neuron subtypes versus the Garnett cluster-agnostic neuron subtypes.
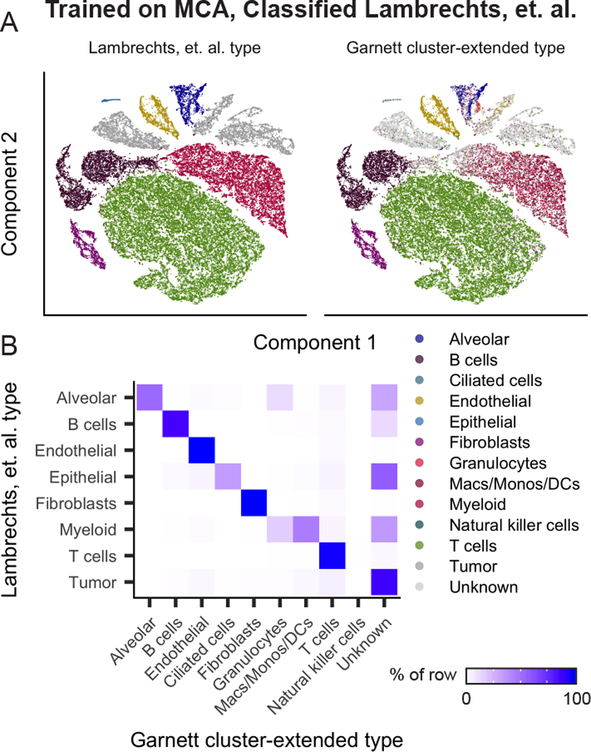
A) Garnett cluster-extended results for human lung tumors from ref classified based on a Garnett classifier trained on lung cells from the Mouse Cell Atlas. t-SNE plots of the human lung tumor dataset (n = 52,698 cells). First panel is colored by published type from ref, second panel colored by the Garnett cluster-extended classification. B) Heatmap comparing the reported cell types versus the Garnett cluster-extended cell types from panel D. Color represents the percent of cells of a certain reported type labelled as each type by Garnett.
References
Publication types
MeSH terms
Grants and funding
LinkOut - more resources
Full Text Sources
Other Literature Sources
