. 2019 Oct;16(10):999-1006.
doi: 10.1038/s41592-019-0547-z. Epub 2019 Sep 9.

Simultaneous profiling of 3D genome structure and DNA methylation in single human cells

Affiliations

Simultaneous profiling of 3D genome structure and DNA methylation in single human cells

Dong-Sung Lee et al. Nat Methods. 2019 Oct.

Abstract

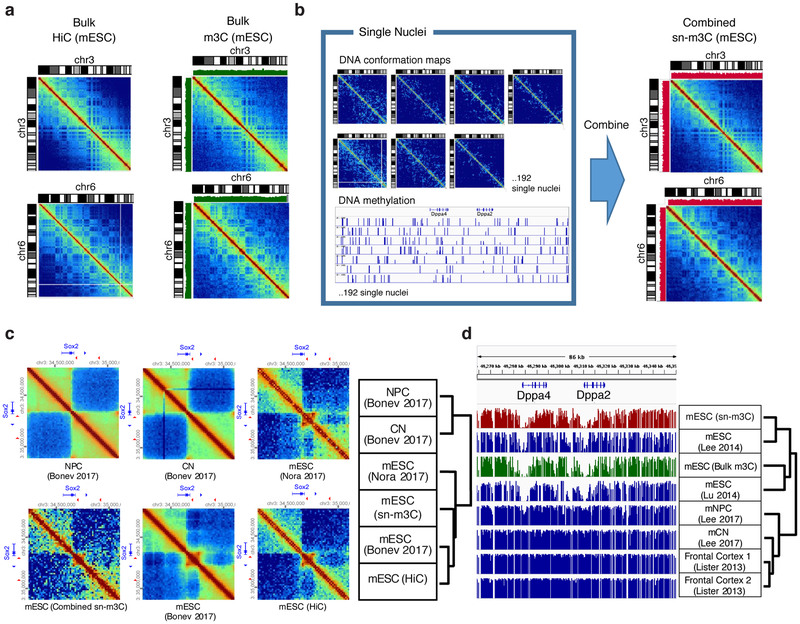
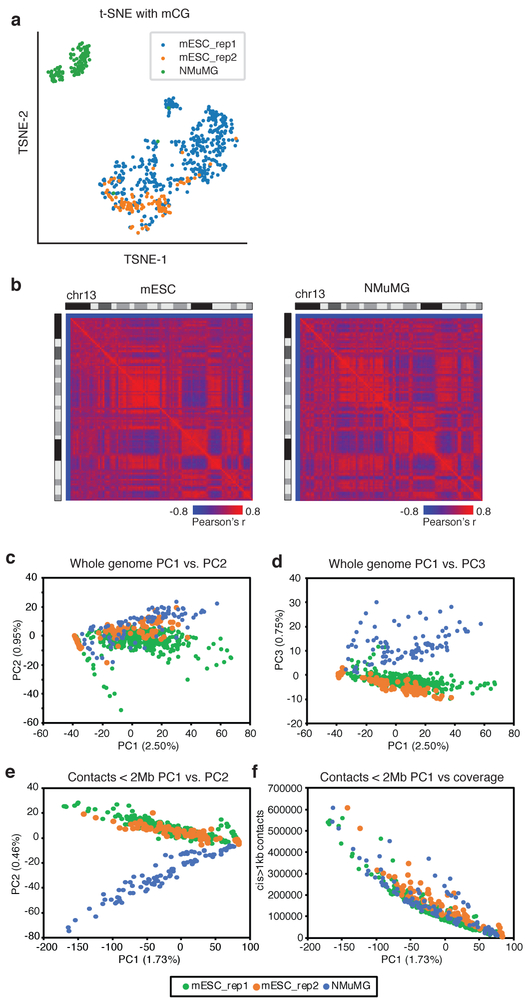
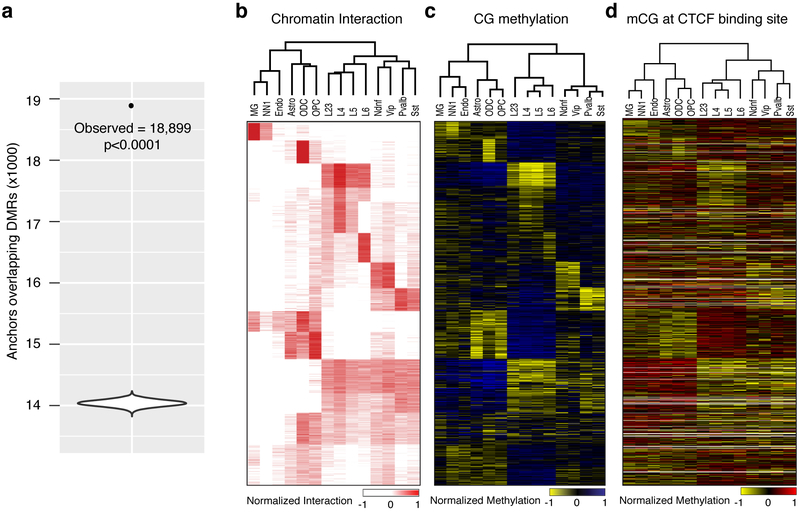
Dynamic three-dimensional chromatin conformation is a critical mechanism for gene regulation during development and disease. Despite this, profiling of three-dimensional genome structure from complex tissues with cell-type specific resolution remains challenging. Recent efforts have demonstrated that cell-type specific epigenomic features can be resolved in complex tissues using single-cell assays. However, it remains unclear whether single-cell chromatin conformation capture (3C) or Hi-C profiles can effectively identify cell types and reconstruct cell-type specific chromatin conformation maps. To address these challenges, we have developed single-nucleus methyl-3C sequencing to capture chromatin organization and DNA methylation information and robustly separate heterogeneous cell types. Applying this method to >4,200 single human brain prefrontal cortex cells, we reconstruct cell-type specific chromatin conformation maps from 14 cortical cell types. These datasets reveal the genome-wide association between cell-type specific chromatin conformation and differential DNA methylation, suggesting pervasive interactions between epigenetic processes regulating gene expression.


Figures

Figure 1.
Figure 1.. Outline of the single-nucleus methyl-3C sequencing (sn-m3C-seq) method.
Samples are processed with a typical in situ 3C/Hi-C procedure following by single-cell DNA methylome library preparation using snmC-seq2.
Figure 2.
Figure 2.. Data processing and analysis of m3C-seq sequencing reads.
Reads derived from non-bisulfite treated regular Hi-C sequencing are converted C to T (read1) and G to A (read2) in silico and aligned using BWA-meth, Bismark (bowtie1), and Bismark (bowtie1) followed by split-read alignment. Alignment of non-converted reads using conventional alignment pipeline is used as a standard (Conventional, Non-converted). For (a-d), the mapping algorithms were applied to a common test dataset (n=1) to make a fair comparison of their performance. (a) Percent of aligned reads as a pair. (b) Alignment accuracy of different alignment strategies compared with conventional Hi-C alignment using in silico converted reads. (c) Fraction of read pairs with cis short-range reads (cis < 1kb), cis long-range interactions (cis > 1kb), and trans interactions (trans) using different alignment strategies. (d) Similar to panel (c), but for 3C-seq (without conversion), bulk m3C-seq (with conversion, from the same sample as bulk 3C-seq), and combined 192 single-nucleus m3C-seq results. (e) Contact maps from chromosome 17 for conventional bulk Hi-C and bulk m3C data. (f) mC profiles near the Pou5f1 gene for conventional bulk MethylC-seq as well bulk m3C-seq. The experiment was repeated twice independently with similar results.
Figure 3.
Figure 3.. Bulk and single-nucleus m3C-seq of mouse embryonic stem cells.
(a) Comparison of HiC and bulk m3C-seq chromatin contact profiles . Green bar plot shows CpG methylation level from m3C-seq. (b) Reconstructed mESC chromatin conformation map from sn-m3C-seq profiles compared to Hi-C or bulk m3C-seq. Red bar plot shows CpG methylation level from sn-m3C-seq. (c) Bulk and single-nucleus m3C-seq chromatin contact profiles of the Sox2 locus in mESC compared to published HiC data generated from mESC, cortical neurons (CN) and neural progenitor cells (NPC). . (d) Bulk and single-nucleus m3C-seq DNA methylation profiles at Dppa2/4 locus compared to published methylome data generated from mESC, mouse CN and frontal cortex. The experiment was repeated twice independently with similar results.
Figure 4.
Figure 4.. Single-nucleus m3C-seq reconstructs cell-type specific chromatin conformation maps.
(a) tSNE of single-cell mC profiles of mouse ES cells and NMuMG cells . (b) Chromosome wide Pearson correlation matrix from pooled sc-m3C-seq maps for ES cells and NMuMG cells . (c-d) Principal component analysis (PCA) of whole genome contact matrices from sc-m3C-seq from ES from NMuMG cells (Percentage of variance are marked on the axis). PC1 and PC2 are shown in (c); PC1 and PC3 are shown in (d). (e) PCA of local interactions (<2Mb) from sc-m3C-seq data from NMuMG cells showing PC1 and PC2. (f) Correlation of PC1 and per cell contacts . For (a) and (c-f), n=2 independently prepared mouse ES cell cultures were analyzed. The two mESC replicates each contained 379 and 93 cells. One (n=1) replicate of NMuMG cells containing 96 cells was analyzed.
Figure 5.
Figure 5.. Single-nucleus m3C-seq in human brain prefrontal cortex (PFC).
(a-c) Dimension reduction (t-Distributed Stochastic Neighbor Embedding, tSNE) visualization of single human PFC cells using mCH (a) and mCG (b) of non-overlapping 100kb genomic bins, or chromatin interaction at 1Mb resolution (c). L2/3, L4, L5 and L6: excitatory neuron subtypes located in different cortical layers. Ndnf and Vip: CGE derived inhibitory sub-types. Pvalb and Sst: MGE derived inhibitory sub-types. Astro: astrocyte. ODC: oligodendrocyte. OPC: oligodendrocyte progenitor cell. MG: microglia. NN1: non-neuronal cell type 1. Endo: endothelial cell. (d) looping between the SATB2 and LINC01923 locus in excitatory neuron (L2/3, L4, L5 and L6) (e) chromatin looping between PROX1 and RPS6KC1 region in CGE derived inhibitory cell types - Vip and Ndnf. (f-g) mCH (f) and mCG (g) levels at SATB2 locus in excitatory neuron clusters. (h-i) mCH (h) and mCG (i) levels at PROX1 locus in CGE derived inhibitory neuron clusters. All analyses were performed with 4,238 sn-m3C-seq profiles generated from n=2 independent human specimen.
Figure 6.
Figure 6.. Differential mC signature associated with cell-type specific chromatin interactions .
(a The violin plot of the distribution of the overlap between permuted differential interacting region anchor sites and DMRs ; the labelled point indicates the observed overlap. Violin plot elements: maximum=14,234; minimum=13,822; mean=14038.7. (DMRs, p<0.0001, two-sided permutation test, n=10,000 permutations). (b-d) Heatmap visualization of cell-type specific chromatin interaction (b), CG methylation at anchor regions (c) and CG methylation at CTCF binding sites overlapping with the anchor regions (d).

References

    1. Dixon JR, Gorkin DU & Ren B Chromatin Domains: The Unit of Chromosome Organization. Mol. Cell 62, 668–680 (2016). - PMC - PubMed
    1. Rowley MJ & Corces VG The three-dimensional genome: principles and roles of long-distance interactions. Curr. Opin. Cell Biol. 40, 8–14 (2016). - PMC - PubMed
    1. Dekker J & Heard E Structural and functional diversity of Topologically Associating Domains. FEBS Lett. 589, 2877–2884 (2015). - PMC - PubMed
    1. Dixon JR et al. Topological domains in mammalian genomes identified by analysis of chromatin interactions. Nature 485, 376–380 (2012). - PMC - PubMed
    1. Nora EP et al. Spatial partitioning of the regulatory landscape of the X-inactivation centre. Nature 485, 381–385 (2012). - PMC - PubMed

Methods Only References

    1. Langmead B Aligning short sequencing reads with Bowtie. Curr. Protoc. Bioinformatics 32, 11–17 (2010). - PMC - PubMed
    1. Abdennur N & Mirny L Cooler: scalable storage for Hi-C data and other genomically-labeled arrays. doi:10.1101/557660 - DOI - PMC - PubMed
    1. Kerpedjiev P et al. HiGlass: web-based visual exploration and analysis of genome interaction maps. Genome Biol. 19, 125 (2018). - PMC - PubMed
    1. Schultz MD et al. Human body epigenome maps reveal noncanonical DNA methylation variation. Nature 523, 212–216 (2015). - PMC - PubMed
    1. Daley T & Smith AD Predicting the molecular complexity of sequencing libraries. Nat. Methods 10, 325–327 (2013). - PMC - PubMed

Publication types