. 2019 Nov 1;142(11):3502-3513.
doi: 10.1093/brain/awz269.

Interictal epileptiform discharges shape large-scale intercortical communication

Affiliations

Interictal epileptiform discharges shape large-scale intercortical communication

Prawesh Dahal et al. Brain. .

Abstract

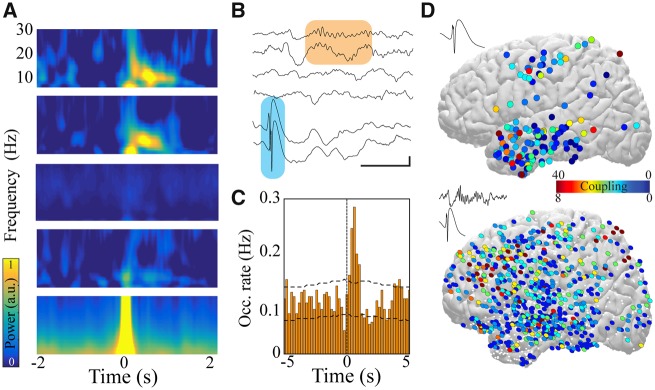
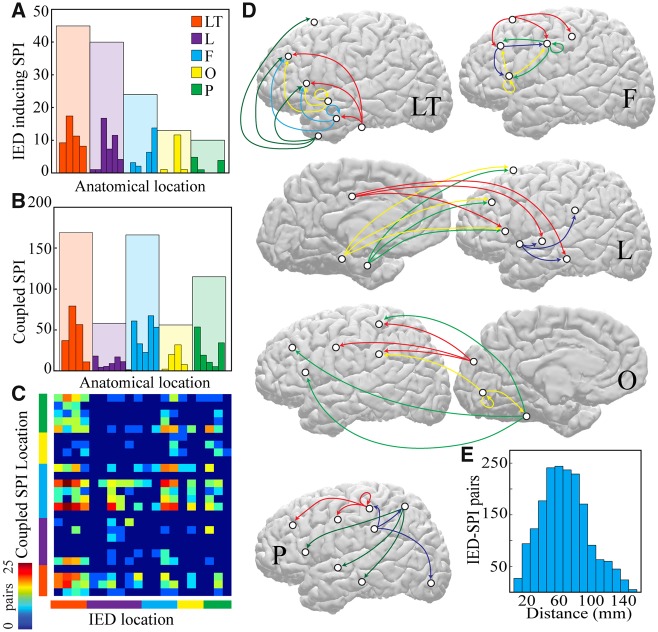
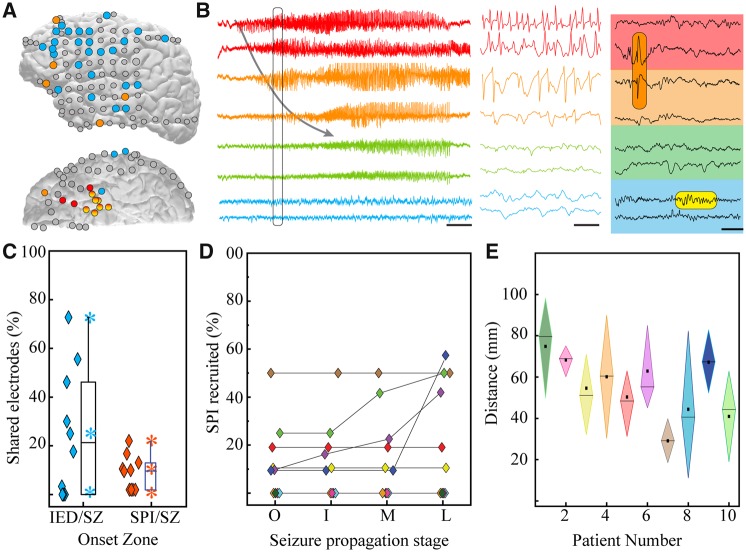
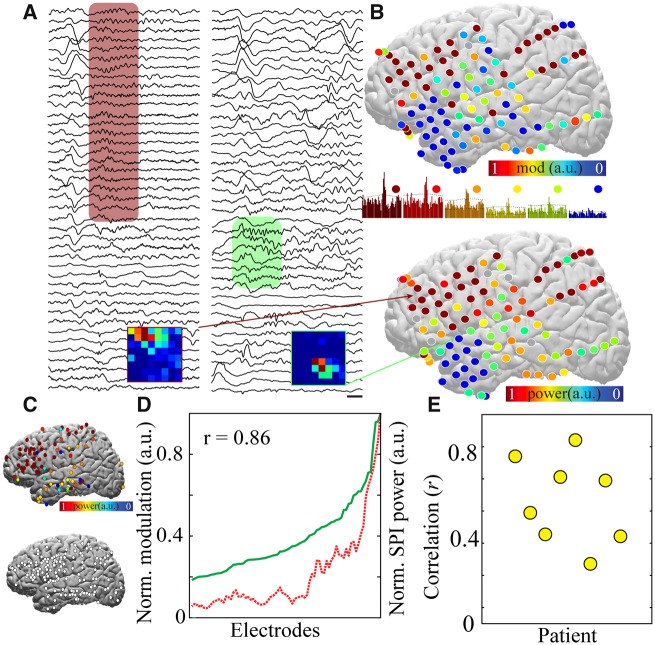
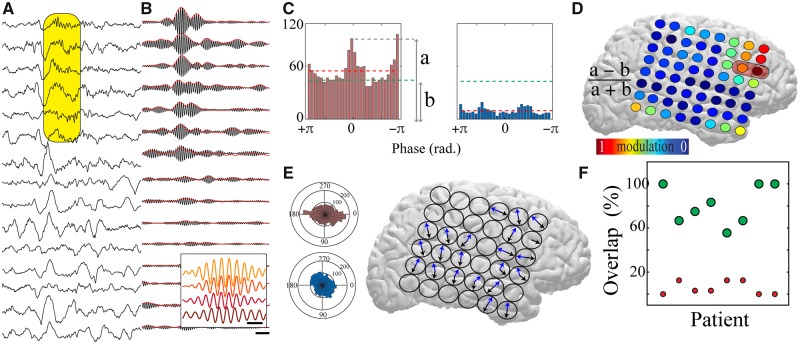
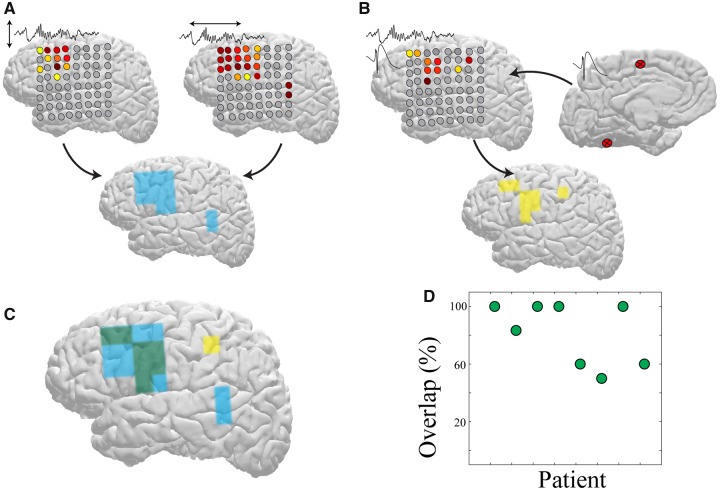
Dynamic interactions between remote but functionally specialized brain regions enable complex information processing. This intercortical communication is disrupted in the neural networks of patients with focal epilepsy, and epileptic activity can exert widespread effects within the brain. Using large-scale human intracranial electroencephalography recordings, we show that interictal epileptiform discharges (IEDs) are significantly coupled with spindles in discrete, individualized brain regions outside of the epileptic network. We found that a substantial proportion of these localized spindles travel across the cortical surface. Brain regions that participate in this IED-driven oscillatory coupling express spindles that have a broader spatial extent and higher tendency to propagate than spindles occurring in uncoupled regions. These altered spatiotemporal oscillatory properties identify areas that are shaped by epileptic activity independent of IED or seizure detection. Our findings suggest that IED-spindle coupling may be an important mechanism of interictal global network dysfunction that could be targeted to prevent disruption of normal neural activity.

Keywords: epilepsy; intercortical; interictal epileptiform discharge; oscillation; sleep spindle.


Figures

Figure 1
Figure 1
IEDs induce spindles in patients with focal epilepsy. (A) IED trigger-averaged spectrograms derived from different electrodes reveal distinct patterns of activity: coupled spindle (top two panels), no change (middle two panels), and temporally locked IED (bottom). (B) Sample raw traces of detected IEDs (shaded blue box) and coupled cortical spindles (shaded orange box). Scale bar = 1 s, 200 μV. (C) Sample cross-correlogram demonstrating significant IED-spindle coupling. IED occurrence times served as reference (time = 0, vertical dashed line) and horizontal dashed lines represent 95% confidence intervals. (D) Anatomical location of electrodes expressing IEDs that couple to spindles across all patients (top) and anatomical location of electrodes expressing spindles that are coupled to IEDs across all patients (bottom) projected onto lateral cortical surface (left hemisphere view; right hemisphere locations converted to left for display purposes). Colour represents number of significant IED-spindle coupling interactions per electrode location across patients. White dots show electrode locations that do not express IED-spindle coupling.
Figure 2
Figure 2
Medium and long-range connections are implicated in IED-spindle coupling. (A) Number of electrodes expressing IEDs that couple to spindles across all patients divided by anatomical lobe. (B) Number of electrodes expressing spindles that are coupled to IEDs across all patients divided by lobe. (C) Number of IED-spindle pairs per brain region; lobes colour-coded as in A and B. Warmer colours indicate more pairs; ordered list of individual brain regions is in Supplementary Table 2. (D) Schematics showing the most prominent IED-spindle anatomical pairings across patients for each brain region expressing IEDs, separated by lobe and projected onto lateral and medial cortical surfaces (left hemisphere view; right hemisphere locations converted to left for display purposes). Origin of arrow indicates location of IED electrode; destination indicates location of coupled SPI electrode. White circles show location of each brain region and colours separate pairings of individual IED electrode locations. (E) Histogram of average distance between pairs of electrodes that interact via IED-spindle coupling. F = frontal; L = limbic; LT = lateral temporal; O = occipital; P = parietal; SPI = spindle.
Figure 3
Figure 3
Brain regions that demonstrate spindles coupled to IEDs are located outside of the ictal network. (A) Sample patient brain (lateral and inferior views) displaying localization of seizure onset zone (red), IED foci (orange), and regions with spindles coupled to IEDs (blue). (B) Raw compressed (left, scale bar = 5 s) and expanded (middle, from section of left panel defined by black box, scale bar = 125 ms) traces revealing the onset and propagation of ictal activity from electrodes in the seizure onset zone (red), middle propagation zone (orange), and late propagation zone (green). Traces from the IED-spindle coupling zone (blue) are not recruited into the ictal rhythm. Right panel shows interictal activity from these same electrodes, highlighting an IED (orange shaded box) and coupled spindle (yellow shaded box; scale bar = 200 ms) during NREM sleep. (C) Percentage of overlap between electrodes across patients constituting the seizure onset zone and those expressing IEDs (blue) as well as those expressing IED-coupled spindles (orange). Box shows 25th, median and 75th percentiles; stars show range and mean. Diamonds are individual data points for each patient. (D) Percentage of total electrodes expressing IED-coupled spindles that are recruited into successive stages of ictal activity (colours represent individual patients). I = initial propagation; L = late propagation; M = middle propagation; O = onset. (E) Measures of centrality and dispersion for distance between electrodes expressing IED-coupled spindles and centroid of seizure onset zone (diamond shows 25th, median, and 75th percentiles; square is mean). SZ = seizure.
Figure 4
Figure 4
IED-spindle coupling is associated with broader spindle spatial extent across the cortical surface. (A) Sample raw traces from 41 electrodes in a sample patient demonstrating a spatially extensive spindle (red shaded box, left) and spatially restricted spindle (green shaded box, right). Scale bar = 250 ms. Insets show the amount of spindle-spindle cross-correlation across the subdural grid using a reference electrode from the spatially extensive and restricted regions, respectively; warmer colours indicate higher zero-bin significant cross-correlation. (B) Comparison of electrode locations demonstrating spindles highly coupled with IEDs (top, warmer colours) and electrode locations with broad spindle spatial extent (bottom, warmer colours) from a sample patient. IED-spindle cross-correlograms with a range of significant correlations corresponding to electrode colours (middle; 10-s duration). (C) Normalized spindle spatial extent for all spindle electrodes (top) and spatially extensive spindle electrodes only (top 50th percentile, bottom) summated across patients and plotted on lateral cortical surface, revealing no anatomical preference for spindle spatial extent and existence of spatially extensive spindles in all lobes. (D) Significance of IED-spindle coupling (red) and spindle spatial extent (green) are highly correlated across electrodes for patient visualized in A and B. (E) Correlation between IED-spindle coupling and spindle spatial extent for all patients with >20 significant IED-spindle pairs, n = 8.
Figure 5
Figure 5
Localized spindles travel across the cortical surface in regions with IED-spindle coupling. (A) Sample raw traces from 15 electrodes of a subdural grid revealing a spatially localized propagating spindle (shaded yellow box; scale bar = 250 ms). (B) Traces from (A) filtered at spindle band (10–15 Hz) with rectified envelope in red. Inset shows expanded filtered traces from four electrodes within shaded yellow box, revealing consistent phase shifts (scale bar = 150 ms). (C) Modulation index extracted from the distribution of significant propagation angles from sample highly modulated electrode cluster (left) and minimally modulated electrode cluster (right). Dashed green line indicates the mean of the significant propagation angles across all the electrode clusters within the subdural grid (global mean) and dashed red line indicates the mean of the significant propagation angles in the individual electrode cluster (local mean). ‘a’ and ‘b’ represent the measures used to calculate modulation index (refer to ‘Materials and methods’ section). (D) Modulation index across a sample subdural grid; warm colours represent high modulation index. Red shaded box shows region displaying maximal IED-spindle coupling. (E) Polar plots demonstrating the propagation directions for the electrode clusters shown in C (left). Directions of preferred spindle travelling for all electrode clusters across a sample subdural grid are shown (right); note that the majority of clusters have two preferred directions of travel (blue and black arrows). (F) The majority of electrodes expressing spindles coupled to IEDs fall within the zone of maximal travelling modulation index (green circles). Red circles show the percentage of high modulation index electrodes outside of the IED-spindle coupling zone.
Figure 6
Figure 6
Maximal spindle spatial extent and travelling predict brain regions influenced by IEDs. (A) Region of maximal spindle spatial extent (left) and maximal spindle travelling modulation index (right) obtained by watershed analysis of a sample patient’s subdural grid. The regions representing the union between these measures are identified in blue (bottom). (B) Regions of significant spindle coupling (left) to IEDs generated at regions marked on the right for the same patient as in A. Regions of IED-spindle coupling are identified in yellow (bottom). (C) Overlap between regions of maximally extensive propagating spindles and regions expressing spindles coupled to IEDs (green). (D) Percentage of overlap between regions of maximally extensive propagating spindles and regions expressing spindles coupled to IEDs across all patients with >20 significant IED-spindle pairs (n = 8).

Comment in

Similar articles

Cited by

References

    1. Alarcon G, Garcia Seoane JJ, Binnie CD, Martin Miguel MC, Juler J, Polkey CE, et al.Origin and propagation of interictal discharges in the acute electrocorticogram. Implications for pathophysiology and surgical treatment of temporal lobe epilepsy. Brain 1997; 120 (Pt 12): 2259–82. - PubMed
    1. Andrillon T, Nir Y, Staba RJ, Ferrarelli F, Cirelli C, Tononi G, et al.Sleep spindles in humans: insights from intracranial EEG and unit recordings. J Neurosci 2011; 31: 17821–34. - PMC - PubMed
    1. Bartolomei F, Lagarde S, Wendling F, McGonigal A, Jirsa V, Guye M, et al.Defining epileptogenic networks: Contribution of SEEG and signal analysis. Epilepsia 2017; 58: 1131–47. - PubMed
    1. Benchenane K, Peyrache A, Khamassi M, Tierney PL, Gioanni Y, Battaglia FP, et al.Coherent theta oscillations and reorganization of spike timing in the hippocampal- prefrontal network upon learning. Neuron 2010; 66: 921–36. - PubMed
    1. Bettus G, Ranjeva JP, Wendling F, Benar CG, Confort-Gouny S, Regis J, et al.Interictal functional connectivity of human epileptic networks assessed by intracerebral EEG and BOLD signal fluctuations. PLoS One 2011; 6: e20071. - PMC - PubMed