. 2020 Feb 15;36(4):1150-1158.
doi: 10.1093/bioinformatics/btz698.

scds: computational annotation of doublets in single-cell RNA sequencing data

Affiliations

scds: computational annotation of doublets in single-cell RNA sequencing data

Abha S Bais et al. Bioinformatics. .

Abstract

Motivation: Single-cell RNA sequencing (scRNA-seq) technologies enable the study of transcriptional heterogeneity at the resolution of individual cells and have an increasing impact on biomedical research. However, it is known that these methods sometimes wrongly consider two or more cells as single cells, and that a number of so-called doublets is present in the output of such experiments. Treating doublets as single cells in downstream analyses can severely bias a study's conclusions, and therefore computational strategies for the identification of doublets are needed.

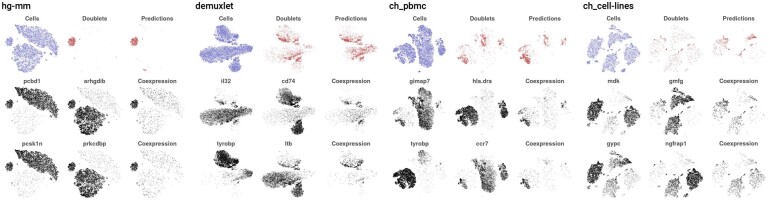
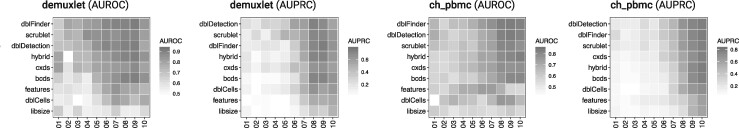
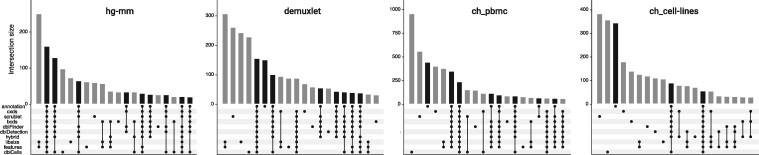
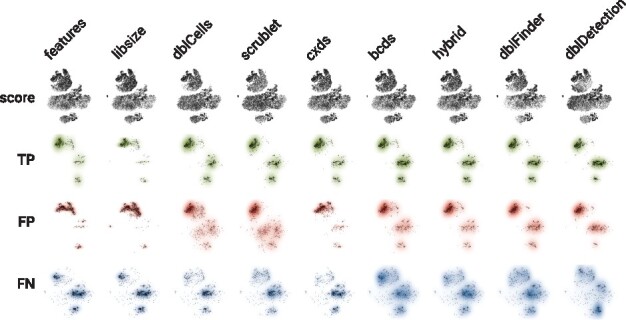
Results: With scds, we propose two new approaches for in silico doublet identification: Co-expression based doublet scoring (cxds) and binary classification based doublet scoring (bcds). The co-expression based approach, cxds, utilizes binarized (absence/presence) gene expression data and, employing a binomial model for the co-expression of pairs of genes, yields interpretable doublet annotations. bcds, on the other hand, uses a binary classification approach to discriminate artificial doublets from original data. We apply our methods and existing computational doublet identification approaches to four datasets with experimental doublet annotations and find that our methods perform at least as well as the state of the art, at comparably little computational cost. We observe appreciable differences between methods and across datasets and that no approach dominates all others. In summary, scds presents a scalable, competitive approach that allows for doublet annotation of datasets with thousands of cells in a matter of seconds.

Availability and implementation: scds is implemented as a Bioconductor R package (doi: 10.18129/B9.bioc.scds).

Supplementary information: Supplementary data are available at Bioinformatics online.


Figures

Fig. 1.
Fig. 1.
Gene pairs driving doublet prediction in cxds. For four datasets (panels) the first row shows all cells in (left), the annotated doublets (center) and cxds-predicted doublets (right). The following two rows depict the two gene pairs that contribute most to the cxds classifier (Section 2). For each pair (i.e. for each row), the left plot depicts the expression of one gene (presence/absence), the middle plot the expression of the other gene, while the right plot the average expression in cells that co-express both genes. We see that each gene in a pair is expressed in distinct groups of cells, and that their co-expression highlights annotated and predicted doublets
Fig. 2.
Fig. 2.
Performance of methods, stratified by library size. For two datasets, the first panel shows performance in terms of the area under the ROC curve (AUROC), while the second shows performance under the precision-recall curve (AUPRC), respectively. In each panel, the rows correspond to methods, and the columns to groups of cells in the same stratum of library sizes. The left-most column focuses on the 10% of cells with the lowest library size, the next column on the cells between the 10% and the 20% quantile and so on. In each panel methods are ranked by their average performance across quantile bins. See Supplementary Figure S1 for the remaining two datasets
Fig. 3.
Fig. 3.
Comparison of doublet predictions. For the four datasets (panels), we show upset plots (Conway et al., 2017) comparing doublet predictions for nine prediction methods (including baseline methods) with annotated doublet cells. Bars showing the size of intersections containing experimentally annotated doublets (termed ‘annotation’) are in black, bars showing intersections without experimentally annotated doublets are in gray. We show the 20 largest intersection sets. For demuxlet, ch_pbmc and ch_cell-lines the set of doublets that gets missed by all prediction methods (i.e. consistent false negatives) is ranked number six, three and three in terms of size, respectively
Fig. 4.
Fig. 4.
Visual comparison of doublet predictions for the demuxlet dataset. For nine computational doublet annotation methods (columns) cells are shown in a two-dimensional tSNE projection. The first row depicts all cells, shaded by the rank of the respective doublet prediction score. The second, third and fourth rows show true positive (TP, green), false positive (FP, red) and false negative (FN, blue) predictions. Shading reflects the relative density in each row, cells are shown in black

References

    1. AlJanahi A.A. et al. (2018) An introduction to the analysis of single-cell RNA-sequencing data. Mol. Ther. Methods Clin. Dev., 10, 189–196. - PMC - PubMed
    1. Alles J. et al. (2017) Cell fixation and preservation for droplet-based single-cell transcriptomics. BMC Biol., 15, 44.. - PMC - PubMed
    1. Bach K. et al. (2017) Differentiation dynamics of mammary epithelial cells revealed by single-cell RNA sequencing. Nat. Commun., 8, 2128.. - PMC - PubMed
    1. Butler A. et al. (2018) Integrating single-cell transcriptomic data across different conditions, technologies, and species. Nat. Biotechnol., 36, 411.. - PMC - PubMed
    1. Chen T., Guestrin C. (2016) XGBoost: a scalable tree boosting system. In: Proceedings of the 22nd ACM SIGKDD International Conference on Knowledge Discovery and Data Mining, KDD ’16. ACM, NY, USA, pp. 785–794.

Publication types