

The bivariate distribution of amyloid-β and tau: relationship with established neurocognitive clinical syndromes
- PMID: 31501889
- PMCID: PMC6763736
- DOI: 10.1093/brain/awz268
The bivariate distribution of amyloid-β and tau: relationship with established neurocognitive clinical syndromes
Abstract
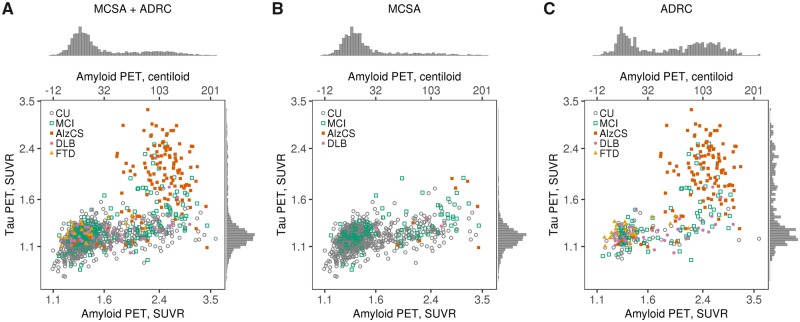
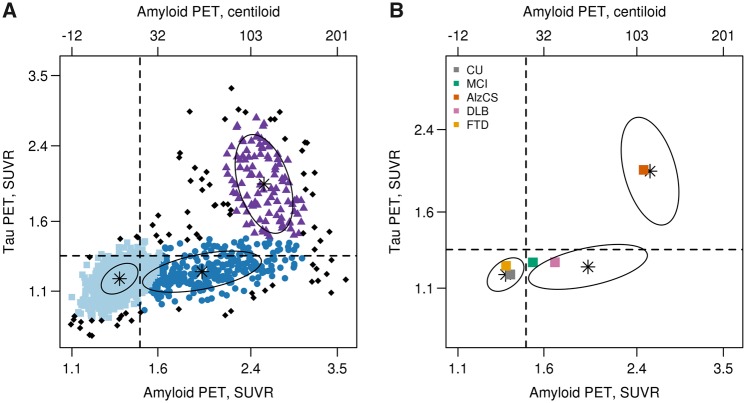
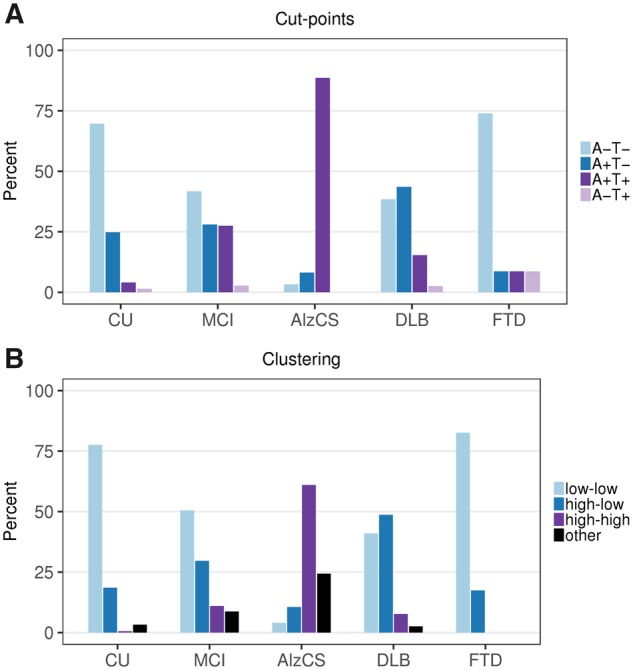
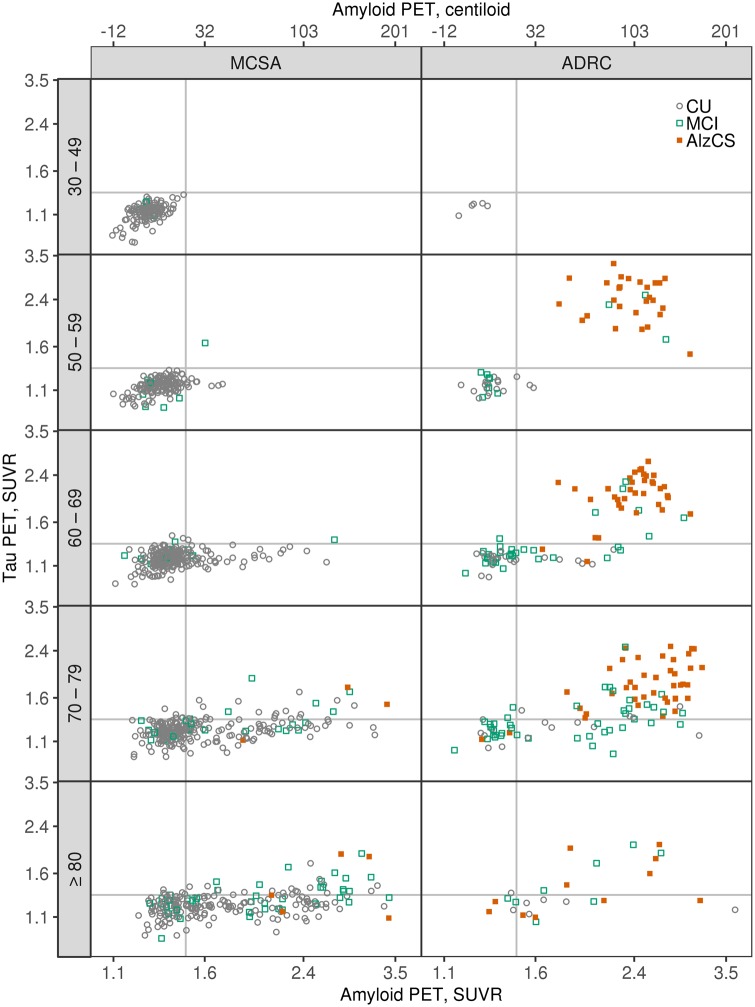
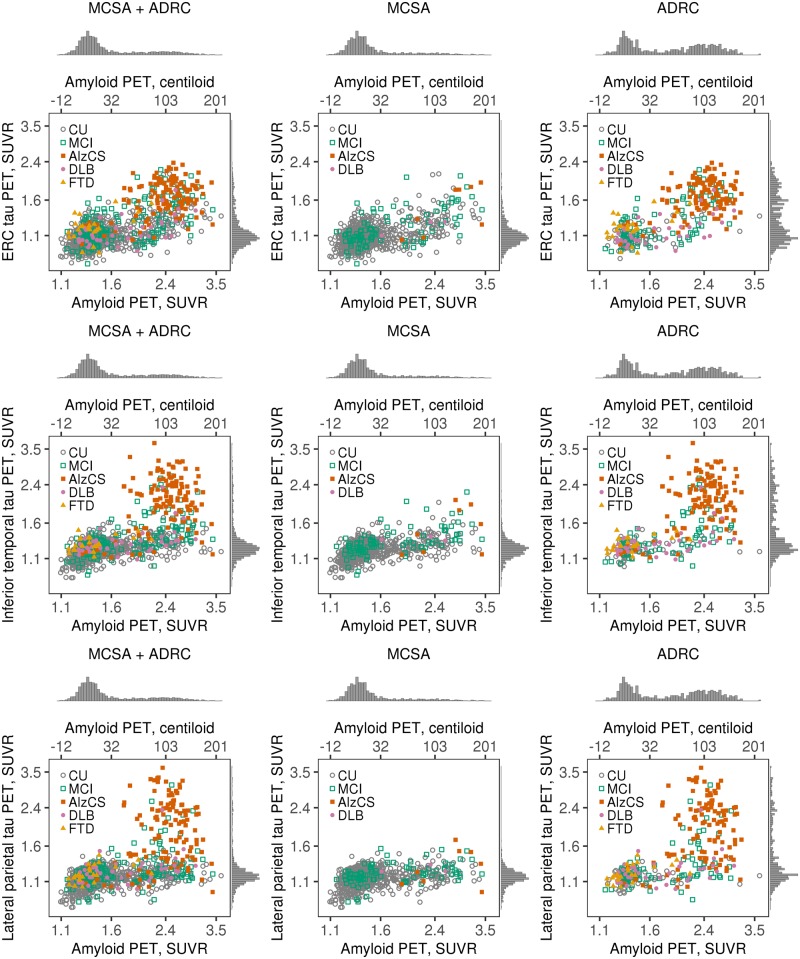
Large phenotypically diverse research cohorts with both amyloid and tau PET have only recently come into existence. Our objective was to determine relationships between the bivariate distribution of amyloid-β and tau on PET and established clinical syndromes that are relevant to cognitive ageing and dementia. All individuals in this study were enrolled in the Mayo Clinic Study of Aging, a longitudinal population-based study of cognitive ageing, or the Mayo Alzheimer Disease Research Center, a longitudinal study of individuals recruited from clinical practice. We studied 1343 participants who had amyloid PET and tau PET from 2 April 2015 to 3 May 2019, and met criteria for membership in one of five clinical diagnostic groups: cognitively unimpaired, mild cognitive impairment, frontotemporal dementia, probable dementia with Lewy bodies, and Alzheimer clinical syndrome. We examined these clinical groups in relation to the bivariate distribution of amyloid and tau PET values. Individuals were grouped into amyloid (A)/tau (T) quadrants based on previously established abnormality cut points of standardized uptake value ratio 1.48 (A) and 1.33 (T). Individual participants largely fell into one of three amyloid/tau quadrants: low amyloid and low tau (A-T-), high amyloid and low tau (A+T-), or high amyloid and high tau (A+T+). Seventy per cent of cognitively unimpaired and 74% of FTD participants fell into the A-T- quadrant. Participants with mild cognitive impairment spanned the A-T- (42%), A+T- (28%), and A+T+ (27%) quadrants. Probable dementia with Lewy body participants spanned the A-T- (38%) and A+T- (44%) quadrants. Most (89%) participants with Alzheimer clinical syndrome fell into the A+T+ quadrant. These data support several conclusions. First, among 1343 participants, abnormal tau PET rarely occurred in the absence of abnormal amyloid PET, but the reverse was common. Thus, with rare exceptions, amyloidosis appears to be required for high levels of 3R/4R tau deposition. Second, abnormal amyloid PET is compatible with normal cognition but highly abnormal tau PET is not. These two conclusions support a dynamic biomarker model in which Alzheimer's disease is characterized first by the appearance of amyloidosis and later by tauopathy, with tauopathy being the proteinopathy associated with clinical symptoms. Third, bivariate amyloid and tau PET relationships differed across clinical groups and thus have a role for clarifying the aetiologies underlying neurocognitive clinical syndromes.
Keywords: Alzheimer’s disease; amyloid PET; dementia with Lewy bodies; frontotemporal dementia; tau PET.
© The Author(s) (2019). Published by Oxford University Press on behalf of the Guarantors of Brain.
Figures
Comment in
-
Elevated tau PET signal depends on abnormal amyloid levels and is uncommon in unimpaired individuals.Brain. 2019 Oct 1;142(10):2903-2904. doi: 10.1093/brain/awz278. Brain. 2019. PMID: 31560059 Free PMC article.
References
-
- American Psychiatric Association. Diagnostic and statistical manual of mental disorders, DSM-IV. 4th edn. Washington, DC: American Psychiatric Association; 1994.
-
- Arriagada PV, Growdon JH, Hedley-Whyte ET, Hyman BT. Neurofibrillary tangles but not senile plaques parallel duration and severity of Alzheimer’s disease. Neurology 1992; 42 (3 Pt 1): 631–9. - PubMed
-
- Banfield JD, Raftery AE. Model-based Gaussian and non-Gaussian clustering. Biometrics 1993; 49: 803–21.
Publication types
MeSH terms
Substances
Grants and funding
LinkOut - more resources
Full Text Sources
Other Literature Sources
Medical
Miscellaneous
