

Genome-Scale Characterization of Toxicity-Induced Metabolic Alterations in Primary Hepatocytes
- PMID: 31501904
- PMCID: PMC6876259
- DOI: 10.1093/toxsci/kfz197
Genome-Scale Characterization of Toxicity-Induced Metabolic Alterations in Primary Hepatocytes
Abstract
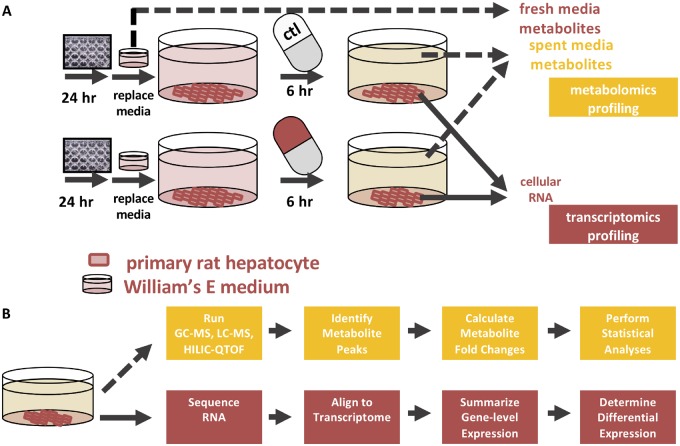
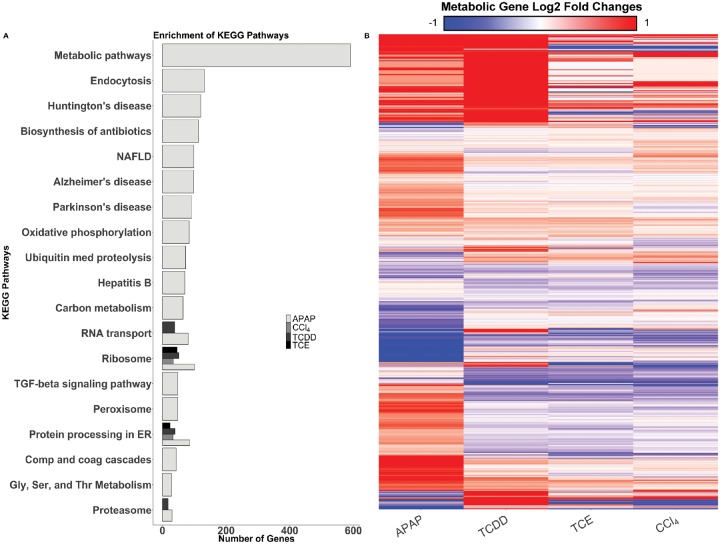
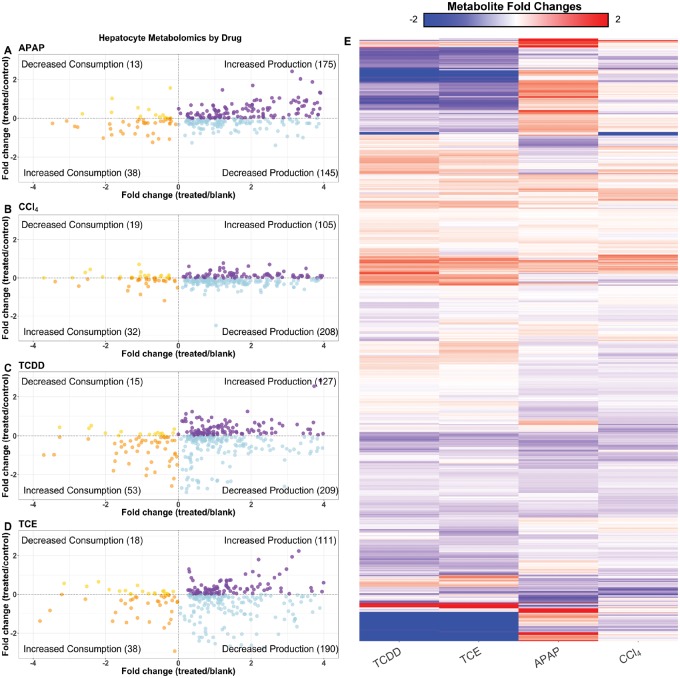
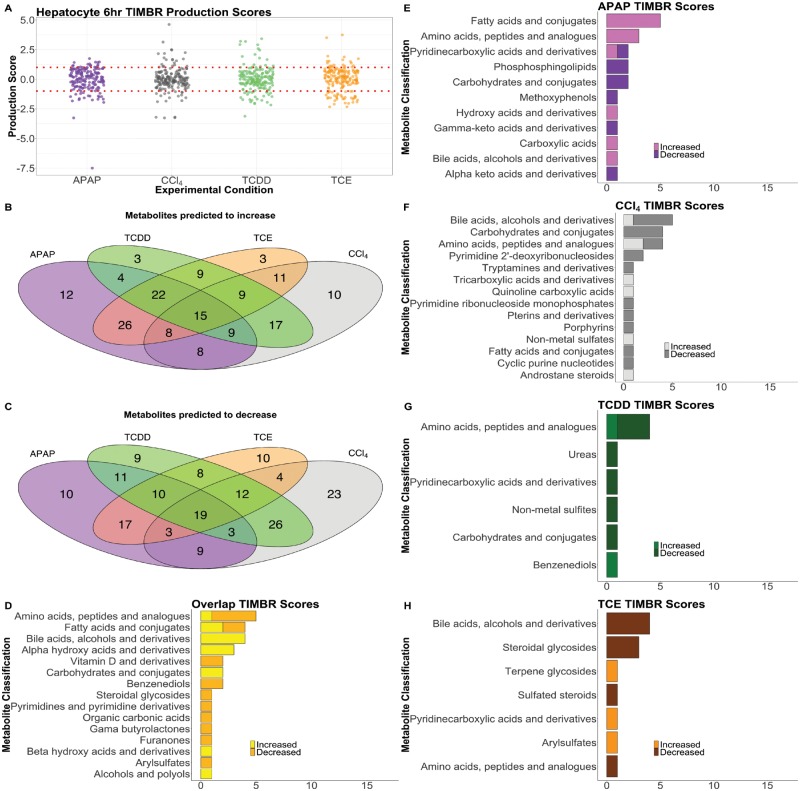
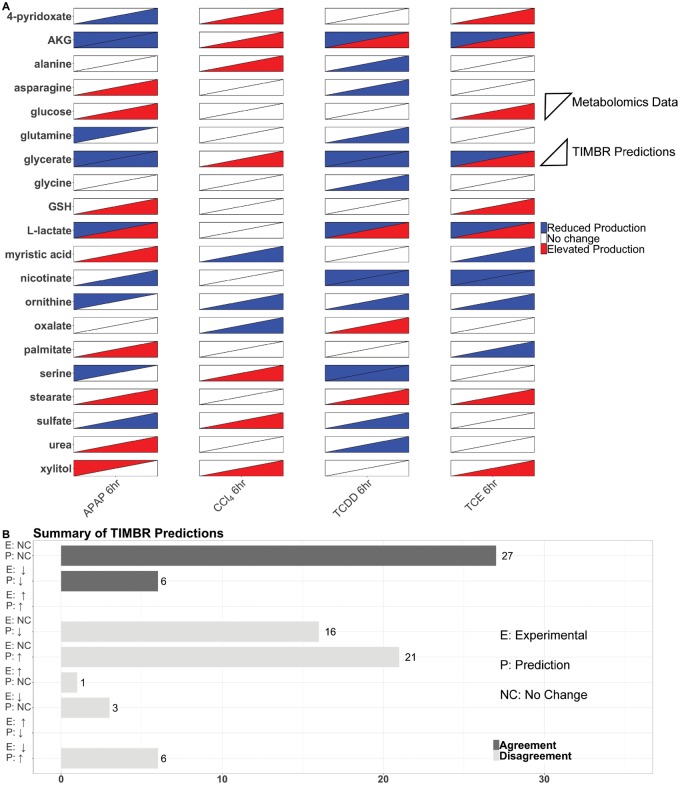
Context-specific GEnome-scale metabolic Network REconstructions (GENREs) provide a means to understand cellular metabolism at a deeper level of physiological detail. Here, we use transcriptomics data from chemically-exposed rat hepatocytes to constrain a GENRE of rat hepatocyte metabolism and predict biomarkers of liver toxicity using the Transcriptionally Inferred Metabolic Biomarker Response algorithm. We profiled alterations in cellular hepatocyte metabolism following in vitro exposure to four toxicants (acetaminophen, carbon tetrachloride, 2,3,7,8-tetrachlorodibenzodioxin, and trichloroethylene) for six hour. TIMBR predictions were compared with paired fresh and spent media metabolomics data from the same exposure conditions. Agreement between computational model predictions and experimental data led to the identification of specific metabolites and thus metabolic pathways associated with toxicant exposure. Here, we identified changes in the TCA metabolites citrate and alpha-ketoglutarate along with changes in carbohydrate metabolism and interruptions in ATP production and the TCA Cycle. Where predictions and experimental data disagreed, we identified testable hypotheses to reconcile differences between the model predictions and experimental data. The presented pipeline for using paired transcriptomics and metabolomics data provides a framework for interrogating multiple omics datasets to generate mechanistic insight of metabolic changes associated with toxicological responses.
Keywords: constraint-based modeling; metabolism; metabolomics; toxicology; transcriptomics.
© The Author(s) 2019. Published by Oxford University Press on behalf of the Society of Toxicology.
Figures
Similar articles
-
Toxicant-Induced Metabolic Alterations in Lipid and Amino Acid Pathways Are Predictive of Acute Liver Toxicity in Rats.Int J Mol Sci. 2020 Nov 4;21(21):8250. doi: 10.3390/ijms21218250. Int J Mol Sci. 2020. PMID: 33158035 Free PMC article.
-
Predicting changes in renal metabolism after compound exposure with a genome-scale metabolic model.Toxicol Appl Pharmacol. 2021 Feb 1;412:115390. doi: 10.1016/j.taap.2020.115390. Epub 2020 Dec 31. Toxicol Appl Pharmacol. 2021. PMID: 33387578 Free PMC article.
-
GC-MS metabolomics reveals disturbed metabolic pathways in primary mouse hepatocytes exposed to subtoxic levels of 3,4-methylenedioxymethamphetamine (MDMA).Arch Toxicol. 2018 Nov;92(11):3307-3323. doi: 10.1007/s00204-018-2314-9. Epub 2018 Sep 25. Arch Toxicol. 2018. PMID: 30255327
-
Toward modeling metabolic state from single-cell transcriptomics.Mol Metab. 2022 Mar;57:101396. doi: 10.1016/j.molmet.2021.101396. Epub 2021 Nov 14. Mol Metab. 2022. PMID: 34785394 Free PMC article. Review.
-
Review: toxicometabolomics.J Appl Toxicol. 2013 Dec;33(12):1365-83. doi: 10.1002/jat.2874. Epub 2013 May 30. J Appl Toxicol. 2013. PMID: 23722930 Free PMC article. Review.
Cited by
-
Loss of the Kidney Urate Transporter, Urat1, Leads to Disrupted Redox Homeostasis in Mice.Antioxidants (Basel). 2023 Mar 22;12(3):780. doi: 10.3390/antiox12030780. Antioxidants (Basel). 2023. PMID: 36979028 Free PMC article.
-
The impact of fine particulate matter (PM) on various beneficial functions of human endometrial stem cells through its key regulator SERPINB2.Exp Mol Med. 2021 Dec;53(12):1850-1865. doi: 10.1038/s12276-021-00713-9. Epub 2021 Dec 2. Exp Mol Med. 2021. PMID: 34857902 Free PMC article.
-
Metabolic modeling of sex-specific tissue predicts mechanisms of differences in toxicological responses.bioRxiv [Preprint]. 2023 Feb 7:2023.02.07.527430. doi: 10.1101/2023.02.07.527430. bioRxiv. 2023. Update in: PLoS Comput Biol. 2023 Aug 21;19(8):e1010927. doi: 10.1371/journal.pcbi.1010927. PMID: 36798158 Free PMC article. Updated. Preprint.
-
Toxicant-Induced Metabolic Alterations in Lipid and Amino Acid Pathways Are Predictive of Acute Liver Toxicity in Rats.Int J Mol Sci. 2020 Nov 4;21(21):8250. doi: 10.3390/ijms21218250. Int J Mol Sci. 2020. PMID: 33158035 Free PMC article.
-
Mechanistic models of microbial community metabolism.Mol Omics. 2021 Jun 14;17(3):365-375. doi: 10.1039/d0mo00154f. Mol Omics. 2021. PMID: 34125127 Free PMC article. Review.
References
-
- Aly H. A. A., Domènech Ò. (2009). Cytotoxicity and mitochondrial dysfunction of 2, 3, 7, 8-tetrachlorodibenzo-p-dioxin (TCDD) in isolated rat hepatocytes. Toxicol. Lett. 191, 79–87. - PubMed
-
- Beger R. D., Sun J., Schnackenberg L. K. (2010). Metabolomics approaches for discovering biomarkers of drug-induced hepatotoxicity and nephrotoxicity. Toxicol. Appl. Pharmacol. 243, 154–166. - PubMed
Publication types
MeSH terms
Substances
LinkOut - more resources
Full Text Sources
Molecular Biology Databases
