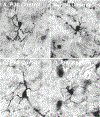
Development and sensory experience dependent regulation of microglia in barrel cortex
- PMID: 31502243
- PMCID: PMC6944757
- DOI: 10.1002/cne.24771
Development and sensory experience dependent regulation of microglia in barrel cortex
Abstract
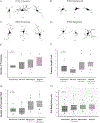
The barrel cortex is within the primary somatosensory cortex of the rodent, and processes signals from the vibrissae. Much focus has been devoted to the function of neurons, more recently, the role of glial cells in the processing of sensory input has gained increasing interest. Microglia are the principal immune cells of the nervous system that survey and regulate the cellular constituents of the dynamic nervous system. We investigated the normal and disrupted development of microglia in barrel cortex by chronically depriving sensory signals via whisker trimming for the animals' first postnatal month. Using immunohistochemistry to label microglia, we performed morphological reconstructions as well as densitometry analyses as a function of developmental age and sensory experience. Findings suggest that both developmental age and sensory experience has profound impact on microglia morphology. Following chronic sensory deprivation, microglia undergo a morphological transition from a monitoring or resting state to an altered morphological state, by exhibiting expanded cell body size and retracted processes. Sensory restoration via whisker regrowth returns these morphological alterations back to age-matched control values. Our results indicate that microglia may be recruited to participate in the modulation of neuronal structural remodeling during developmental critical periods and in response to alteration in sensory input.
Keywords: RRID: AB_2224402; RRID: AB_2313661; RRID: AB_2336126; RRID: AB_2339392; RRID: AB_2339427; RRID: AB_2340111; barrel cortex; microglial morphology; sensory deprivation; somatosensory cortex; vibrissae.
© 2019 Wiley Periodicals, Inc.
Conflict of interest statement
Competing interests
The authors declare they have no competing interests
Figures


Similar articles
-
The impact of development and sensory deprivation on dendritic protrusions in the mouse barrel cortex.Cereb Cortex. 2015 Jun;25(6):1638-53. doi: 10.1093/cercor/bht415. Epub 2014 Jan 9. Cereb Cortex. 2015. PMID: 24408954 Free PMC article.
-
Experience-Dependent Intrinsic Plasticity in Layer IV of Barrel Cortex at Whisking Onset.eNeuro. 2025 Aug 19;12(8):ENEURO.0252-25.2025. doi: 10.1523/ENEURO.0252-25.2025. Print 2025 Aug. eNeuro. 2025. PMID: 40730470 Free PMC article.
-
Sensory deprivation differentially impacts the dendritic development of pyramidal versus non-pyramidal neurons in layer 6 of mouse barrel cortex.Brain Struct Funct. 2012 Apr;217(2):435-46. doi: 10.1007/s00429-011-0342-9. Epub 2011 Aug 23. Brain Struct Funct. 2012. PMID: 21861159 Free PMC article.
-
Development of the whisker-to-barrel cortex system.Curr Opin Neurobiol. 2018 Dec;53:29-34. doi: 10.1016/j.conb.2018.04.023. Epub 2018 May 5. Curr Opin Neurobiol. 2018. PMID: 29738998 Review.
-
Development and critical period plasticity of the barrel cortex.Eur J Neurosci. 2012 May;35(10):1540-53. doi: 10.1111/j.1460-9568.2012.08075.x. Eur J Neurosci. 2012. PMID: 22607000 Free PMC article. Review.
Cited by
-
The Microglial TREM2 Receptor Programs Hippocampal Development in a Mouse Model of Childhood Deprivation.bioRxiv [Preprint]. 2025 Aug 11:2025.08.11.669425. doi: 10.1101/2025.08.11.669425. bioRxiv. 2025. PMID: 40832299 Free PMC article. Preprint.
-
Sodium-glucose cotransporter 2 inhibitor ameliorates high fat diet-induced hypothalamic-pituitary-ovarian axis disorders.J Physiol. 2022 Nov;600(21):4549-4568. doi: 10.1113/JP283259. Epub 2022 Sep 20. J Physiol. 2022. PMID: 36048516 Free PMC article. Review.
-
Research priorities for neuroimmunology: identifying the key research questions to be addressed by 2030.Wellcome Open Res. 2021 Jul 29;6:194. doi: 10.12688/wellcomeopenres.16997.1. eCollection 2021. Wellcome Open Res. 2021. PMID: 34778569 Free PMC article.
-
Early-life maturation of the somatosensory cortex: sensory experience and beyond.Front Neural Circuits. 2024 Jul 8;18:1430783. doi: 10.3389/fncir.2024.1430783. eCollection 2024. Front Neural Circuits. 2024. PMID: 39040685 Free PMC article. Review.
-
Microglial Engulfment of Multisensory Terminals in the Midbrain Inferior Colliculus During an Early Critical Period.J Comp Neurol. 2025 Mar;533(3):e70033. doi: 10.1002/cne.70033. J Comp Neurol. 2025. PMID: 40023818
References
-
- Ahmed Z, Shaw G, Sharma VP, Yang C, McGowan E, & Dickson DW (2007). Actin-binding proteins coronin-la and IBA-1 are effective microglial markers for immunohistochemistry. The Journal of Histochemistry and Cytochemistry: Official Journal of the Histochemistry Society, 55(7), 687–700. 10.1369/jhc.6A7156.2007 - DOI - PubMed
-
- Alliot F, Godin I, & Pessac B (1999). Microglia derive from progenitors, originating from the yolk sac, and which proliferate in the brain. Brain Research. Developmental Brain Research, 117(2), 145–152. - PubMed
Publication types
MeSH terms
Grants and funding
LinkOut - more resources
Full Text Sources

