. 2019 Nov;1456(1):26-43.
doi: 10.1111/nyas.14227. Epub 2019 Sep 9.

Spatial regulation of GPR64/ADGRG2 signaling by β-arrestins and GPCR kinases

Affiliations

Spatial regulation of GPR64/ADGRG2 signaling by β-arrestins and GPCR kinases

Pedram Azimzadeh et al. Ann N Y Acad Sci. 2019 Nov.

Abstract

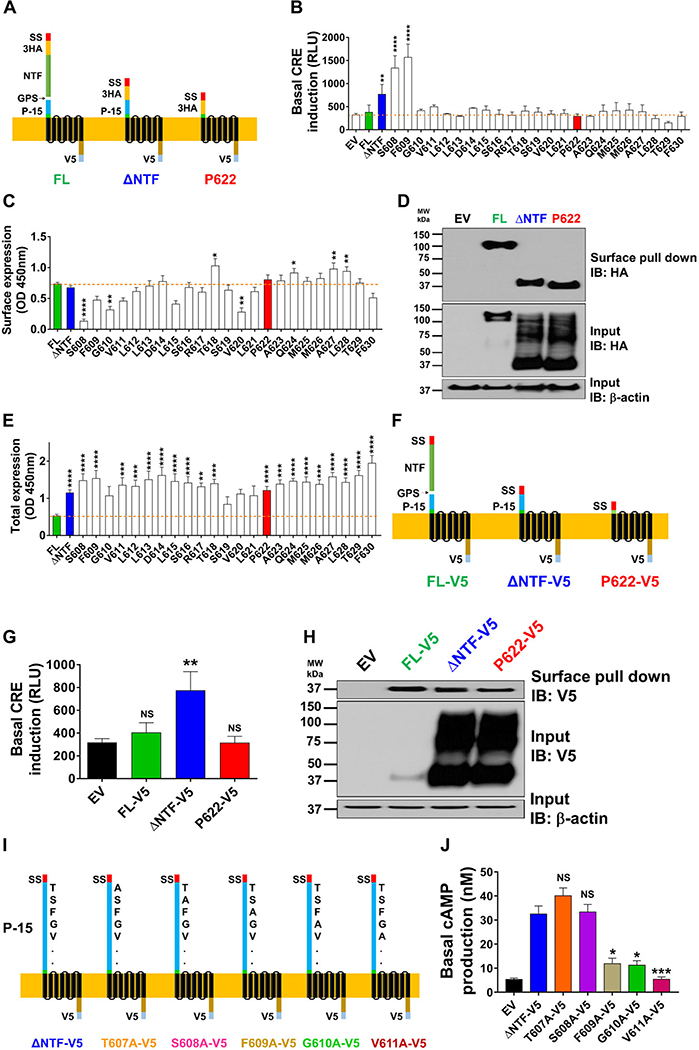
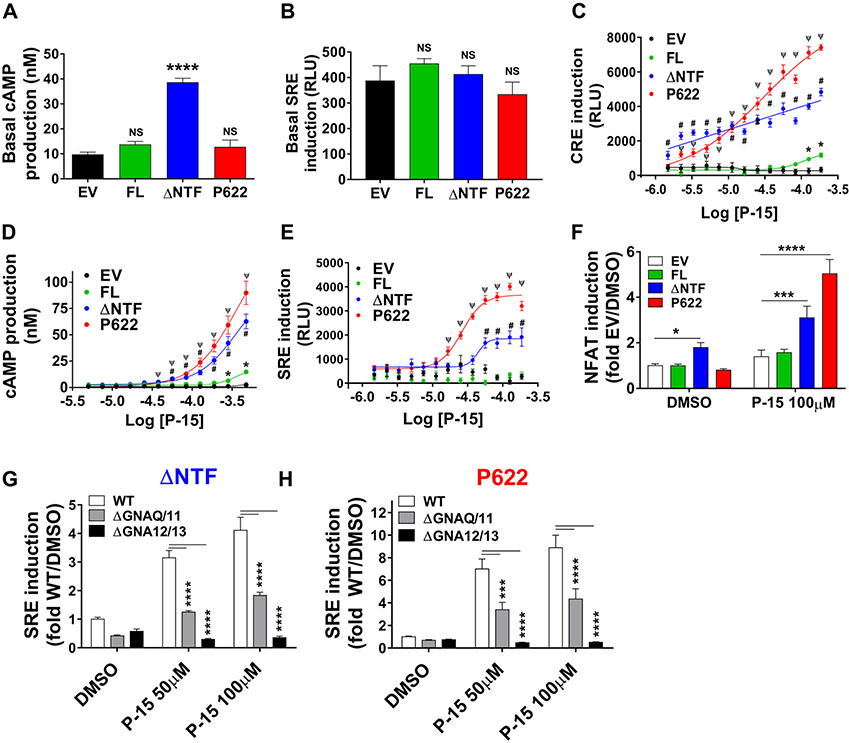
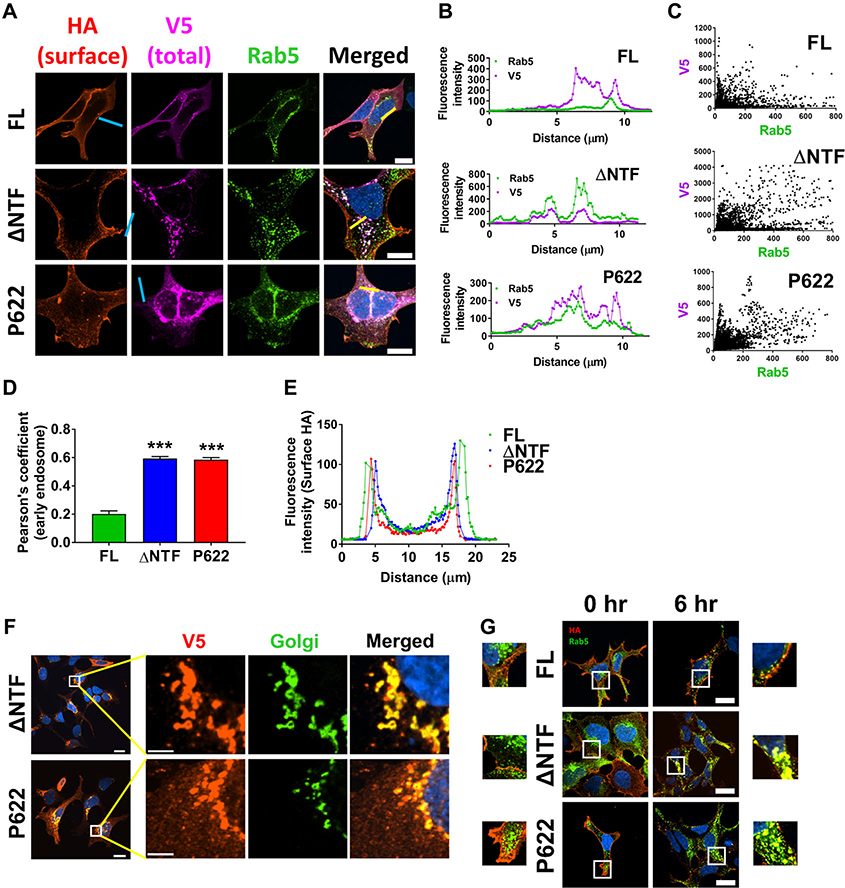
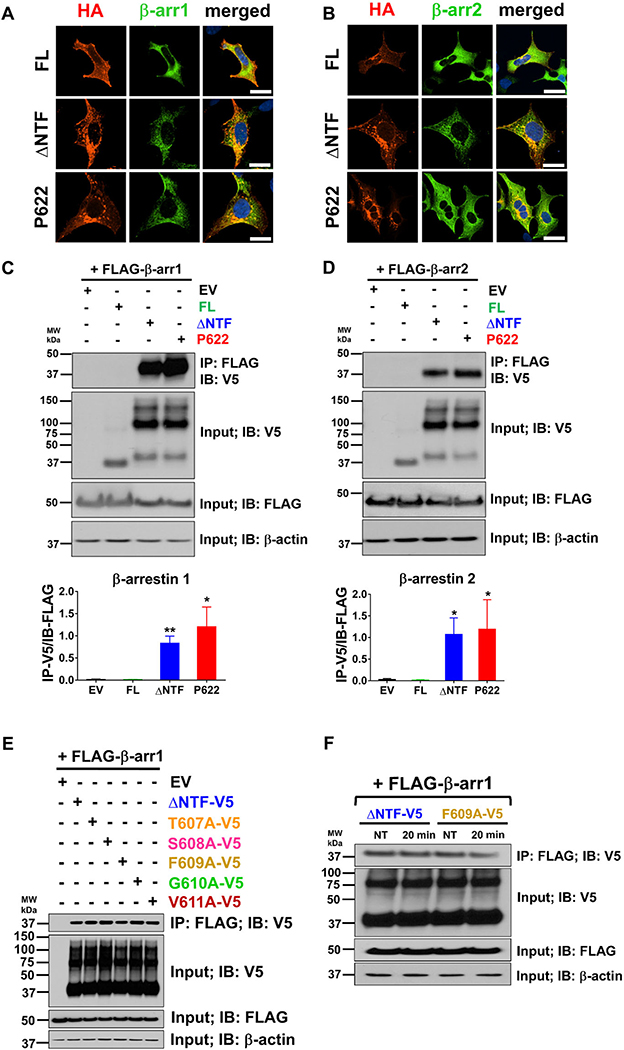
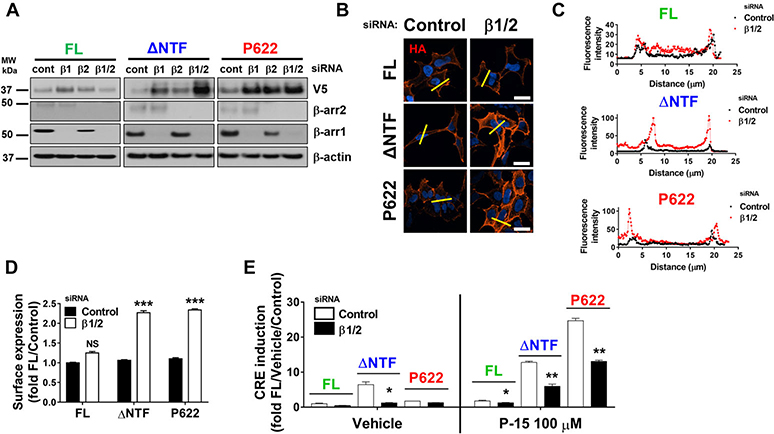
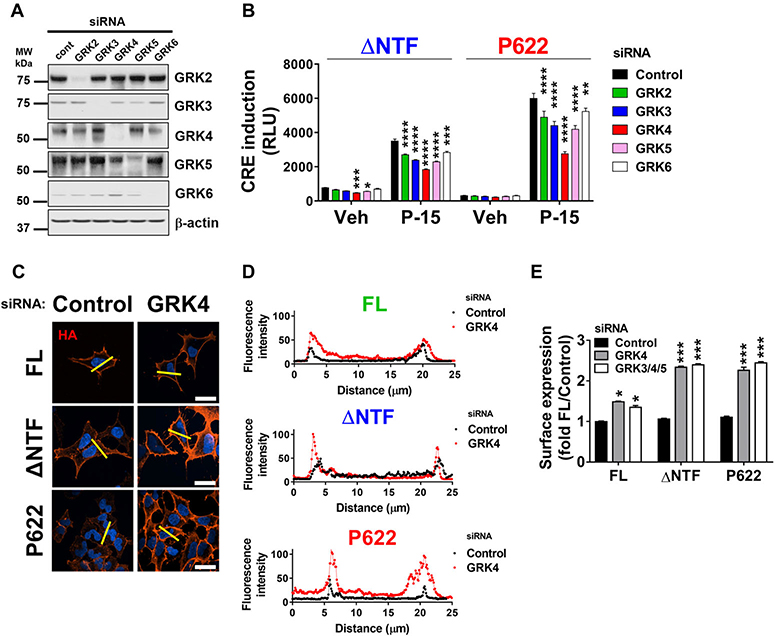
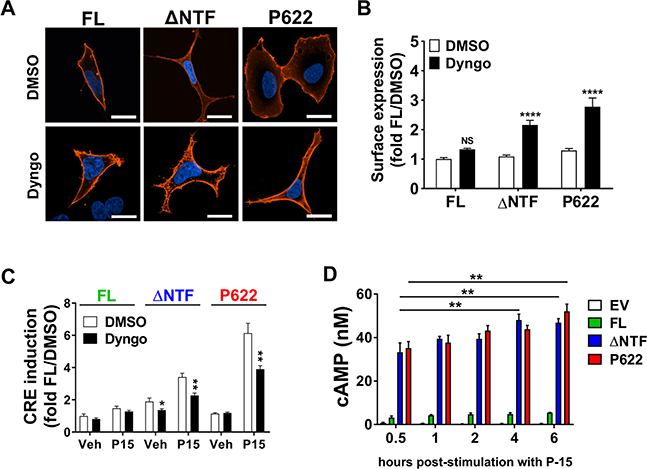
Mechanisms of activation, signaling, and trafficking of adhesion G protein-coupled receptors (aGPCRs) have remained largely unknown. Several aGPCRs, including GPR56/ADGRG1 and GPR64/ADGRG2, show increased activity in the absence of their N-terminal fragment (NTF). This constitutive signaling is plausibly caused by the binding of extracellular N-terminal 15-25 amino acid-long tethered agonist to extracellular domains of the cognate aGPCRs. To test the role of NTF and tethered agonist in GPR64 signaling and endocytosis, we generated mutants that lack either NTF alone (ΔNTF) or NTF and tethered agonist (P622). We discover that unlike full-length GPR64, ΔNTF and P622 mutants interact with β-arrestin1 and β-arrestins2 and are constitutively internalized in steady states. However, only ΔNTF shows exaggerated basal activation of the Gαs -cAMP-CRE signaling cascade. Neither ΔNTF nor P622 shows constitutive activation of the Gα13 -SRE pathway, but both mutants respond to exogenously added agonistic peptide via CRE and SRE. GPCR kinases and dynamin mediate the constitutive internalization of ΔNTF and P622 to early endosomes, where ΔNTF constantly induces CRE. These data suggest that NTF not only shields the tethered agonist to prevent G protein signaling but also confers a conformation that inhibits the interaction with β-arrestins and the consequent endocytosis and sustained signaling from endosomes.

Keywords: G protein; GPCR kinase; adhesion GPCR; endocytosis.


Conflict of interest statement

Competing interests

The authors declare no competing interests.

Figures

Figure 1.
Figure 1.
The NTF of GPR64 inhibits its basal signaling. (A) Schemes of full-length (FL) human GPR64, its NTF-truncated mutant (ΔNTF), and a mutant that lacks both the NTF and P-15 tethered agonist (P622) are shown. SS, signal sequence; 3HA, 3 repeats of N-terminal HA tags; NTF, N-terminal fragment; GPS, GPCR-proteolysis site; P-15, 15-residue tethered agonist; V5, C-terminal tag. (B) HEK cells were transiently transfected with control (EV), FL, ΔNTF, P622, or other GPR64 mutant plasmids (lacking NTF and a varied number of residues from the N-terminus), along with pCRE-Luc plasmid. Basal induction of CRE was measured after an overnight serum starvation in a luminescence-based assay. Data are shown in relative light units (RLUs) recorded in a luminometer and are presented as mean ±SEM from a representative experiment out of three individual experiments performed in quadruplicate. ∗∗P < 0.01, ∗∗∗∗P < 0.0001. Data were compared with EV with one-way ANOVA with Dunnett’s test. (C) Cells were transfected as in B but without pCRE-Luc plasmid and were starved overnight before fixation. The expression of N-terminally HA-tagged receptors on the cell surface was measured by ELISA at OD 450 nm. Specific OD recordings (OD values of each plasmid minus that of EV) are presented as mean ± SEM from four individual experiments performed in quadruplicate. Nonspecific OD value for EV was 0.26 ± 0.02. ∗P < 0.05, ∗∗P < 0.01, ∗∗∗∗P < 0.0001. Data were compared with FL with one-way ANOVA with Dunnett’s test. (D) Cells were transfected with EV, FL, ΔNTF, or P622, and after an overnight serum starvation the cell surface proteins were biotinylated as described in the Methods section. Equal amounts of protein were incubated with NeutrAvidin beads and both total and pulled-down surface receptors were detected by western blotting. Representative blots from four individual experiments are shown. (E) Cells were transfected as in C and were starved overnight before fixation and permeabilization. The expression of C-terminally V5-tagged receptors, as a surrogate for total expression, was measured by ELISA. Specific OD recordings are presented as mean ± SEM from four individual experiments performed in quadruplicate. Nonspecific OD value for EV was 0.45 ± 0.04. ∗∗P < 0.01, ∗∗∗P < 0.001, ∗∗∗∗P < 0.0001. Data were compared with FL with one-way ANOVA with Dunnett’s test. (F) Schemes of receptors that lack the N-terminal tag but are tagged C-terminally with V5 (FL-V5, ΔNTF-V5, and P622-V5) are shown. (G) HEK cells were transiently transfected with EV, FL-V5, ΔNTF-V5, or P622-V5 plasmids along with pCRE-Luc plasmid. Basal activation of CRE was measured after an overnight serum starvation. Data are shown in RLUs and are presented as mean ± SEM from a representative experiment out of three individual experiments performed in duplicate. Data were compared with EV with a two-tailed Student’s t-test. ∗∗P < 0.01. (H) Cells were transfected with EV, FL-V5, ΔNTF-V5, or P622-V5 and after an overnight serum starvation the cell surface proteins were biotinylated and detected by western blotting as in D. Representative blots from three individual experiments are shown. (I) Schemes of ΔNTF-V5 and its mutants (T607A-V5, S608A-V5, F609A-V5, G610A-V5, and V611A-V5) in which one amino acid has been substituted with alanine are shown. (J) Basal cAMP production in cells transfected with EV, ΔNTF-V5, or its alanine-substituted mutants was measured after an overnight incubation with 0.5 mM IBMX in starvation media. Concentration of cAMP in nanomolar is presented as mean ± SEM from a representative experiment out of three individual experiments performed in duplicate. ∗P < 0.05, ∗∗∗P < 0.001. Data were compared with ΔNTF-V5 with one-way ANOVA with Dunnett’s test.
Figure 2.
Figure 2.
Multiple signaling pathways are activated by endogenous tethered agonist and synthetic agonistic peptide. (A) HEK cells were transiently transfected with EV, FL, ΔNTF, or P622 plasmids and were serum starved overnight in the presence of IBMX (0.5 mM). The basal concentration of cAMP in nanomolar is presented as mean ± SEM from a representative experiment out of six individual experiments performed in quadruplicate. ∗∗∗∗P < 0.0001, NS, not significant. Data were compared with EV with a two-tailed Student’s t-test. (B) Cells were transiently transfected with EV, FL, ΔNTF, or P622 plasmids along with pSRE-Luc plasmid. Basal induction of SRE was measured after an overnight serum starvation in a luminescence-based assay. Data are shown in RLUs and are presented as mean ± SEM from a representative experiment out of four individual experiments performed in quadruplicate. NS, not significant. Data were compared with EV with a two-tailed Student’s t-test. (C) Cells were transfected with EV, FL, ΔNTF, or P622 plasmids along with pCRE-Luc plasmid and after an overnight serum starvation, cells were stimulated with increasing concentrations of synthetic agonistic peptide P-15 for 5 h at 37 °C. Luciferase assay was performed as above. Data are shown in RLUs and are presented as mean ± SEM from a representative experiment out of four individual experiments performed in triplicate. Data were compared with EV with multiple t-test with Holm–Sidak test. ∗P < 0.05 (for FL), #P < 0.0001 (for ΔNTF), and ΨP < 0.0001 (for P622). (D) Cells were transfected as in A and after an overnight serum starvation without IBMX, cells were stimulated with increasing concentrations of agonistic peptide P-15 for 1 h at 37 °C in the presence of IBMX (0.5 mM). cAMP production was measured as above. The concentration of cAMP in nanomolar is presented as mean ± SEM from a representative experiment out of five individual experiments performed in quadruplicate. Data were compared with EV with multiple t-test with Holm–Sidak test. ∗P < 0.05 (for FL), #P < 0.001 (for ΔNTF), and ΨP < 0.001 (for P622). (E) Cells were transfected as in B and after an overnight serum starvation, cells were stimulated with increasing concentrations of P-15 for 5 h at 37 °C. Luciferase assay was performed as above. Data are shown in RLUs and are presented as mean ± SEM from a representative experiment out of four individual experiments performed in triplicate. Data were compared with EV with multiple t-test with Holm–Sidak test. #P < 0.001 (for ΔNTF) and ΨP < 0.001 (for P622). (F) Cells were transiently transfected with EV or GPR64-expressing plasmids along with pNFAT-Luc reporter plasmid. After an overnight serum starvation, basal and P-15–stimulated induction of NFAT was measured. Data were normalized to that of EV (treated with DMSO; RLU value: 112.8 ± 20.4) and are presented as mean ± SEM from three individual experiments performed in triplicate. Data were compared with EV with a two-tailed Student’s t-test. ∗P < 0.05, ∗∗∗P < 0.001, ∗∗∗∗P < 0.0001. (G, H) Parental HEK293 cells (WT), Gαq/11 KO cells (ΔGNAQ/11), or Gα12/Gα13 KO cells (ΔGNA12/13) were transiently transfected with either ΔNTF (G) or P622 (H) mutant in combination with pSRE-Luc reporter plasmid. After an overnight serum starvation, basal and P-15–stimulated induction of SRE was measured as in B. Data were normalized to that of WT cells treated with DMSO (RLU value: 785.3 ± 115.8) and are presented as mean ± SEM from a representative experiment from three individual experiments performed in triplicate. Data were compared with WT with two-tailed Student’s t-test. ∗∗∗P < 0.001, ∗∗∗∗P < 0.0001.
Figure 3.
Figure 3.
Basally active and inactive mutants of GPR64 localize in early endosomes. (A) Cells were transfected with FL, ΔNTF, or P622 and were incubated with Cell-Light early endosome Rab5-GFP–expressing viruses in serum starvation media overnight. The cell surface N-terminal HA-tagged receptors were initially incubated with mouse IgG1 anti-HA antibody (1:1000) and labeled with anti-IgG1 secondary antibody conjugated to Alexa Fluor 594 fluorophore (1:500) in nonpermeabilizing condition. The V5-tagged receptors were recognized by mouse IgG2a anti-V5 antibody (1:1000) and were labelled with anti-IgG2a secondary antibody conjugated to Alexa Fluor 647 fluorophore (1:500) in permeabilizing condition and DAPI was used for nuclear staining. Magnification 400×, scale bar: 20 μm. (B) Histograms of the fluorescence intensity of two channels (representing V5 and Rab5) over the length of yellow lines (in A) are shown. (C) Fluorescence intensity was measured in Nikon NIS Elements software for 15–20 cells expressing each plasmid, as in B. Data are presented to show the colocalization of V5 and Rab5, and the Pearson correlation method was used to determine the significance of such colocalization. (D) Comparison of Pearson’s coefficients derived from C reveals significant colocalization of ΔNTF and P622 with early endosomes. Data are presented as mean ± SEM from three individual experiments and are compared with FL with a two-tailed Student’s t-test. ∗∗∗P < 0.001. (E) Histograms derived from the line scanning (blue lines in A) show similar fluorescence intensity representing surface HA tags. (F) HEK cells were seeded on coverslips and were transiently transfected with either ΔNTF or P622 plasmids. After an overnight serum starvation, the expression of C-terminally V5-tagged receptors was determined by a specific primary antibody, followed by an Alexa Fluor 594-conjugated secondary antibody (red) in permeabilizing condition. Golgi apparatus was labeled with N-acetylgalactosaminyltransferase-GFP marker (green) and DAPI was used for nuclear staining. Representative images show the colocalization of receptors with Golgi apparatus. Magnification 400×, scale bar: 20 μm. Insets (white boxes) are shown at higher magnification on the right (scale bar: 5 μm). (G) HEK cells were transfected with FL, ΔNTF, or P622 plasmids and were incubated with Cell-Light early endosome Rab5-GFP viruses overnight. Live cells were fed with mouse IgG1 anti-HA antibody (1:200) for 30 min at 10 °C. Cells were then washed and were either fixed or left untreated for 6 h in starvation media at 37 °C. HA-tagged receptors were then labeled with anti-IgG1 secondary antibody conjugated to Alexa Fluor 594 fluorophore (1:500) in permeabilizing condition and DAPI was used for nuclear staining. Magnification 400×, scale bar: 20 μm. Insets (white boxes) are shown at higher magnification either on the left side (for 0 h) or on the right side (for 6 h). Representative images form three independent experiments are shown.
Figure 4.
Figure 4.
GPR64 mutants interact with β-arrestin1 and β-arrestin2 constitutively. HEK cells were transfected with GPR64-expressing plasmids along with either FLAG-tagged β-arrestin1 (A) or β-arrestin2 (B) plasmids. Basal localization of receptors and β-arrestins was assessed by immunofluorescence staining after an overnight serum starvation. Cells were fixed and permeabilized and HA-tagged receptors and FLAG-tagged β-arrestins were recognized by rabbit anti-HA (1:1000) and mouse IgG1 anti-FLAG (1:1000) antibodies and were then labeled with secondary antibodies conjugated to Alexa Fluor 594 and Alexa Fluor 488 fluorophores (1:500), respectively, and DAPI was used for nuclear staining. Magnification 400×, scale bar: 20 μm. (C, D) Cells were transfected as above, and cell lysates were incubated with anti-FLAG antibody–bound agarose resins. The coprecipitating proteins were eluted and along with total lysate were subjected to immunoblotting with V5 antibody. Total lysate was also subjected to immunoblotting with anti-FLAG and anti-β-actin antibodies as controls. Representative blots from four independent experiments are shown. WB band intensity was analyzed by ImageJ and specific interaction of β-arrestins and receptors was determined as the ratio of V5-tagged receptors in the eluate to the FLAG-tagged β-arrestins in the total lysate. Data are presented as mean ± SEM from four individual experiments. ∗P < 0.05, ∗∗P < 0.01. Data were compared with FL with a two-tailed Student’s t-test. (E) Cells were transfected with plasmids described in Figure 1I along with FLAG-tagged β-arrestin1 and the coimmunoprecipitation assay was performed as above. Representative blots from three independent experiments are shown. (F) Cells were transfected with either ΔNTF-V5 or F609A-V5 plasmids along with FLAG-tagged β-arrestin1. β-Arrestin recruitment at basal condition and 20 min post-stimulation with 100 μM P-15 was assessed as above. Representative blots from three independent experiments are shown.
Figure 5.
Figure 5.
β-Arrestins regulate GPR64 trafficking and signaling. HEK cells were transfected with control siRNA (cont) or siRNAs specific for β-arrestin1 (β1) and β-arrestin2 (β2) alone or in combination (β2/2). Cells were then transiently transfected with FL, ΔNTF, or P622 plasmids. (A) Expression of receptors (V5 tag) was assessed by western blotting. Lysates were also subjected to immunoblotting with antibodies against endogenous β-arrestin1 and −2 and β-actin as appropriate controls. Representative blots from three independent experiments are shown. (B) Cells transfected as above were serum starved overnight, fixed, and the HA-tagged receptors on the cell surface were labeled with mouse anti-HA antibody and Alexa Fluor 594–conjugated anti-mouse antibody in nonpermeabilizing condition. DAPI was used for nuclear staining. Magnification 400×, scale bar: 20 μm. (C) Histograms of the fluorescence intensity of surface HA tags over the length of yellow lines (in B) are shown. (D) Cells were transfected as in B and the expression of N-terminally HA-tagged receptors on the cell surface was measured by ELISA at OD 450 nm. Data were normalized to that of cells transfected with control siRNA and FL plasmid (OD value: 0.56 ± 0.01) and are presented as mean ± SEM from three individual experiments performed in triplicate. ∗∗∗P < 0.001, NS, not significant. Data were compared with control siRNA with a two-tailed Student’s t-test. (E) Cells were transfected with either control siRNA or a combination of β-arrestin1 and −2 (β1/2) siRNAs followed by FL, ΔNTF, or P622 plasmids in combination with pCRE-Luc plasmid. CRE induction after 5 h incubation with either DMSO (vehicle) or 100 μM P-15 was measured. Data were normalized to the response induced by vehicle in cells transfected with FL and control siRNA (RLU value: 380.8 ± 153.2) and are presented as mean ± SEM from four individual experiments performed in quadruplicate. ∗P < 0.05, ∗∗P < 0.01. Data were compared with control siRNA with a two-tailed Student’s t-test.
Figure 6.
Figure 6.
GPCR kinases regulate GPR64 trafficking and signaling. HEK cells were transfected with control or GRK-specific siRNAs. (A) Cleared lysates were used for immunoblotting with anti-GRK-specific antibodies or anti-β-actin antibody as a loading control. Representative blots from three independent experiments are shown. (B) Cells were first transfected with siRNAs as above and then transiently transfected with ΔNTF or P622 plasmids in combination with pCRE-Luc plasmid. After an overnight serum starvation, cells were stimulated with either DMSO (vehicle) or 100 μM P-15 for 5 h and the CRE induction was measured. Data are shown in RLUs and are presented as mean ± SEM from a representative experiment out of three individual experiments performed in triplicate. ∗P < 0.05, ∗∗P < 0.01, ∗∗∗P < 0.001, ∗∗∗∗P < 0.0001. Data were compared with control siRNA with one-way ANOVA with Dunnett’s test. (C) Cells were transfected with control or GRK4-specific siRNA followed by GPR64 plasmids. After an overnight serum starvation, cells were fixed and the HA-tagged receptors on the cell surface were labeled with mouse anti-HA antibody and Alexa Fluor 594–conjugated anti-mouse antibody in nonpermeabilizing condition. DAPI was used for nuclear staining. Magnification 400×, scale bar: 20 μm. (D) Histograms of the fluorescence intensity of surface HA-tagged receptors over the length of yellow lines (in C) are shown. (E) Cells were transfected with either control, GRK4-specific, or a combination of GRK3-specific, GRK4-specific, and GRK5-specific siRNAs followed by GPR64-expressing plasmids. The expression of HA-tagged receptors at the cell surface was measured by ELISA at OD 450 nm. Data were normalized to that of cells transfected with control siRNA and FL plasmid (OD value: 0.49 ± 0.01) and are presented as mean ± SEM from three individual experiments performed in triplicate. ∗P < 0.05, ∗∗∗P < 0.001. Data were compared with control siRNA with one-way ANOVA with Dunnett’s test.
Figure 7.
Figure 7.
Dynamin controls trafficking and signaling of GPR64. (A) HEK cells were seeded on coverslips and were transiently transfected with FL, ΔNTF, or P622 plasmids. Cells were then incubated with vehicle (DMSO) or 20 μM Dyngo (dynamin inhibitor) in starvation media overnight. Surface expression of HA-tagged receptors was determined by a specific primary antibody, which was then labeled with Alexa Fluor 594 fluorophore in nonpermeabilizing condition. DAPI was used for nuclear staining. Magnification 400×, scale bar: 20 μm. (B) Cells were seeded in 96-well plates and were transfected with FL, ΔNTF, or P622 plasmids. An overnight incubation with either DMSO (vehicle) or 20 μM Dyngo was followed by an ELISA assay to measure receptor expression on the cell surface. Optical density (OD) at 450 nm was measured and the OD of all cells was normalized to that of FL-expressing cells that were kept with DMSO as vehicle control (OD value: 0.41 ± 0.02). Data are presented as mean ± SEM from three individual experiments performed in triplicate. ∗∗∗∗P < 0.0001. NS, not significant. Data were compared with DMSO with a two-tailed Student’s t-test. (C) Cells were transfected with FL, ΔNTF, or P622 plasmids in combination with pCRE-Luc plasmid. After a 1-h pretreatment with DMSO or 20 μM Dyngo, cells were stimulated with DMSO (Veh) or 100 μM P-15 for 5 hours. The CRE induction was measured in a luminescence assay. Data were normalized to response induced by vehicle in cells transfected with FL and pretreated with DMSO (RLU value: 536.8 ± 53.39) and are presented as mean ± SEM from three individual experiments performed in triplicate. ∗P < 0.05, ∗∗P < 0.01. Data were compared with DMSO pretreatment with two-tailed Student’s t-test. (D) Cells were transiently transfected with EV, FL, ΔNTF, or P622 plasmids and cells were stimulated with 100 μM P-15 for 30 min and then media was removed and fresh starvation media without P-15 but with IBMX was added. cAMP production at different time points after P-15 removal was measured. The concentration of cAMP in nanomolar is presented as mean ± SEM from a representative experiment out of three individual experiments performed in duplicate. ∗∗P < 0.01. Data were compared with a 30-min time point with a two-tailed Student’s t-test.

Similar articles

Cited by

References

    1. Hauser AS, Attwood MM, Rask-Andersen M, et al. 2017. Trends in GPCR drug discovery: new agents, targets and indications. Nat. Rev. Drug Discov 16: 829–842. - PMC - PubMed
    1. Hamann J et al. 2015. International Union of Basic and Clinical Pharmacology. XCIV. Adhesion G protein-coupled receptors. Pharmacol. Rev 67: 338–367. - PMC - PubMed
    1. Arac D et al. 2012. A novel evolutionarily conserved domain of cell-adhesion GPCRs mediates autoproteolysis. EMBO J. 31: 1364–1378. - PMC - PubMed
    1. Stephenson JR et al. 2013. Brain-specific angiogenesis inhibitor-1 signaling, regulation, and enrichment in the postsynaptic density. J. Biol. Chem 288: 22248–22256. - PMC - PubMed
    1. Paavola KJ & Hall RA. 2012. Adhesion G protein-coupled receptors: signaling, pharmacology, and mechanisms of activation. Mol. Pharmacol 82: 777–783. - PMC - PubMed

Publication types