

GIT1 regulates angiogenic factor secretion in bone marrow mesenchymal stem cells via NF-κB/Notch signalling to promote angiogenesis
- PMID: 31502302
- PMCID: PMC6869488
- DOI: 10.1111/cpr.12689
GIT1 regulates angiogenic factor secretion in bone marrow mesenchymal stem cells via NF-κB/Notch signalling to promote angiogenesis
Abstract
Objectives: Osteogenesis is coupled with angiogenesis during bone remodelling. G-protein-coupled receptor (GPCR) kinase 2-interacting protein-1 (GIT1) is an important protein that participates in fracture healing by regulating angiogenesis. This study investigated whether GIT1 could affect bone mesenchymal stem cells (BMSCs) to secrete angiogenic factors to enhance fracture healing by promoting angiogenesis and its possible mechanism.
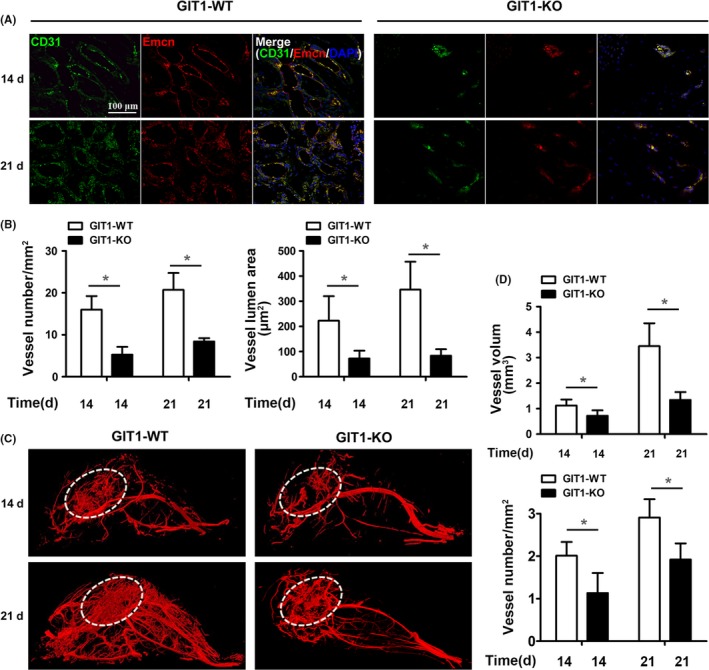
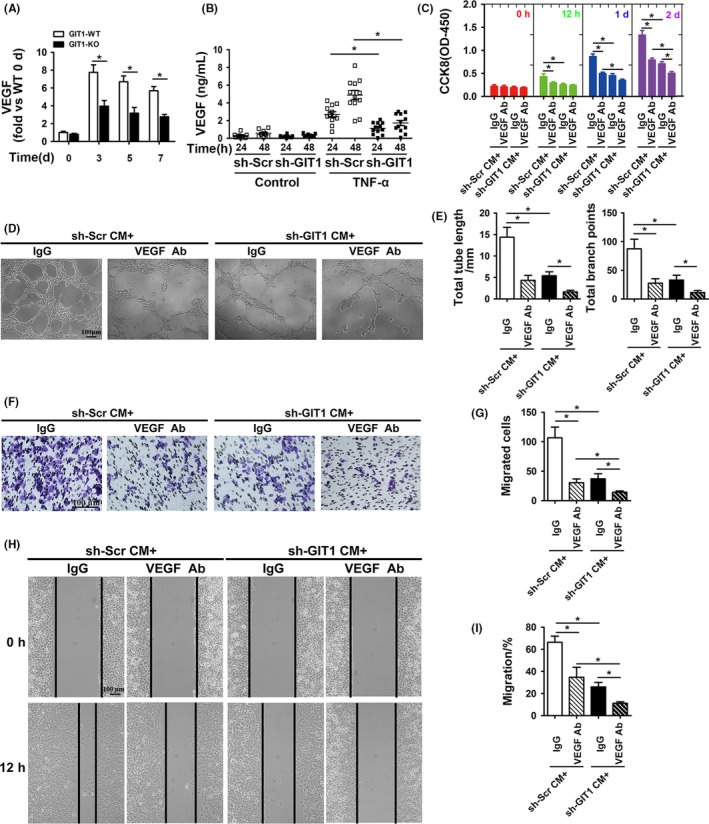
Materials and methods: The angiogenesis of mice post-fracture was detected by micro-CT and immunofluorescence. Subsequently, vascular endothelial growth factor (VEGF) level in mouse and human BMSCs (hBMSCs) under TNF-α stimulation was detected. The hBMSCs were transfected with GIT1 shRNAs to further explore the relationship between GIT1 and VEGF and angiogenesis in vitro. Furthermore, based on previous research on GIT1, possible signal pathways were investigated.
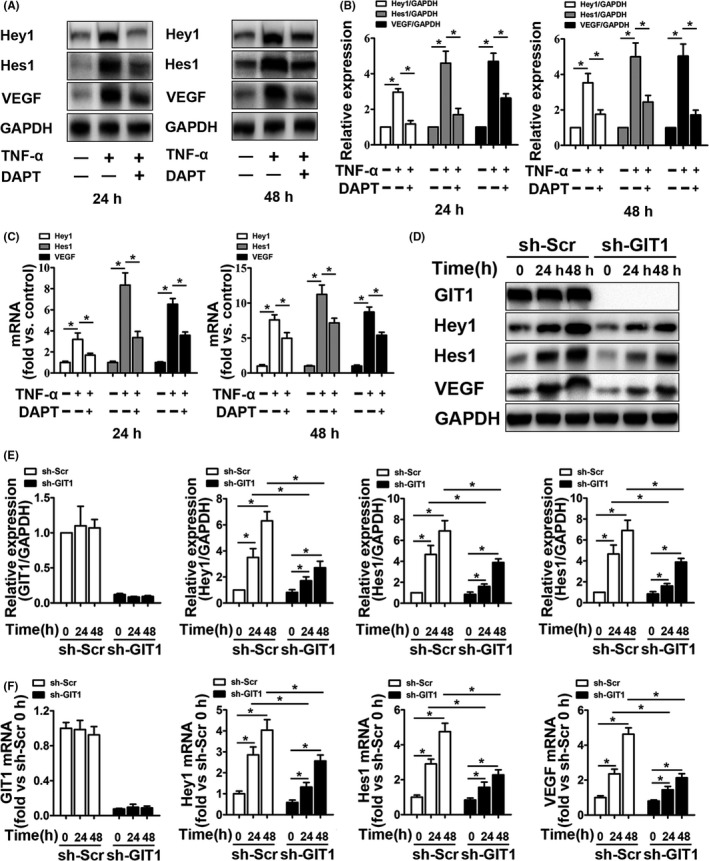
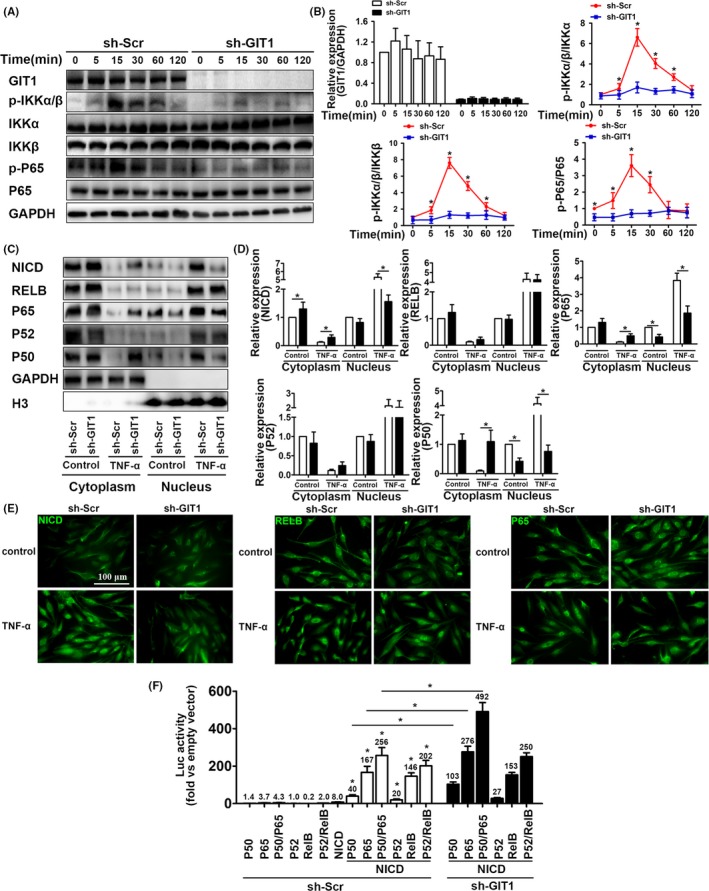
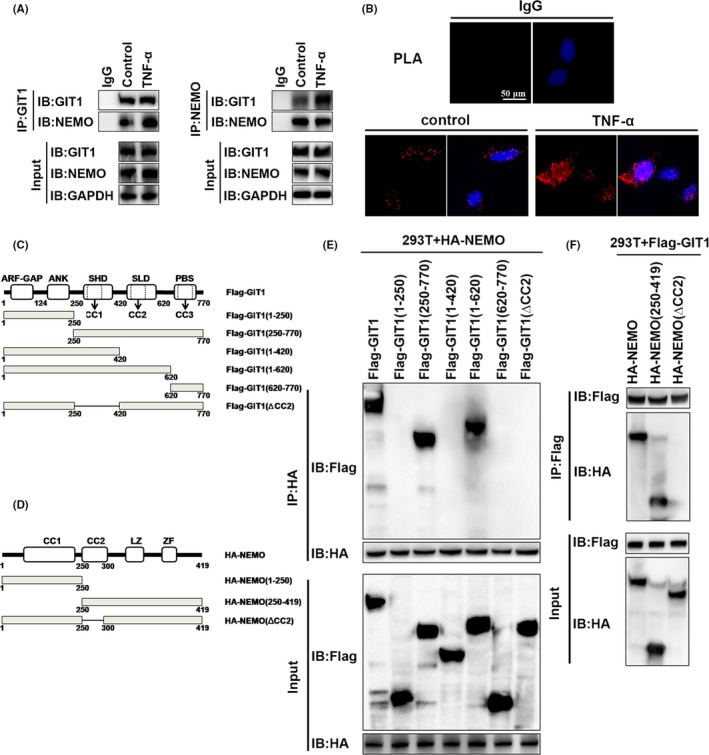
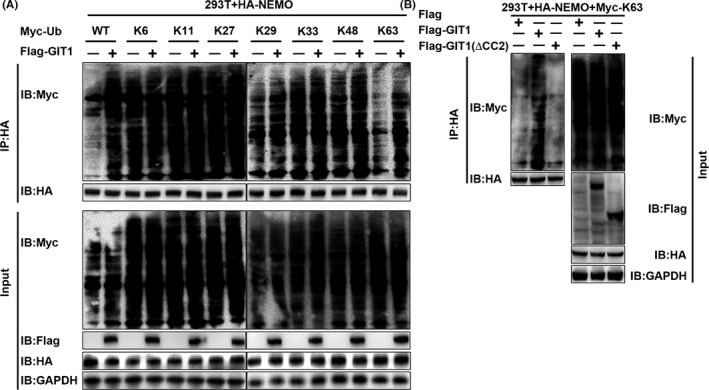
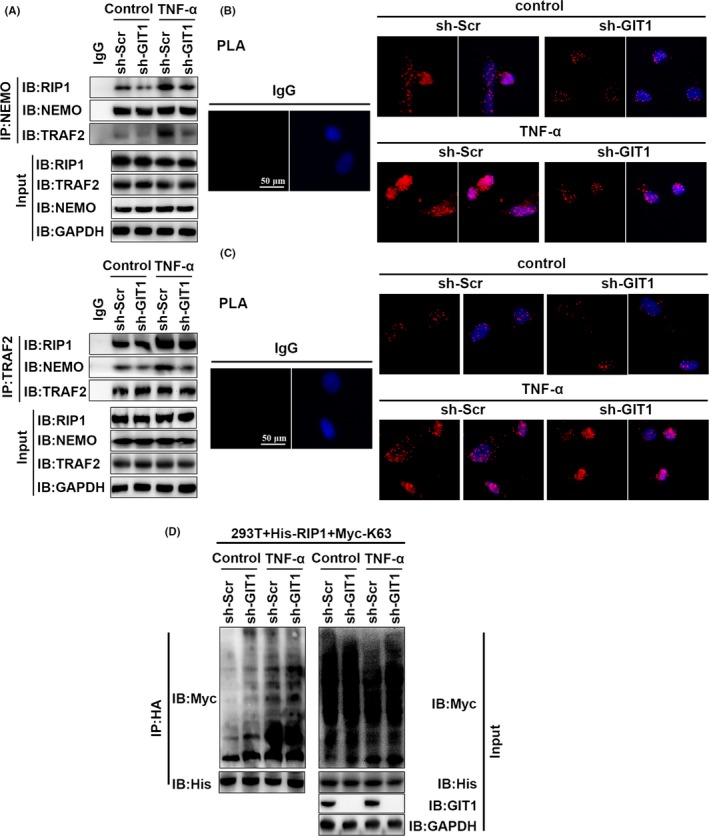
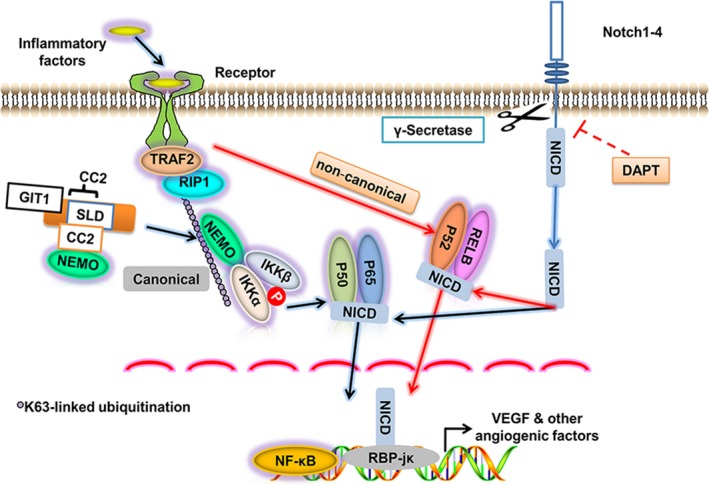
Results: GIT1 knockout mice exhibited impaired angiogenesis and delayed fracture healing. And GIT1 deficiency remarkably reduced the expression of VEGF mRNA in BMSCs, which affected the proliferation and migration of human umbilical vein endothelial cells. GIT1 knockdown inhibited the activation of Notch and NF-κB signals by decreasing nuclear transportation of NICD and P65/P50, respectively. Overexpression of the canonical NF-κB subunits P65 and P50 markedly increased NICD-dependent activation of recombination signal-binding protein-jκ reporter. Finally, GIT1 enhanced the affinity of NF-κB essential modulator (NEMO) for K63-linked ubiquitin chains via interaction with NEMO coiled-coil 2 domains.
Conclusion: These data revealed a positive role for GIT1 by modulating the Notch/NF-κB signals which promoting paracrine of BMSCs to enhance angiogenesis and fracture healing.
Keywords: GIT1; NF-κB; Notch; angiogenesis; fracture healing.
© 2019 The Authors. Cell Proliferation Published by John Wiley & Sons Ltd.
Conflict of interest statement
None of the authors have a conflict of interest to declare.
Figures
Similar articles
-
[Research on influence mechanism of G protein coupled receptor kinase interacting protein 1 on differentiation of bone marrow mesenchymal stem cells into endothelial cells].Zhongguo Xiu Fu Chong Jian Wai Ke Za Zhi. 2018 Mar 15;32(3):257-263. doi: 10.7507/1002-1892.201709090. Zhongguo Xiu Fu Chong Jian Wai Ke Za Zhi. 2018. PMID: 29806272 Free PMC article. Chinese.
-
G-protein-coupled receptor-2-interacting protein-1 is required for endothelial cell directional migration and tumor angiogenesis via cortactin-dependent lamellipodia formation.Arterioscler Thromb Vasc Biol. 2014 Feb;34(2):419-26. doi: 10.1161/ATVBAHA.113.302689. Epub 2013 Nov 21. Arterioscler Thromb Vasc Biol. 2014. PMID: 24265417 Free PMC article.
-
GIT1Y321 phosphorylation is required for ERK1/2- and PDGF-dependent VEGF secretion from osteoblasts to promote angiogenesis and bone healing.Int J Mol Med. 2012 Oct;30(4):819-25. doi: 10.3892/ijmm.2012.1058. Epub 2012 Jul 12. Int J Mol Med. 2012. PMID: 22797318
-
NF-κB: a mediator that promotes or inhibits angiogenesis in human diseases?Expert Rev Mol Med. 2023 Jul 28;25:e25. doi: 10.1017/erm.2023.20. Expert Rev Mol Med. 2023. PMID: 37503730 Review.
-
NF-κB pathway and angiogenesis: insights into colorectal cancer development and therapeutic targets.Eur J Med Res. 2024 Dec 19;29(1):610. doi: 10.1186/s40001-024-02168-w. Eur J Med Res. 2024. PMID: 39702532 Free PMC article. Review.
Cited by
-
Temporal Pattern of micro-CT Angiography Vascular Parameters and VEGF mRNA Expression in Fracture Healing: a Radiograph and Molecular Comparison.Eur J Dent. 2023 May;17(2):283-295. doi: 10.1055/s-0042-1757466. Epub 2023 Jan 30. Eur J Dent. 2023. PMID: 36716788 Free PMC article.
-
Dendronized chitosan hydrogel with GIT1 to accelerate bone defect repair through increasing local neovascular amount.Bone Rep. 2023 Aug 30;19:101712. doi: 10.1016/j.bonr.2023.101712. eCollection 2023 Dec. Bone Rep. 2023. PMID: 37744736 Free PMC article.
-
Thymosin‑β 4 induces angiogenesis in critical limb ischemia mice via regulating Notch/NF‑κB pathway.Int J Mol Med. 2020 Oct;46(4):1347-1358. doi: 10.3892/ijmm.2020.4701. Epub 2020 Aug 11. Int J Mol Med. 2020. PMID: 32945357 Free PMC article.
-
GIT1 overexpression promotes epithelial-mesenchymal transition and predicts poor prognosis in hepatocellular carcinoma.Bioengineered. 2021 Dec;12(1):30-43. doi: 10.1080/21655979.2020.1855914. Bioengineered. 2021. PMID: 33258389 Free PMC article.
-
Cell communication and relevant signaling pathways in osteogenesis-angiogenesis coupling.Bone Res. 2025 Apr 7;13(1):45. doi: 10.1038/s41413-025-00417-0. Bone Res. 2025. PMID: 40195313 Free PMC article. Review.
References
-
- Tsiridis E, Upadhyay N, Giannoudis P. Molecular aspects of fracture healing: which are the important molecules? Injury. 2007;38(Suppl 1):S11‐25. - PubMed
-
- Kon T, Cho TJ, Aizawa T, et al. Expression of osteoprotegerin, receptor activator of NF‐kappaB ligand (osteoprotegerin ligand) and related proinflammatory cytokines during fracture healing. J Bone Miner Res. 2001;16(6):1004‐1014. - PubMed
-
- Bielby R, Jones E, McGonagle D. The role of mesenchymal stem cells in maintenance and repair of bone. Injury. 2007;38(Suppl 1):S26‐32. - PubMed
MeSH terms
Substances
Grants and funding
- 81772351/National Natural Science Foundation of China
- 81520108018/National Natural Science Foundation of China
- 81472080/National Natural Science Foundation of China
- 81772352/National Natural Science Foundation of China
- 814/National Natural Science Foundation of China
- BE2017755/Jiangsu Committee of Science and Technology-Social Development Plan
- WSN-011/Jiangsu Six Talents Peak
- 201505005/Nanjing Committee of Science and Technology
- YKK17060/Medical Science and technology development Foundation from Nanjing Department of Health
- KYLX16_1105/Research Innovation Program for Academic Degree College Graduates of Jiangsu
LinkOut - more resources
Full Text Sources
Molecular Biology Databases
Research Materials
Miscellaneous
