

Effects of Rescheduling Hydrocodone on Opioid Prescribing in Ohio
- PMID: 31502638
- PMCID: PMC7553017
- DOI: 10.1093/pm/pnz210
Effects of Rescheduling Hydrocodone on Opioid Prescribing in Ohio
Abstract
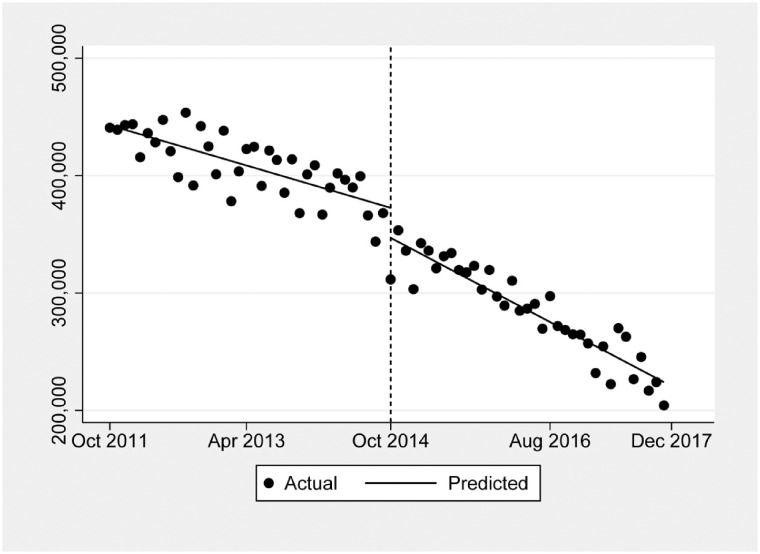
Background: We quantified opioid prescribing after the 2014 rescheduling of hydrocodone from schedule III to II in the United States using a state-wide prescription database and studied trends three years before and after the policy change, focusing on certain specialties.
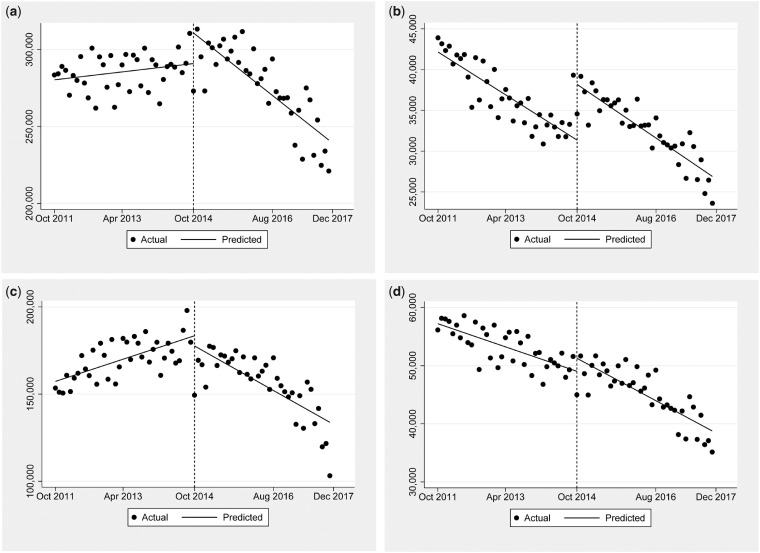
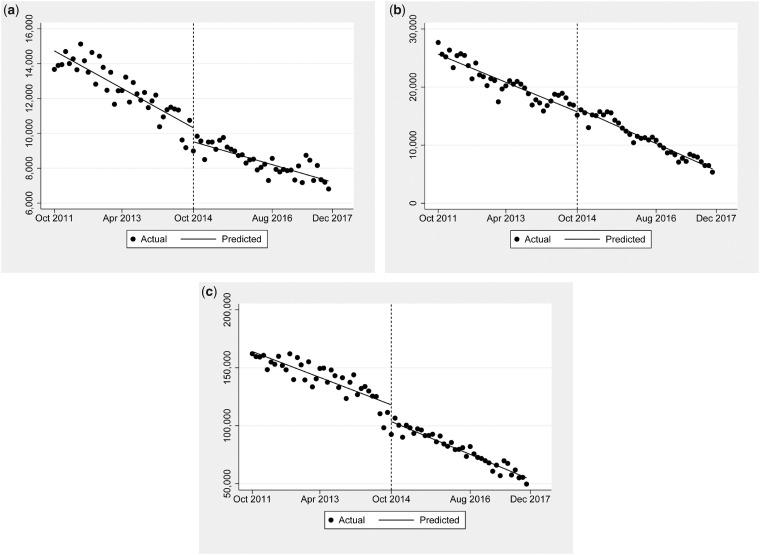
Methods: We used Ohio's state prescription drug monitoring program database, which includes all filled schedule II and III prescriptions regardless of payer or pharmacy, to conduct an interrupted time series analysis of the nine most prescribed opioids: hydrocodone, oxycodone, tramadol, codeine, and others. We analyzed hydrocodone prescribing trends for the physician specialties of internal medicine, anesthesiology, and emergency medicine. We evaluated trends 37 months before and after the rescheduling change.
Results: Rescheduling was associated with a hydrocodone level change of -26,358 (95% confidence interval [CI] = -36,700 to -16,016) prescriptions (-5.8%) and an additional decrease in prescriptions of -1,568 (95% CI = -2,296 to -839) per month (-0.8%). Codeine prescribing temporarily increased, at a level change of 6,304 (95% CI = 3,003 to 9,606) prescriptions (18.5%), indicating a substitution effect. Hydrocodone prescriptions by specialty were associated with a level change of -805 (95% CI = -1,280 to -330) prescriptions (-8.5%) for anesthesiologists and a level change of -14,619 (95% CI = -23,710 to -5,528) prescriptions (-10.2%) for internists. There was no effect on prescriptions by emergency physicians.
Conclusions: The 2014 federal rescheduling of hydrocodone was associated with declines in hydrocodone prescriptions in Ohio beyond what had already been occurring, and hydrocodone may have been briefly substituted with codeine. These results indicate that rescheduling did have a lasting effect but affected prescribing specialties variably.
Keywords: Hydrocodone; Ohio; Opioid; Opioid Prescription; Prescribing; Rescheduling.
© The Author(s) 2019. Published by Oxford University Press on behalf of the American Academy of Pain Medicine.All rights reserved. For permissions, please e-mail: journals.permissions@oup.com.
Figures
Similar articles
-
The Effect of Opioid Prescribing Guidelines on Prescriptions by Emergency Physicians in Ohio.Ann Emerg Med. 2017 Dec;70(6):799-808.e1. doi: 10.1016/j.annemergmed.2017.03.057. Epub 2017 May 23. Ann Emerg Med. 2017. PMID: 28549620
-
Impact of Hydrocodone Rescheduling on Dental Prescribing of Opioids.JDR Clin Trans Res. 2023 Oct;8(4):402-412. doi: 10.1177/23800844221102830. Epub 2022 Jun 16. JDR Clin Trans Res. 2023. PMID: 35708454
-
Association of Hydrocodone Schedule Change With Opioid Prescriptions Following Surgery.JAMA Surg. 2018 Dec 1;153(12):1111-1119. doi: 10.1001/jamasurg.2018.2651. JAMA Surg. 2018. PMID: 30140896 Free PMC article.
-
Effects of hydrocodone rescheduling on opioid use outcomes: A systematic review.J Am Pharm Assoc (2003). 2021 Mar-Apr;61(2):e20-e44. doi: 10.1016/j.japh.2020.09.013. Epub 2020 Oct 27. J Am Pharm Assoc (2003). 2021. PMID: 33127312
-
Tramadol Prescription over a 4-Year Period in the USA.Curr Pain Headache Rep. 2019 Aug 6;23(10):76. doi: 10.1007/s11916-019-0777-x. Curr Pain Headache Rep. 2019. PMID: 31388761 Review.
Cited by
-
How Reclassification of Hydrocodone Combination Products Affects Dispensing.Hosp Pharm. 2023 Aug;58(4):323-325. doi: 10.1177/00185787231155839. Epub 2023 Feb 27. Hosp Pharm. 2023. PMID: 37360213 Free PMC article. No abstract available.
-
The impact of hydrocodone rescheduling on utilization, abuse, misuse, and overdose deaths.Pharmacoepidemiol Drug Saf. 2023 Jul;32(7):735-751. doi: 10.1002/pds.5603. Epub 2023 Feb 27. Pharmacoepidemiol Drug Saf. 2023. PMID: 36779261 Free PMC article.
-
Prescribing Naloxone to High-Risk Patients in the Emergency Department: Is it Enough?Jt Comm J Qual Patient Saf. 2021 Jun;47(6):340-342. doi: 10.1016/j.jcjq.2021.03.012. Epub 2021 Apr 4. Jt Comm J Qual Patient Saf. 2021. PMID: 33958290 Free PMC article. No abstract available.
-
Combatting opioid misuse, overuse and abuse: a systematic review of pharmacists' services and outcomes.Pain Manag. 2024 Sep;14(9):519-529. doi: 10.1080/17581869.2024.2411930. Epub 2024 Oct 22. Pain Manag. 2024. PMID: 39439259
-
Identifying Clinical Risk Factors for Opioid Use Disorder using a Distributed Algorithm to Combine Real-World Data from a Large Clinical Data Research Network.AMIA Annu Symp Proc. 2021 Jan 25;2020:1220-1229. eCollection 2020. AMIA Annu Symp Proc. 2021. PMID: 33936498 Free PMC article.
References
-
- IQVIA Institute for Human Data Science. Medicine use and spending in the U.S. 2018. Available at: https://www.iqvia.com/institute/reports/medicine-use-and-spending-in-the... (accessed July 14, 2019).
-
- Drug Enforcement Administration, Department of Justice. Schedules of controlled substances: Rescheduling of hydrocodone combination products from schedule III to schedule II. Final rule. Fed Regist 2014;79(163):49661–82. - PubMed
