

Cluster analysis of time evolution (CAT) for quantitative susceptibility mapping (QSM) and quantitative blood oxygen level-dependent magnitude (qBOLD)-based oxygen extraction fraction (OEF) and cerebral metabolic rate of oxygen (CMRO2 ) mapping
- PMID: 31502723
- PMCID: PMC6879790
- DOI: 10.1002/mrm.27967
Cluster analysis of time evolution (CAT) for quantitative susceptibility mapping (QSM) and quantitative blood oxygen level-dependent magnitude (qBOLD)-based oxygen extraction fraction (OEF) and cerebral metabolic rate of oxygen (CMRO2 ) mapping
Abstract
Purpose: To improve the accuracy of QSM plus quantitative blood oxygen level-dependent magnitude (QSM + qBOLD or QQ)-based mapping of the oxygen extraction fraction (OEF) and cerebral metabolic rate of oxygen (CMRO2 ) using cluster analysis of time evolution (CAT).
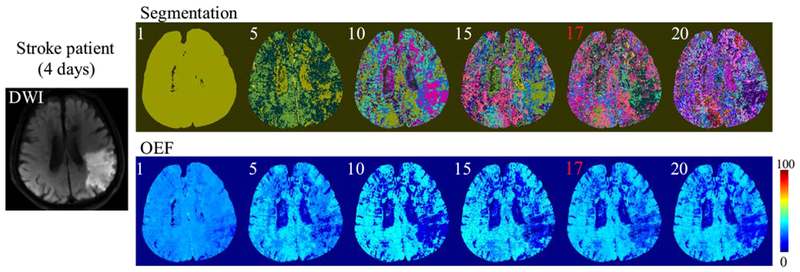
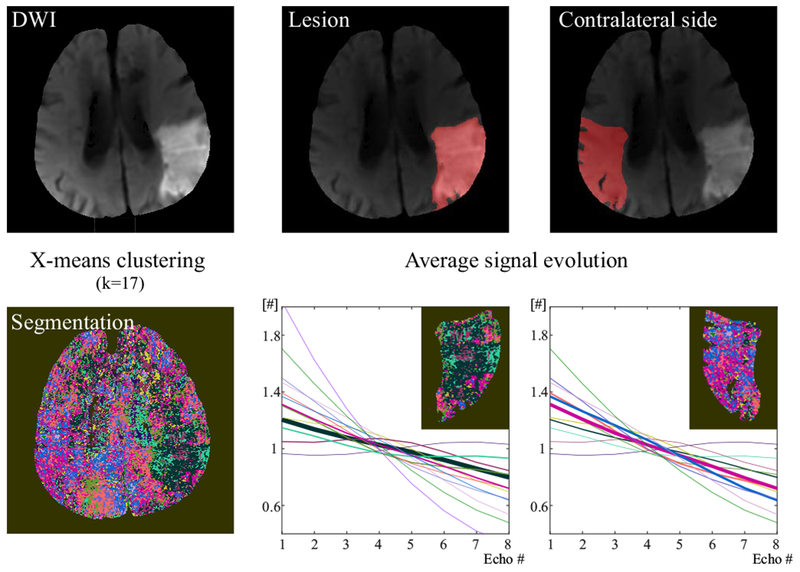
Methods: 3D multi-echo gradient echo and arterial spin labeling images were acquired in 11 healthy subjects and 5 ischemic stroke patients. DWI was also carried out on patients. CAT was developed for analyzing signal evolution over TE. QQ-based OEF and CMRO2 were reconstructed with and without CAT, and results were compared using region of interest analysis and a paired t-test.
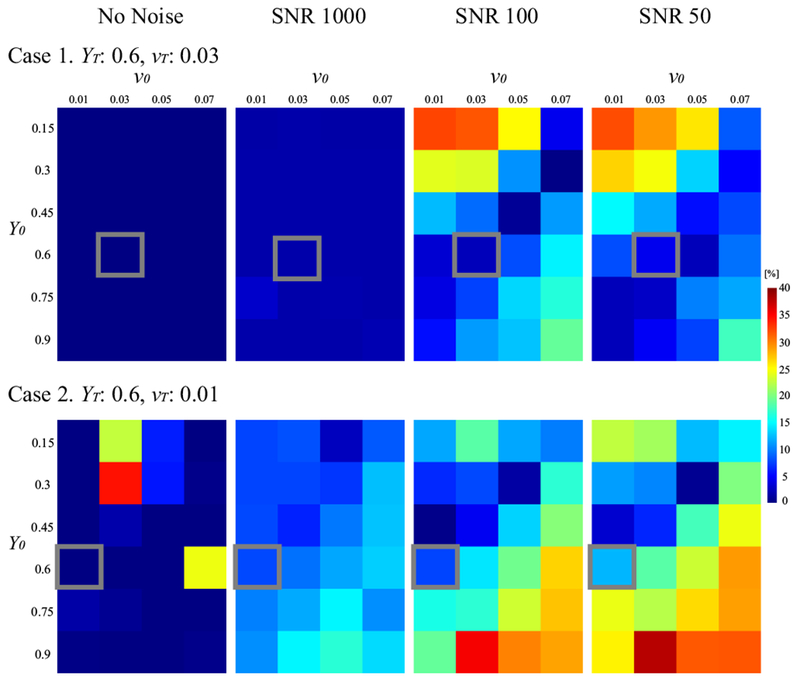
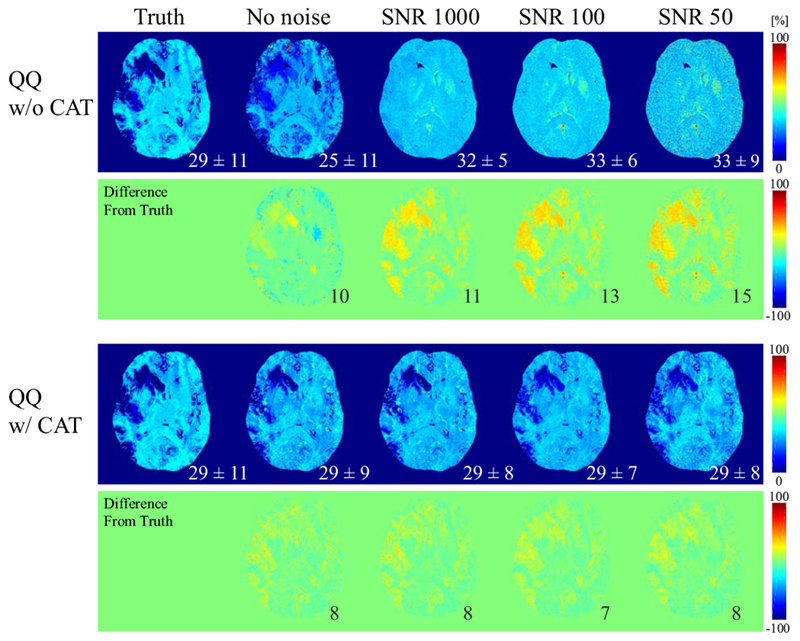
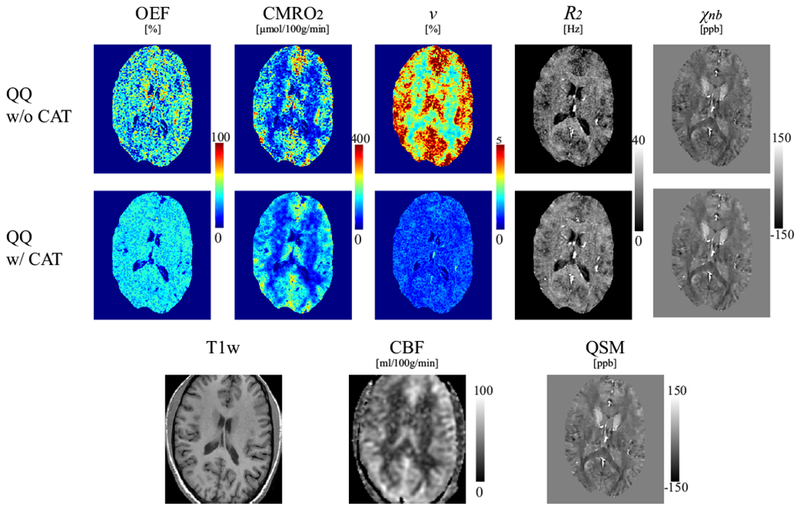
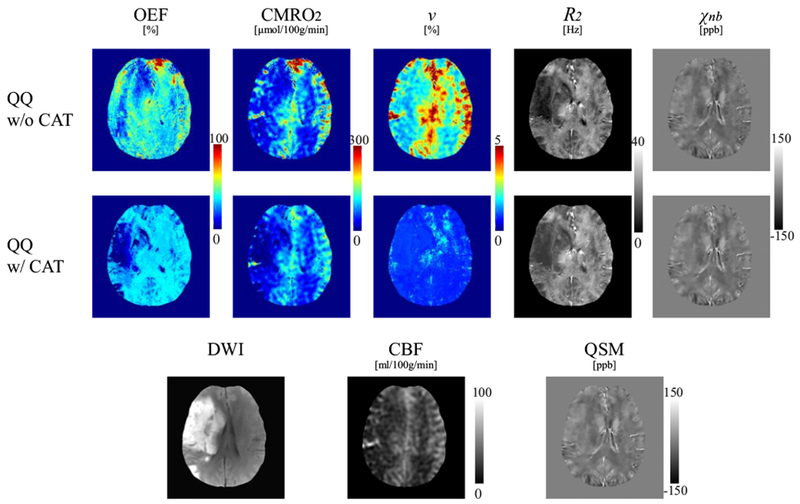
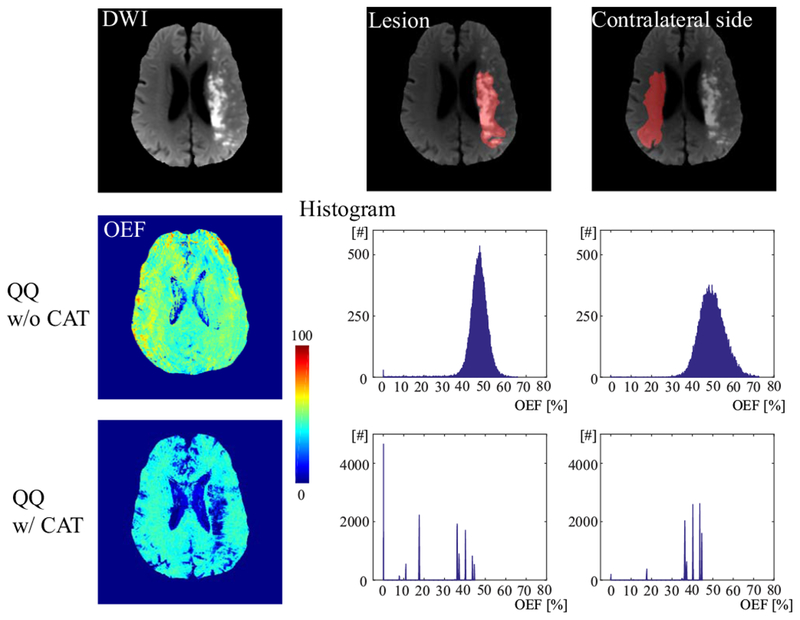
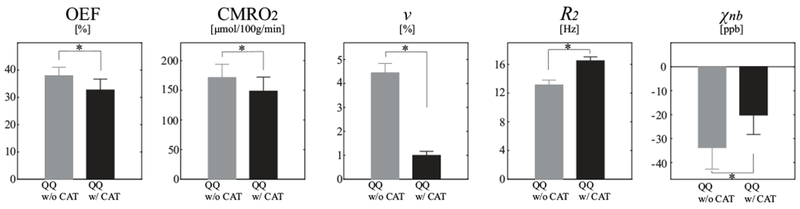
Results: Simulations demonstrated that CAT substantially reduced noise error in QQ-based OEF. In healthy subjects, QQ-based OEF appeared less noisy and more uniform with CAT than without CAT; average OEF with and without CAT in cortical gray matter was 32.7 ± 4.0% and 37.9 ± 4.5%, with corresponding CMRO2 of 148.4 ± 23.8 and 171.4 ± 22.4 μmol/100 g/min, respectively. In patients, regions of low OEF were confined within the ischemic lesions defined on DWI when using CAT, which was not observed without CAT.
Conclusion: The cluster analysis of time evolution (CAT) significantly improves the robustness of QQ-based OEF against noise.
Keywords: K-means; cerebral metabolic rate of oxygen; cluster analysis of time evolution; machine learning; oxygen extraction fraction; quantitative blood oxygenation level-dependent imaging; quantitative susceptibility mapping.
© 2019 International Society for Magnetic Resonance in Medicine.
Figures
Similar articles
-
QQ-NET - using deep learning to solve quantitative susceptibility mapping and quantitative blood oxygen level dependent magnitude (QSM+qBOLD or QQ) based oxygen extraction fraction (OEF) mapping.Magn Reson Med. 2022 Mar;87(3):1583-1594. doi: 10.1002/mrm.29057. Epub 2021 Oct 31. Magn Reson Med. 2022. PMID: 34719059 Free PMC article.
-
Temporal clustering, tissue composition, and total variation for mapping oxygen extraction fraction using QSM and quantitative BOLD.Magn Reson Med. 2021 Nov;86(5):2635-2646. doi: 10.1002/mrm.28875. Epub 2021 Jun 10. Magn Reson Med. 2021. PMID: 34110656 Free PMC article.
-
Cerebral metabolic rate of oxygen (CMRO2 ) mapping by combining quantitative susceptibility mapping (QSM) and quantitative blood oxygenation level-dependent imaging (qBOLD).Magn Reson Med. 2018 Oct;80(4):1595-1604. doi: 10.1002/mrm.27135. Epub 2018 Mar 7. Magn Reson Med. 2018. PMID: 29516537 Free PMC article.
-
Blood oxygenation level-dependent (BOLD)-based techniques for the quantification of brain hemodynamic and metabolic properties - theoretical models and experimental approaches.NMR Biomed. 2013 Aug;26(8):963-86. doi: 10.1002/nbm.2839. Epub 2012 Aug 28. NMR Biomed. 2013. PMID: 22927123 Free PMC article. Review.
-
Cerebral oxygen metabolism from MRI susceptibility.Neuroimage. 2023 Aug 1;276:120189. doi: 10.1016/j.neuroimage.2023.120189. Epub 2023 May 23. Neuroimage. 2023. PMID: 37230206 Free PMC article. Review.
Cited by
-
Sensitivity assessment of QSM+qBOLD (or QQ) in detecting elevated oxygen extraction fraction (OEF) in physiological change.J Cereb Blood Flow Metab. 2025 Apr;45(4):735-745. doi: 10.1177/0271678X241298584. Epub 2024 Nov 5. J Cereb Blood Flow Metab. 2025. PMID: 39501700 Free PMC article.
-
Cerebral oxygen extraction fraction: Comparison of dual-gas challenge calibrated BOLD with CBF and challenge-free gradient echo QSM+qBOLD.Magn Reson Med. 2021 Feb;85(2):953-961. doi: 10.1002/mrm.28447. Epub 2020 Aug 11. Magn Reson Med. 2021. PMID: 32783233 Free PMC article.
-
QQ-NET - using deep learning to solve quantitative susceptibility mapping and quantitative blood oxygen level dependent magnitude (QSM+qBOLD or QQ) based oxygen extraction fraction (OEF) mapping.Magn Reson Med. 2022 Mar;87(3):1583-1594. doi: 10.1002/mrm.29057. Epub 2021 Oct 31. Magn Reson Med. 2022. PMID: 34719059 Free PMC article.
-
Cerebral oxygen extraction fraction MRI: Techniques and applications.Magn Reson Med. 2022 Aug;88(2):575-600. doi: 10.1002/mrm.29272. Epub 2022 May 5. Magn Reson Med. 2022. PMID: 35510696 Free PMC article. Review.
-
Validation of a new 3D quantitative BOLD based cerebral oxygen extraction mapping.J Cereb Blood Flow Metab. 2024 Jul;44(7):1184-1198. doi: 10.1177/0271678X231220332. Epub 2024 Jan 30. J Cereb Blood Flow Metab. 2024. PMID: 38289876 Free PMC article.
References
-
- Derdeyn CP, Videen TO, Yundt KD, Fritsch SM, Carpenter DA, Grubb RL, Powers WJ. Variability of cerebral blood volume and oxygen extraction: stages of cerebral haemodynamic impairment revisited. Brain : a journal of neurology 2002;125(Pt 3):595–607. - PubMed
-
- Gupta A, Baradaran H, Schweitzer AD, Kamel H, Pandya A, Delgado D, Wright D, Hurtado-Rua S, Wang Y, Sanelli PC. Oxygen Extraction Fraction and Stroke Risk in Patients with Carotid Stenosis or Occlusion: A Systematic Review and Meta-Analysis. American Journal of Neuroradiology 2014;35(2):250–255. - PMC - PubMed
Publication types
MeSH terms
Substances
Grants and funding
LinkOut - more resources
Full Text Sources
Other Literature Sources
Medical
Miscellaneous
