. 2019 Nov/Dec;17(8):364-386.
doi: 10.1089/adt.2019.940. Epub 2019 Sep 6.

Assays to Interrogate the Ability of Compounds to Inhibit the AF-2 or AF-1 Transactivation Domains of the Androgen Receptor

Affiliations

Assays to Interrogate the Ability of Compounds to Inhibit the AF-2 or AF-1 Transactivation Domains of the Androgen Receptor

Ashley T Fancher et al. Assay Drug Dev Technol. 2019 Nov/Dec.

Abstract

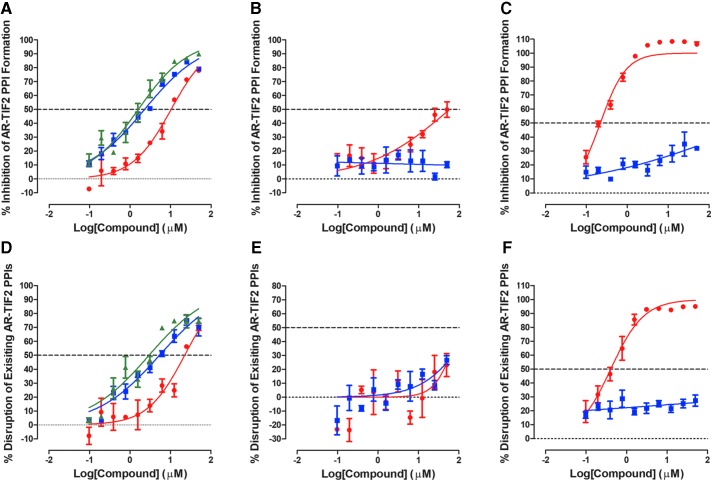
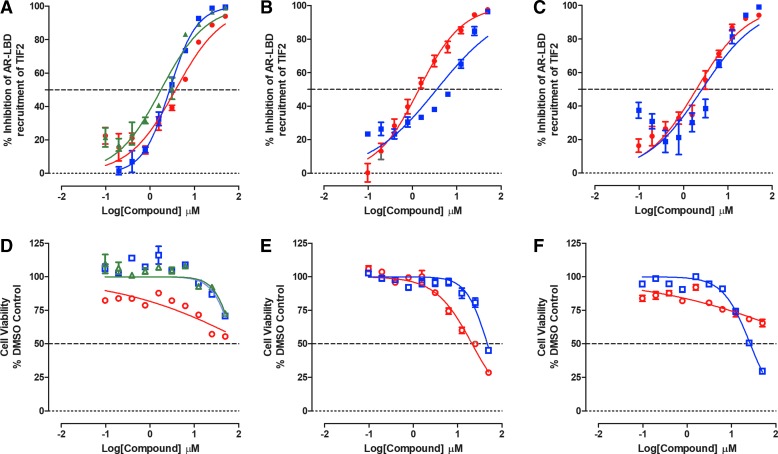
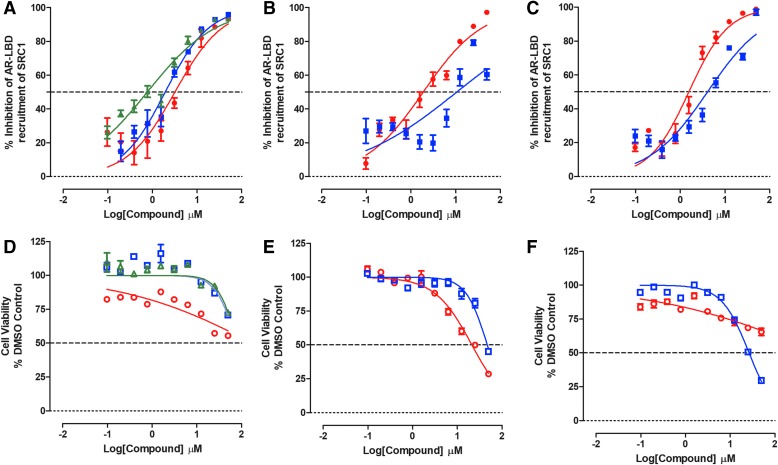
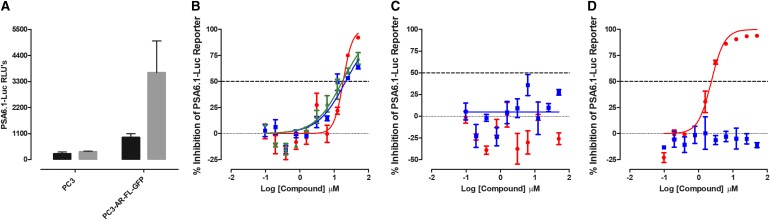
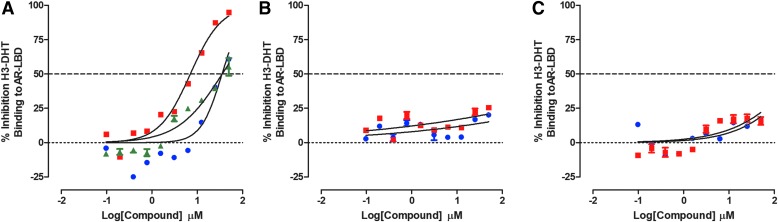
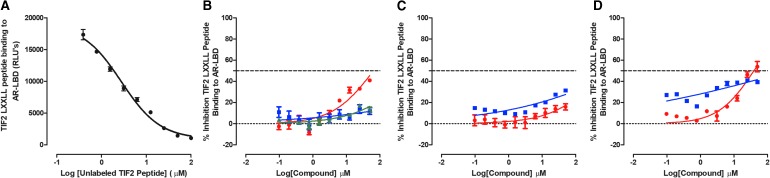
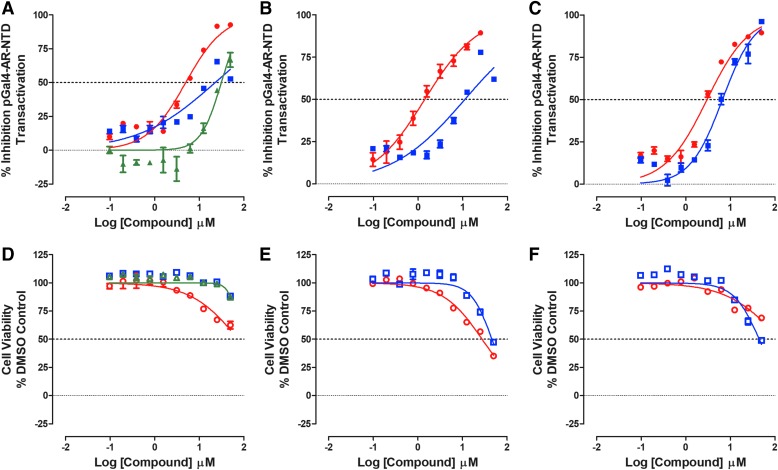
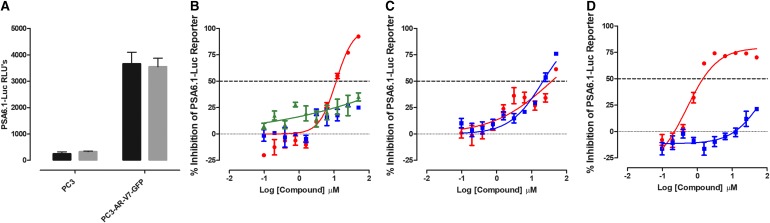
Prostate cancer is the leading cause of cancer and second leading cause of cancer-related death in men in the United States. Twenty percent of patients receiving the standard of care androgen deprivation therapy (ADT) eventually progress to metastatic and incurable castration-resistant prostate cancer (CRPC). Current FDA-approved drugs for CRPC target androgen receptor (AR) binding or androgen production, but only provide a 2- to 5-month survival benefit due to the emergence of resistance. Overexpression of AR coactivators and the emergence of AR splice variants, both promote continued transcriptional activation under androgen-depleted conditions and represent drug resistance mechanisms that contribute to CRPC progression. The AR contains two transactivation domains, activation function 2 (AF-2) and activation function 1 (AF-1), which serve as binding surfaces for coactivators involved in the transcriptional activation of AR target genes. Full-length AR contains both AF-2 and AF-1 surfaces, whereas AR splice variants only have an AF-1 surface. We have recently prosecuted a high-content screening campaign to identify hit compounds that can inhibit or disrupt the protein-protein interactions (PPIs) between AR and transcriptional intermediary factor 2 (TIF2), one of the coactivators implicated in CRPC disease progression. Since an ideal inhibitor/disruptor of AR-coactivator PPIs would target both the AF-2 and AF-1 surfaces, we describe here the development and validation of five AF-2- and three AF-1-focused assays to interrogate and prioritize hits that disrupt both transactivation surfaces. The assays were validated using a test set of seven known AR modulator compounds, including three AR antagonists and one androgen synthesis inhibitor that are FDA-approved ADTs, two investigational molecules that target the N-terminal domain of AR, and an inhibitor of the Hsp90 (heat shock protein) molecular chaperone.

Keywords: androgen receptor activation function domains; castration-resistant prostate cancer; mammalian 2-hybrid assays.


Conflict of interest statement

The authors declare no conflicts of interest.

Figures

Fig. 1.
Fig. 1.
Inhibition of DHT-induced AR-TIF2 PPI formation (A–C) or disruption of preformed AR-TIF2 PPI complexes (D–F). U-2 OS cells were coinfected with AR-RFP and TIF2-GFP rAV biosensors, and 3,000 cells were seeded into the wells of 384-well assay plates and cultured overnight at 37°C, 5% CO2, and 95% humidity. After 24 h, test compounds and DHT were added to cells in two formats. To determine if test compounds could inhibit DHT-induced AR-TIF2 PPI formation (A-C), coinfected U-2 OS cells were exposed to compounds at the indicated concentrations for 3 h before treatment with 25 nM DHT for 90 min; (A) (red-filled circle) flutamide, (blue-filled square) bicalutamide, and (green-filled triangle) enzalutamide, (B) (red-filled circle) compound No. 10, (blue-filled square) EPI-001, (C) (red-filled circle) 17-AAG, and (blue-filled square) abiraterone acetate, To determine if test compounds could disrupt preformed AR-TIF2 PPI complexes (D–F), coinfected U-2 OS cells were exposed to 25 nM of DHT for 90 min before treatment with the indicated concentrations of compounds for 3 h; (D) (red-filled circle) flutamide, (blue-filled square) bicalutamide, and (green-filled triangle) enzalutamide, (E) (red-filled circle) compound No. 10, (blue-filled square) EPI-001, (F) (red-filled circle) 17-AAG, and (blue-filled square) abiraterone acetate. The AR-TIF2 PPI data were normalized to maximum (25 nM DHT +0.5% DMSO, n = 32) and minimum (0.5% DMSO, n = 32) plate controls, and the percent inhibition was plotted as the mean ± SD (n = 3) values from triplicate wells for each compound concentration. Representative experimental data from one of two independent experiments are shown. 17-AAG, 17-allylaminogeldanamycin; AR, androgen receptor; DHT, dihydrotestosterone; DMSO, dimethyl sulfoxide; GFP, green fluorescent protein; PPI, protein–protein interaction; rAV, recombinant adenovirus; RFP, red fluorescent protein; SD, standard deviation; TIF2, transcriptional intermediary factor 2; U-2 OS, U-2 osteosarcoma cell line.
Fig. 2.
Fig. 2.
Inhibition of DHT-induced M2H Interactions between AR-LBD and TIF2. HEK 293 cells that were cotransfected with three plasmid constructs, pGAL4-AR-LBD, 5xGal4-TATA-Luc, and pVP16-TIF2, were seeded at 5,000 cells per well in 384-well assay plates, and cultured overnight at 37°C, 5% CO2, and 95% humidity. After 24 h, cells were exposed to test compounds at the indicated concentrations for 3 h before the addition of 25 nM DHT. After an additional 24-h incubation, BrightGlo® reagent was added to the assay plates and the RLUs were captured on a SpectraMax M5e microtiter plate reader. The M2H RLU's data were normalized to maximum (25 nM DHT +0.5% DMSO, n = 32) and minimum (0.5% DMSO, n = 32) plate controls, and the percent inhibition was plotted as the mean ± SD (n = 3) values from triplicate wells for each compound concentration. The normalized percent inhibition of the DHT-induced AR-LBD TIF2 M2H responses for (A) (red-filled circle) flutamide, (blue-filled square) bicalutamide, and (green-filled triangle) enzalutamide, (B) (red-filled circle) compound No. 10, (blue-filled square) EPI-001, (C) (red-filled circle) 17-AAG, and (blue-filled square) abiraterone acetate are presented. The corresponding cell viability data for compound-treated wells were normalized to 0.5% DMSO control wells (n = 32), and the percent cell viability plotted as the mean ± SD (n = 3) values from triplicate wells for each compound concentration is presented in (D) (red open circle) flutamide, (blue open square) bicalutamide, and (green open triangle) enzalutamide, (E) (red open circle) compound No. 10, (blue open square) EPI-001, (F) (red open circle) 17-AAG, and (blue open square) abiraterone acetate. Representative experimental data from one of two independent experiments are shown. LBD, ligand-binding domain; Luc, luciferase; M2H, mammalian 2-hybrid; pGal4, DNA-binding domain of the Gal4 protein derived from yeast; RLUs, relative light units.
Fig. 3.
Fig. 3.
Inhibition of DHT-induced M2H Interactions between AR-LBD and SRC1. HEK 293 cells that were cotransfected with three plasmid constructs, pGAL4-AR-LBD plus 5xGal4-TATA-Luc with pVP16-SRC1, were seeded at 5,000 cells per well in 384-well assay plates, and cultured overnight at 37°C, 5% CO2, and 95% humidity. After 24 h, cells were exposed to test compounds at the indicated concentrations for 3 h before the addition of 25 nM DHT. After an additional 24-h incubation, BrightGlo reagent was added to the assay plates and the RLUs were captured on a SpectraMax M5e microtiter plate reader. The M2H RLU's data were normalized to maximum (25 nM DHT +0.5% DMSO, n = 32) and minimum (0.5% DMSO, n = 32) plate controls, and the percent inhibition was plotted as the mean ± SD (n = 3) values from triplicate wells for each compound concentration. The normalized percent inhibition of the DHT-induced AR-LBD SRC1 M2H responses for (A) (red-filled circle) flutamide, (blue-filled square) bicalutamide, and (green-filled triangle) enzalutamide, (B) (red-filled circle) compound No. 10, (blue-filled square) EPI-001, (C) (red-filled circle) 17-AAG, and (blue-filled square) abiraterone acetate is presented. The corresponding cell viability data for compound-treated wells were normalized to 0.5% DMSO control wells (n = 32), and the percent cell viability plotted as the mean ± SD (n = 3) values from triplicate wells for each compound concentration is presented in (D) (red open circle) flutamide, (blue open square) bicalutamide, and (green open triangle) enzalutamide, (E) (red open circle) compound No. 10, (blue open square) EPI-001, (F) (red open circle) 17-AAG, and (blue open square) abiraterone acetate. Representative experimental data from one of two independent experiments are shown. SRC, steroid receptor coactivator.
Fig. 4.
Fig. 4.
Inhibition of DHT-induced PSA6.1-luciferase reporter assay in PC3-AR-FL-GFP cells. PC3-AR-FL-GFP cell lines were transiently bulk transfected with a 3:1 ratio of FuGENE™ HD: PSA-6.1-Luc plasmid DNA (20 ng/well) and then seeded into 384-well assay plates at a density of 3,000 cell per well, and incubated overnight at 5% CO2, 95% humidity, and 37°C. Transfected cells were pre-exposed to the indicated concentrations of compounds for 3 h before the addition of 25 nM DHT and the assay plate was returned to the incubator for an additional 24 h before BrightGlo reagent was added to the plate and the RLUs were captured on a SpectraMax M5e microtiter plate reader. The RLU data were normalized to maximum (25 nM DHT +0.5% DMSO, n = 32) and minimum (0.5% DMSO, n = 32) plate controls, and the percent inhibition was plotted as the mean ± SD (n = 3) values from triplicate wells for each compound concentration. (A) The mean plate control RLU's ± SD (n = 32) for parental PC3 cells and PC3-AR-FL-GFP cells transiently transfected with the PSA6.1-Luc reporter exposed to DMSO (black bars) or DMSO+DHT (gray bars) is presented. The normalized percent inhibition of the DHT-induced PSA6.1-Luc reporter activity for (B) (red-filled circle) flutamide, (blue-filled square) bicalutamide, and (green-filled triangle) enzalutamide, (C) (red-filled circle) compound No. 10, (blue-filled square) EPI-001, (D) (red-filled circle) 17-AAG, and (blue-filled square) abiraterone acetate is presented. Representative experimental data from one of two independent experiments are shown. FL, full length; PSA, prostate-specific antigen.
Fig. 5.
Fig. 5.
Inhibition of AR-LBD H3-DHT Binding. Competitive displacement binding of H3-DHT to His6-AR-LBD. Five micrograms of His6-AR-LBD protein was added to the wells of 96-well copper-coated plates and allowed to bind overnight at 4°C. Unbound protein was removed by aspiration; the plate was washed three times with PBS-Tween 20 buffer and blocked for 1 h with 1 mg/mL BSA in PBS-Tween 20. After three washes with PBS-Tween 20 buffer, 10 nM H3-DHT was added to the wells of the plate in the presence or absence of the indicated concentrations of test compounds and incubated at RT for 1 h. Unbound H3-DHT was removed by aspiration and washing, and micro-scintillation reagent was added to the wells, and the CPMs were captured on a TopCount NXT microtiter β-counter. CPM data were normalized to maximum (0.5% DMSO, n = 8) and minimum (10 μM cold DHT, n = 8) plate controls, and the percent inhibition was plotted as the mean ± SD (n = 2) values from duplicate wells for each compound concentration. The normalized percent inhibition of the H3-DHT bound to His6-AR-LBD for (A) (blue-filled circle) flutamide, (red-filled square) bicalutamide, and (green-filled triangle) enzalutamide, (B) (blue-filled circle) compound No. 10, (red-filled square) EPI-001, (C) (blue-filled circle) 17-AAG, and (red-filled square) abiraterone acetate is presented. Representative experimental data from one of two independent experiments are shown. BSA, bovine serum albumin; CPMs, counts per minute; PBS, phosphate-buffered saline; RT, room temperature.
Fig. 6.
Fig. 6.
Inhibition of AR-LBD TIF2 Box III LXXLL peptide binding. Biotinylated TIF2 peptide was incubated with streptavidin donor beads for 30 min in the dark at RT, and then added to 384-well assay plates at a final concentration of 150 nM. Compounds at the indicated concentrations were then added to the wells of the plate, which was incubated for 30 min in the dark at RT. Simultaneously, pET28a-His6-AR-LBD (400 ng/well) was incubated with DHT and Ni2+-coated acceptor beads for 30 min and then this mixture was added to the wells of the 384-well plates. After mixing the ALPHAScreen components, the assay plates were incubated for 1 h at RT in the dark and the CPMs were captured on an Envision plate reader at 520 nm after excitation at 680 nm. (A) Competitive displacement binding of biotinylated-TIF2-box-III LXXLL peptide to His6-AR-LBD by unlabeled TIF2-box-III LXXLL peptide. The CPM data were normalized to maximum (0.5% DMSO, n = 32) and minimum (0.5% DMSO and 75 μM unlabeled TIF2, n = 32) plate controls, and the percent inhibition was plotted as the mean ± SD (n = 3) values from triplicate wells for each compound concentration. The normalized percent inhibition of the AR-LBD::LXXLL-peptide binding for (B) (red-filled circle) flutamide, (blue-filled square) bicalutamide, and (green-filled triangle) enzalutamide, (C) (red-filled circle) compound No. 10, (blue-filled square) EPI-001, (D) (red-filled circle) 17-AAG, and (blue-filled square) abiraterone acetate is presented. Representative experimental data from one of two independent experiments are shown. LXXLL, coactivator leucine-rich binding motifs.
Fig. 7.
Fig. 7.
Inhibition of Constitutive pGal4-AR-NTD Transactivation. HEK 293 cells were cotransfected with two plasmid constructs, pGAL4-AR-NTD (1–503) and the 5xGal4-TATA-Luc reporter, and 5,000 cells were seeded into the wells of 384-well assay plates, and cultured overnight at 37°C, 5% CO2, and 95% humidity. After 24 h, cells were exposed to test compounds at the indicated concentrations and assay plates were returned to the incubator. After an additional 24 h, BrightGlo reagent was added to the plate and the RLUs were captured on a SpectraMax M5e microtiter plate reader. The RLU's data were normalized relative to the maximum (0.5% DMSO, n = 64) plate controls, and the percent inhibition was plotted as the mean ± SD (n = 3) values from triplicate wells for each compound concentration. The normalized percent inhibition for treatment with (A) (red-filled circle) flutamide, (blue-filled square) bicalutamide, and (green-filled triangle) enzalutamide, (B) (red-filled circle) compound No. 10, (blue-filled square) EPI-001, (C) (red-filled circle) 17-AAG, and (blue-filled square) abiraterone acetate is presented. The corresponding cell viability data for compound-treated wells were normalized to 0.5% DMSO control wells (n = 64), and the percent cell viability plotted as the mean ± SD (n = 3) values from triplicate wells at each compound concentration for (D) (red open circle) flutamide, (blue open square) bicalutamide, and (green open triangle) enzalutamide, (E) (red open circle) compound No. 10, (blue open square) EPI-001, (F) (red open circle) 17-AAG, and (blue open square) abiraterone acetate is presented. Representative experimental data from one of two independent experiments are shown. AR-NTD, N-terminal domain of AR.
Fig. 8.
Fig. 8.
Inhibition of PSA6.1-Luc Reporter Activity in PC3-AR-V7-GFP Cells. The PC3-AR-V7-GFP cell line was transiently bulk transfected with a 3:1 ratio of FuGENE HD: PSA-6.1-Luc plasmid DNA (20 ng/well), then seeded at 3,000 cells per well in 384-well assay plates, and incubated overnight at 5% CO2, 95% humidity, and 37°C. Transfected cells were then exposed to the indicated concentrations of compounds and the assay plates were returned to the incubator for an additional 24 h before BrightGlo reagent was added to the plate and the RLUs were captured on a SpectraMax M5e microtiter plate reader. (A) The RLUs from PC3 and PC3-AR-V7-GFPs transfected with the PSA6.1-Luc reporter plasmid and then exposed to DMSO (black bars) or DMSO+DHT (gray bars) are presented. The PSA6.1-Luc RLU data for compound-treated wells were normalized relative to maximum plate controls (0.5% DMSO, n = 64), and the percent inhibition was plotted as the mean ± SD (n = 3) values from triplicate wells at each compound concentration. The normalized percent inhibition of the AR-V7-induced PSA6.1-Luc reporter activity for (B) (red-filled circle) flutamide, (blue-filled square) bicalutamide, and (green-filled triangle) enzalutamide, (C) (red-filled circle) compound No. 10, (blue-filled square) EPI-001, (D) (red-filled circle) 17-AAG, and (blue-filled square) abiraterone acetate is presented. Representative experimental data from one of two independent experiments are shown. AR-V7, androgen receptor splice variant 7.
Fig. 9.
Fig. 9.
Inhibition of UBE2C-Luc Reporter Activity in PC3-AR-V7-GFP Cells. The PC3-AR-V7-GFP cell line was transiently bulk transfected with a 3:1 ratio of FuGENE HD: UBE2C-Luc plasmid DNA (10 ng/well) and then seeded at 3,000 cell per well into 384-well assay plates and incubated overnight at 5% CO2, 95% humidity, and 37°C. Transfected cells were then exposed to the indicated concentrations of compounds before the assay plate was returned to the incubator for an additional 24 h before BrightGlo reagent was added to the plate and the RLUs were captured on a SpectraMax M5e microtiter plate reader. (A) The RLUs from PC3 and PC3-AR-V7-GFPs transfected with the UBE2C-Luc reporter plasmid and then exposed to DMSO (black bars) or DMSO+DHT (gray bars) are presented. The UBE2C-Luc RLU data for compound-treated wells were normalized relative to maximum plate controls (0.5% DMSO, n = 64), and the percent inhibition was plotted as the mean ± SD (n = 3) values from triplicate wells at each compound concentration. The normalized percent inhibition of the DHT-induced UBE2C-Luc reporter activity for (B) (red-filled circle) flutamide, (blue-filled square) bicalutamide, and (green-filled triangle) enzalutamide, (C) (red-filled circle) compound No. 10, (blue-filled square) EPI-001, (D) (red-filled circle) 17-AAG, and (blue-filled square) abiraterone acetate is presented. Representative experimental data from one of two independent experiments are shown. UBE2C, ubiquitin-conjugating enzyme E2C.

Similar articles

Cited by

References

    1. Siegel RL, Miller KD, Jemal A: Cancer statistics, 2018. CA Cancer J Clin 2018;68:7–30 - PubMed
    1. Kirby M, Hirst C, Crawford ED: Characterising the castration-resistant prostate cancer population: a systematic review. Int J Clin Pract 2011;65:1180–1192 - PubMed
    1. Keyes M, Crook J, Morton G, Vigneault E, Usmani N, Morris WJ: Treatment options for localized prostate cancer. Can Fam Physician 2013;59:1269–1274 - PMC - PubMed
    1. Gudziak MR, Smith AY: Hormonal therapy for stage D cancer of the prostate. West J Med 1994;160:351–359 - PMC - PubMed
    1. Harris WP, Mostaghel EA, Nelson PS, Montgomery B: Androgen deprivation therapy: progress in understanding mechanisms of resistance and optimizing androgen depletion. Nat Clin Pract Urol 2009;6:76–85 - PMC - PubMed

Publication types

MeSH terms

Substances