

The global distribution and evolutionary history of the pT26-2 archaeal plasmid family
- PMID: 31503394
- PMCID: PMC6972569
- DOI: 10.1111/1462-2920.14800
The global distribution and evolutionary history of the pT26-2 archaeal plasmid family
Abstract
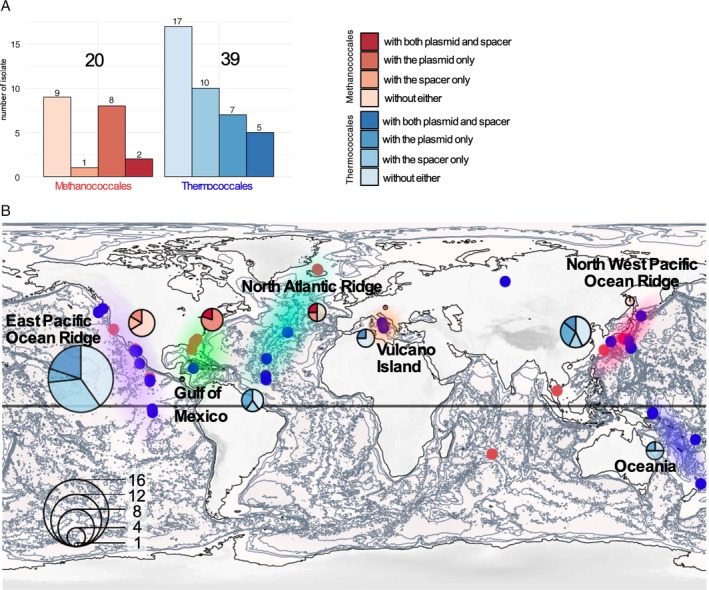
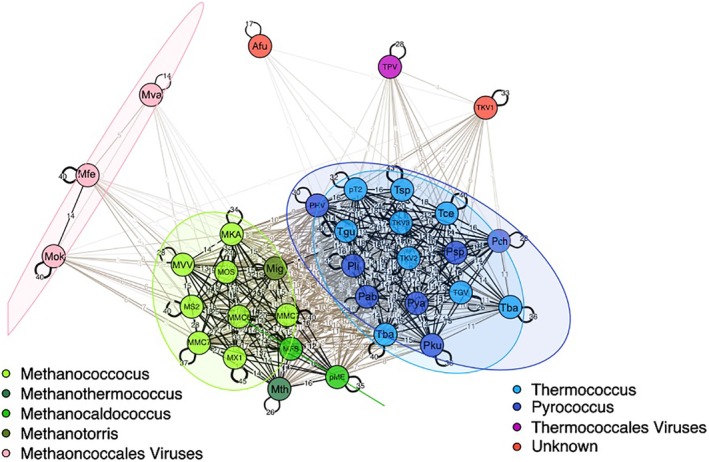
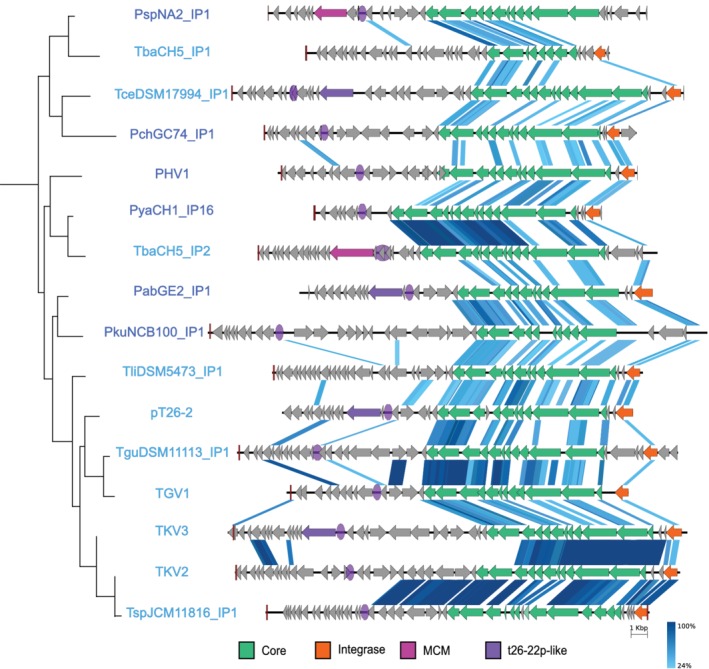
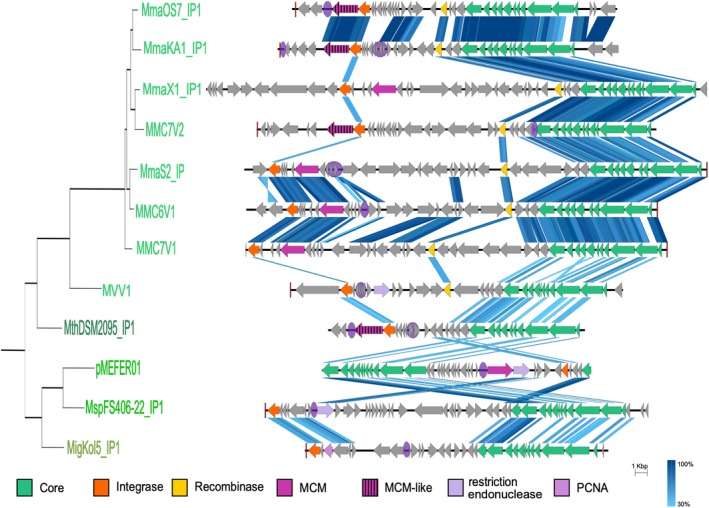
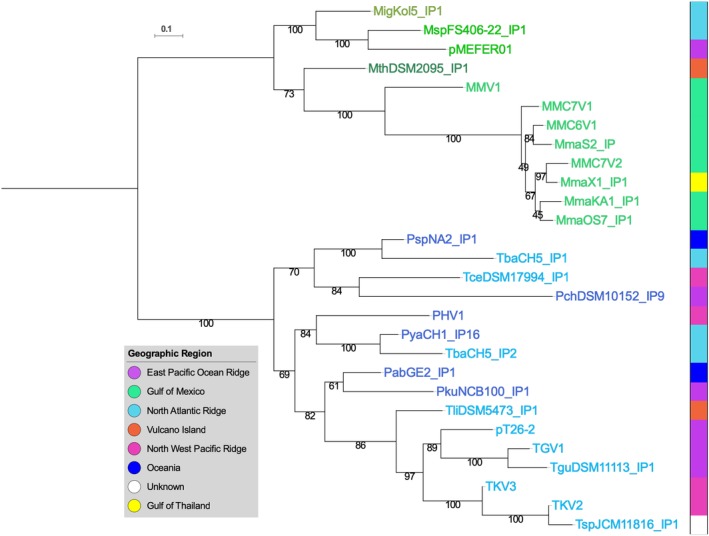
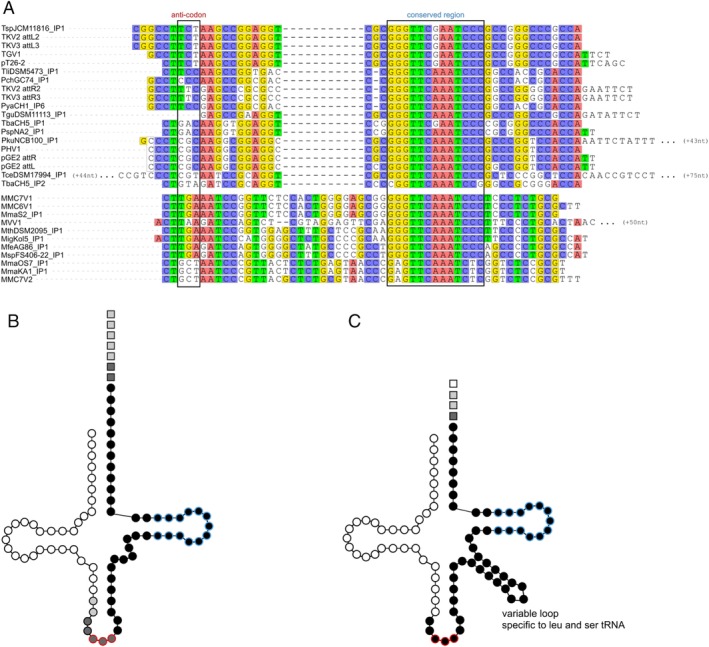
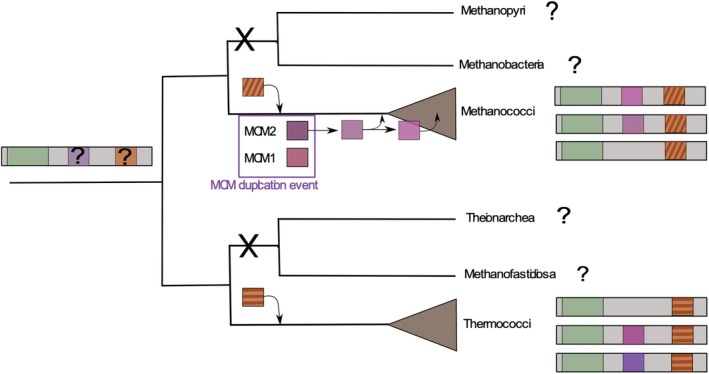
Although plasmids play an important role in biological evolution, the number of plasmid families well-characterized in terms of geographical distribution and evolution remains limited, especially in archaea. Here, we describe the first systematic study of an archaeal plasmid family, the pT26-2 plasmid family. The in-depth analysis of the distribution, biogeography and host-plasmid co-evolution patterns of 26 integrated and 3 extrachromosomal plasmids of this plasmid family shows that they are widespread in Thermococcales and Methanococcales isolated from around the globe but are restricted to these two orders. All members of the family share seven core genes but employ different integration and replication strategies. Phylogenetic analysis of the core genes and CRISPR spacer distribution suggests that plasmids of the pT26-2 family evolved with their hosts independently in Thermococcales and Methanococcales, despite these hosts exhibiting similar geographic distribution. Remarkably, core genes are conserved even in integrated plasmids that have lost replication genes and/or replication origins suggesting that they may be beneficial for their hosts. We hypothesize that the core proteins encode for a novel type of DNA/protein transfer mechanism, explaining the widespread oceanic distribution of the pT26-2 plasmid family.
© 2019 The Authors. Environmental Microbiology published by Society for Applied Microbiology and John Wiley & Sons Ltd.
Figures
Similar articles
-
Two novel families of plasmids from hyperthermophilic archaea encoding new families of replication proteins.Nucleic Acids Res. 2010 Aug;38(15):5088-104. doi: 10.1093/nar/gkq236. Epub 2010 Apr 18. Nucleic Acids Res. 2010. PMID: 20403814 Free PMC article.
-
Plasmids, viruses and virus-like membrane vesicles from Thermococcales.Biochem Soc Trans. 2011 Jan;39(1):36-44. doi: 10.1042/BST0390036. Biochem Soc Trans. 2011. PMID: 21265744 Review.
-
Insights into dynamics of mobile genetic elements in hyperthermophilic environments from five new Thermococcus plasmids.PLoS One. 2013;8(1):e49044. doi: 10.1371/journal.pone.0049044. Epub 2013 Jan 11. PLoS One. 2013. PMID: 23326305 Free PMC article.
-
The evolutionary history of archaeal MCM helicases: a case study of vertical evolution combined with hitchhiking of mobile genetic elements.Mol Biol Evol. 2010 Dec;27(12):2716-32. doi: 10.1093/molbev/msq161. Epub 2010 Jun 25. Mol Biol Evol. 2010. PMID: 20581330
-
Archaeal extrachromosomal genetic elements.Microbiol Mol Biol Rev. 2015 Mar;79(1):117-52. doi: 10.1128/MMBR.00042-14. Microbiol Mol Biol Rev. 2015. PMID: 25694123 Free PMC article. Review.
Cited by
-
Exploring short k-mer profiles in cells and mobile elements from Archaea highlights the major influence of both the ecological niche and evolutionary history.BMC Genomics. 2021 Mar 16;22(1):186. doi: 10.1186/s12864-021-07471-y. BMC Genomics. 2021. PMID: 33726663 Free PMC article.
-
Pervasive Suicidal Integrases in Deep-Sea Archaea.Mol Biol Evol. 2020 Jun 1;37(6):1727-1743. doi: 10.1093/molbev/msaa041. Mol Biol Evol. 2020. PMID: 32068866 Free PMC article.
-
Archaeal tyrosine recombinases.FEMS Microbiol Rev. 2021 Aug 17;45(4):fuab004. doi: 10.1093/femsre/fuab004. FEMS Microbiol Rev. 2021. PMID: 33524101 Free PMC article. Review.
References
-
- Albers, S.V. and Siebers, B. (2014) The Prokaryotes: Other Major Lineages of Bacteria and the Archaea. Rosenberg, E., DeLong, E.F., Lory, S., Stackebrandt, E., and Thompson, F. (Eds.). Heidelberg, Germany; New York, NY; Dordrecht, Netherlands; London, England: Springer. 10.1007/978-3-642-38954-2. - DOI
-
- Antranikian, G. , Suleiman, M. , Schäfers, C. , Adams, M.W.W. , Bartolucci, S. , Blamey, J.M. , et al (2017) Diversity of bacteria and archaea from two shallow marine hydrothermal vents from Vulcano Island. Extremophiles 21: 733–742. - PubMed
-
- Béguin, P. , Baron, B. , Gill, S. , Charpin, N. , and Forterre, P. (2014) The SF1 helicase encoded by the archaeal plasmid pTN2 of Thermococcus nautili . Extremophiles 18: 779–787. - PubMed
-
- Brochier‐Armanet, C. , Forterre, P. , and Gribaldo, S. (2011) Phylogeny and evolution of the archaea: One hundred genomes later. Curr Opin Microbiol 14: 274–281. - PubMed
Publication types
MeSH terms
Grants and funding
LinkOut - more resources
Full Text Sources
Molecular Biology Databases
