. 2019 Sep 24;13(9):10161-10178.
doi: 10.1021/acsnano.9b03334. Epub 2019 Sep 10.

Kinetic Control in Assembly of Plasmid DNA/Polycation Complex Nanoparticles

Affiliations

Kinetic Control in Assembly of Plasmid DNA/Polycation Complex Nanoparticles

Yizong Hu et al. ACS Nano. .

Abstract

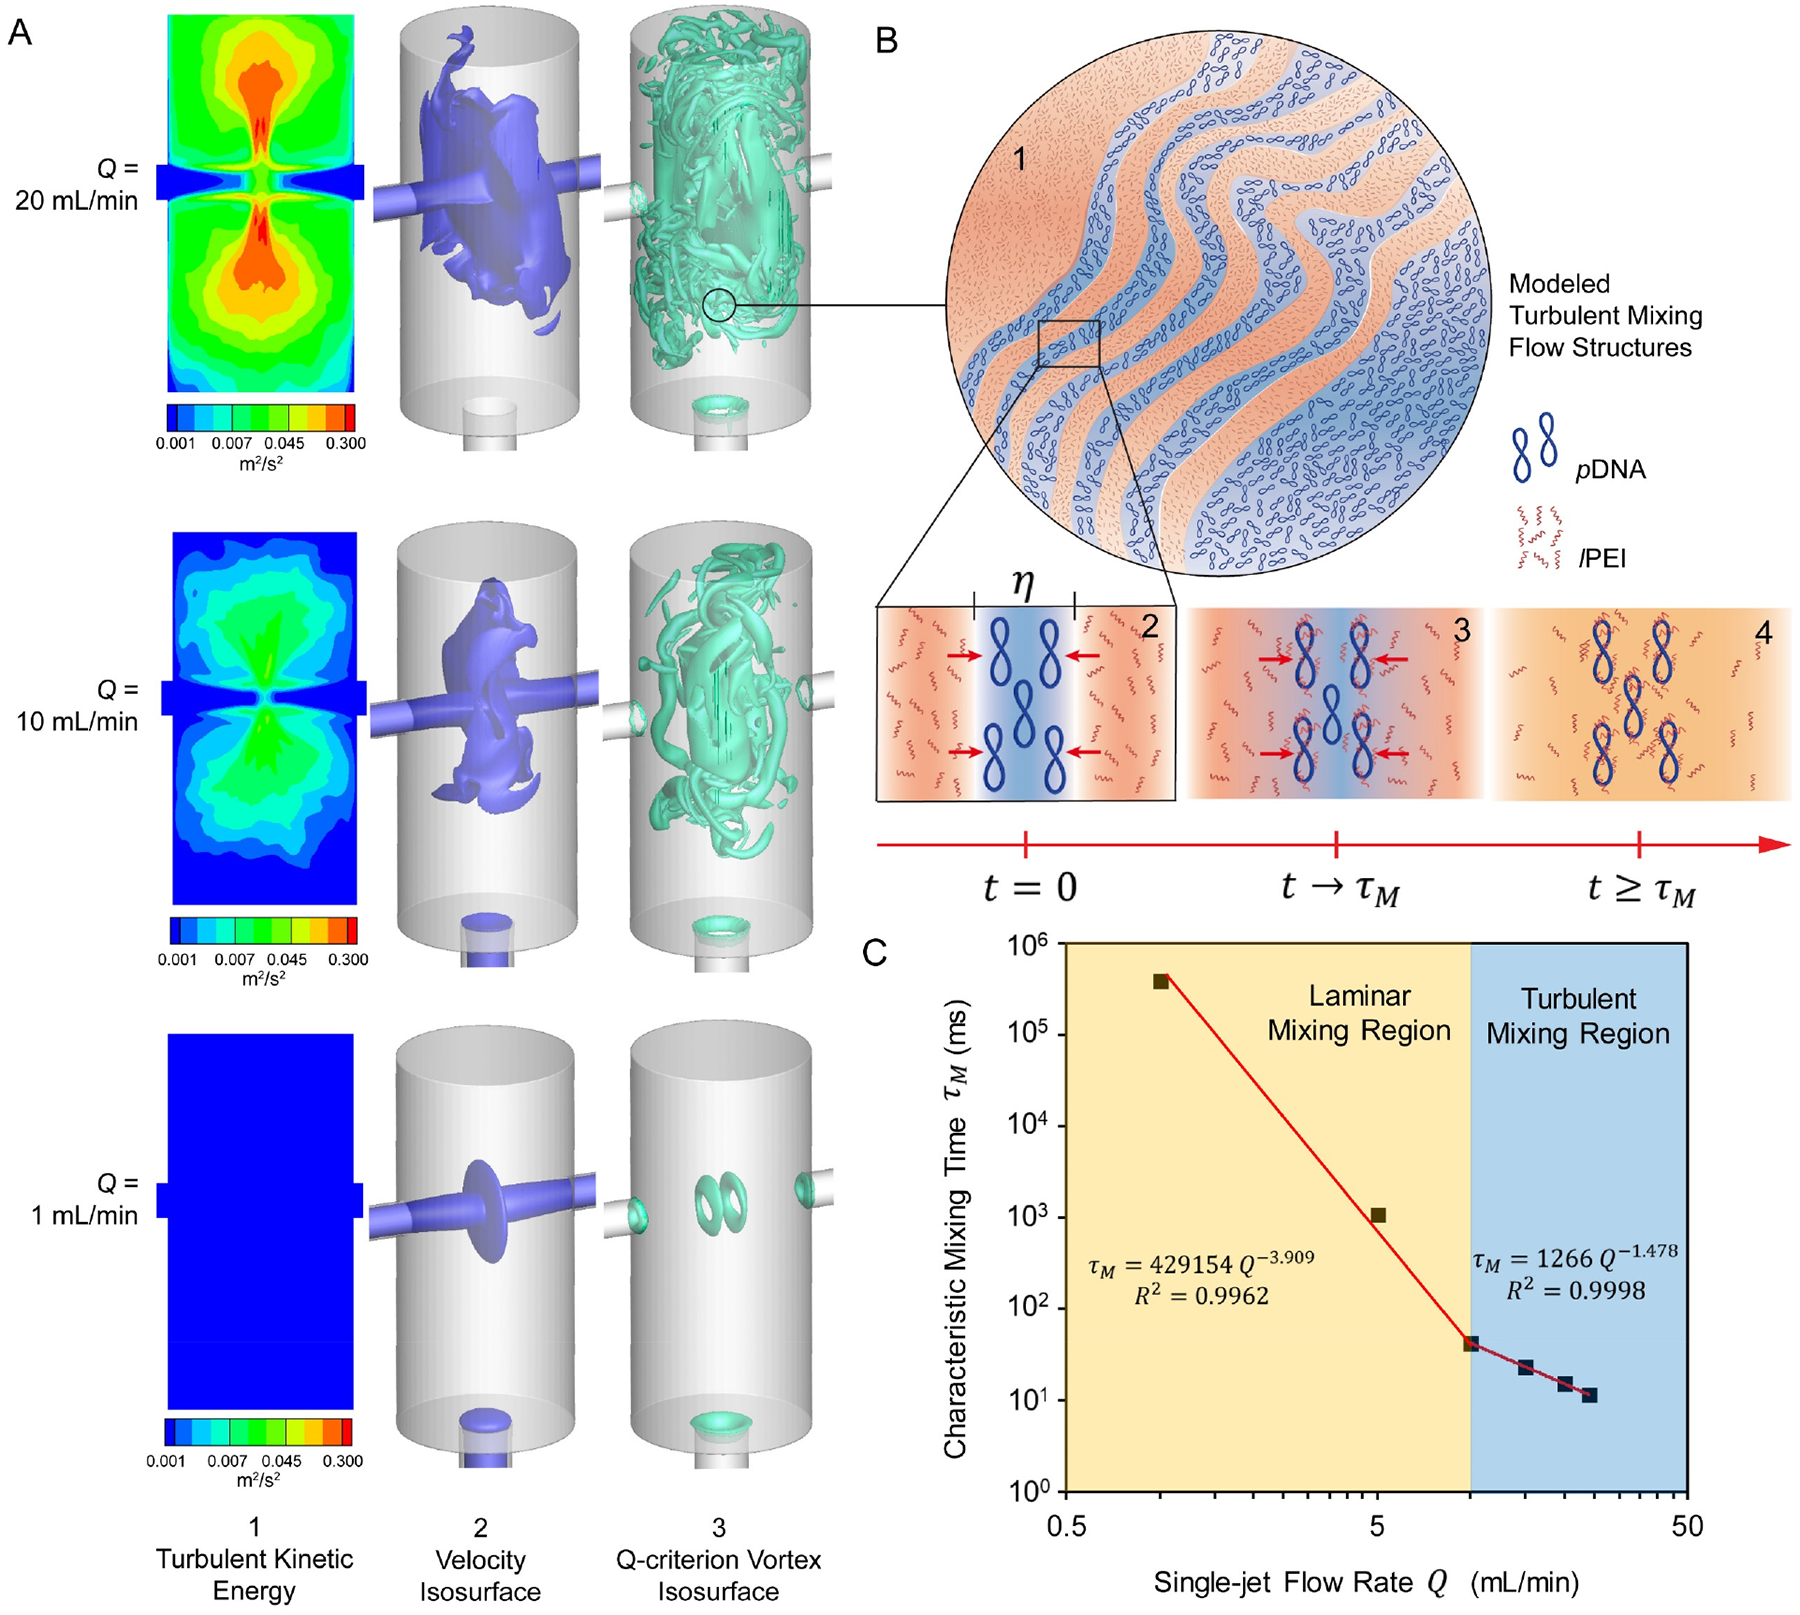
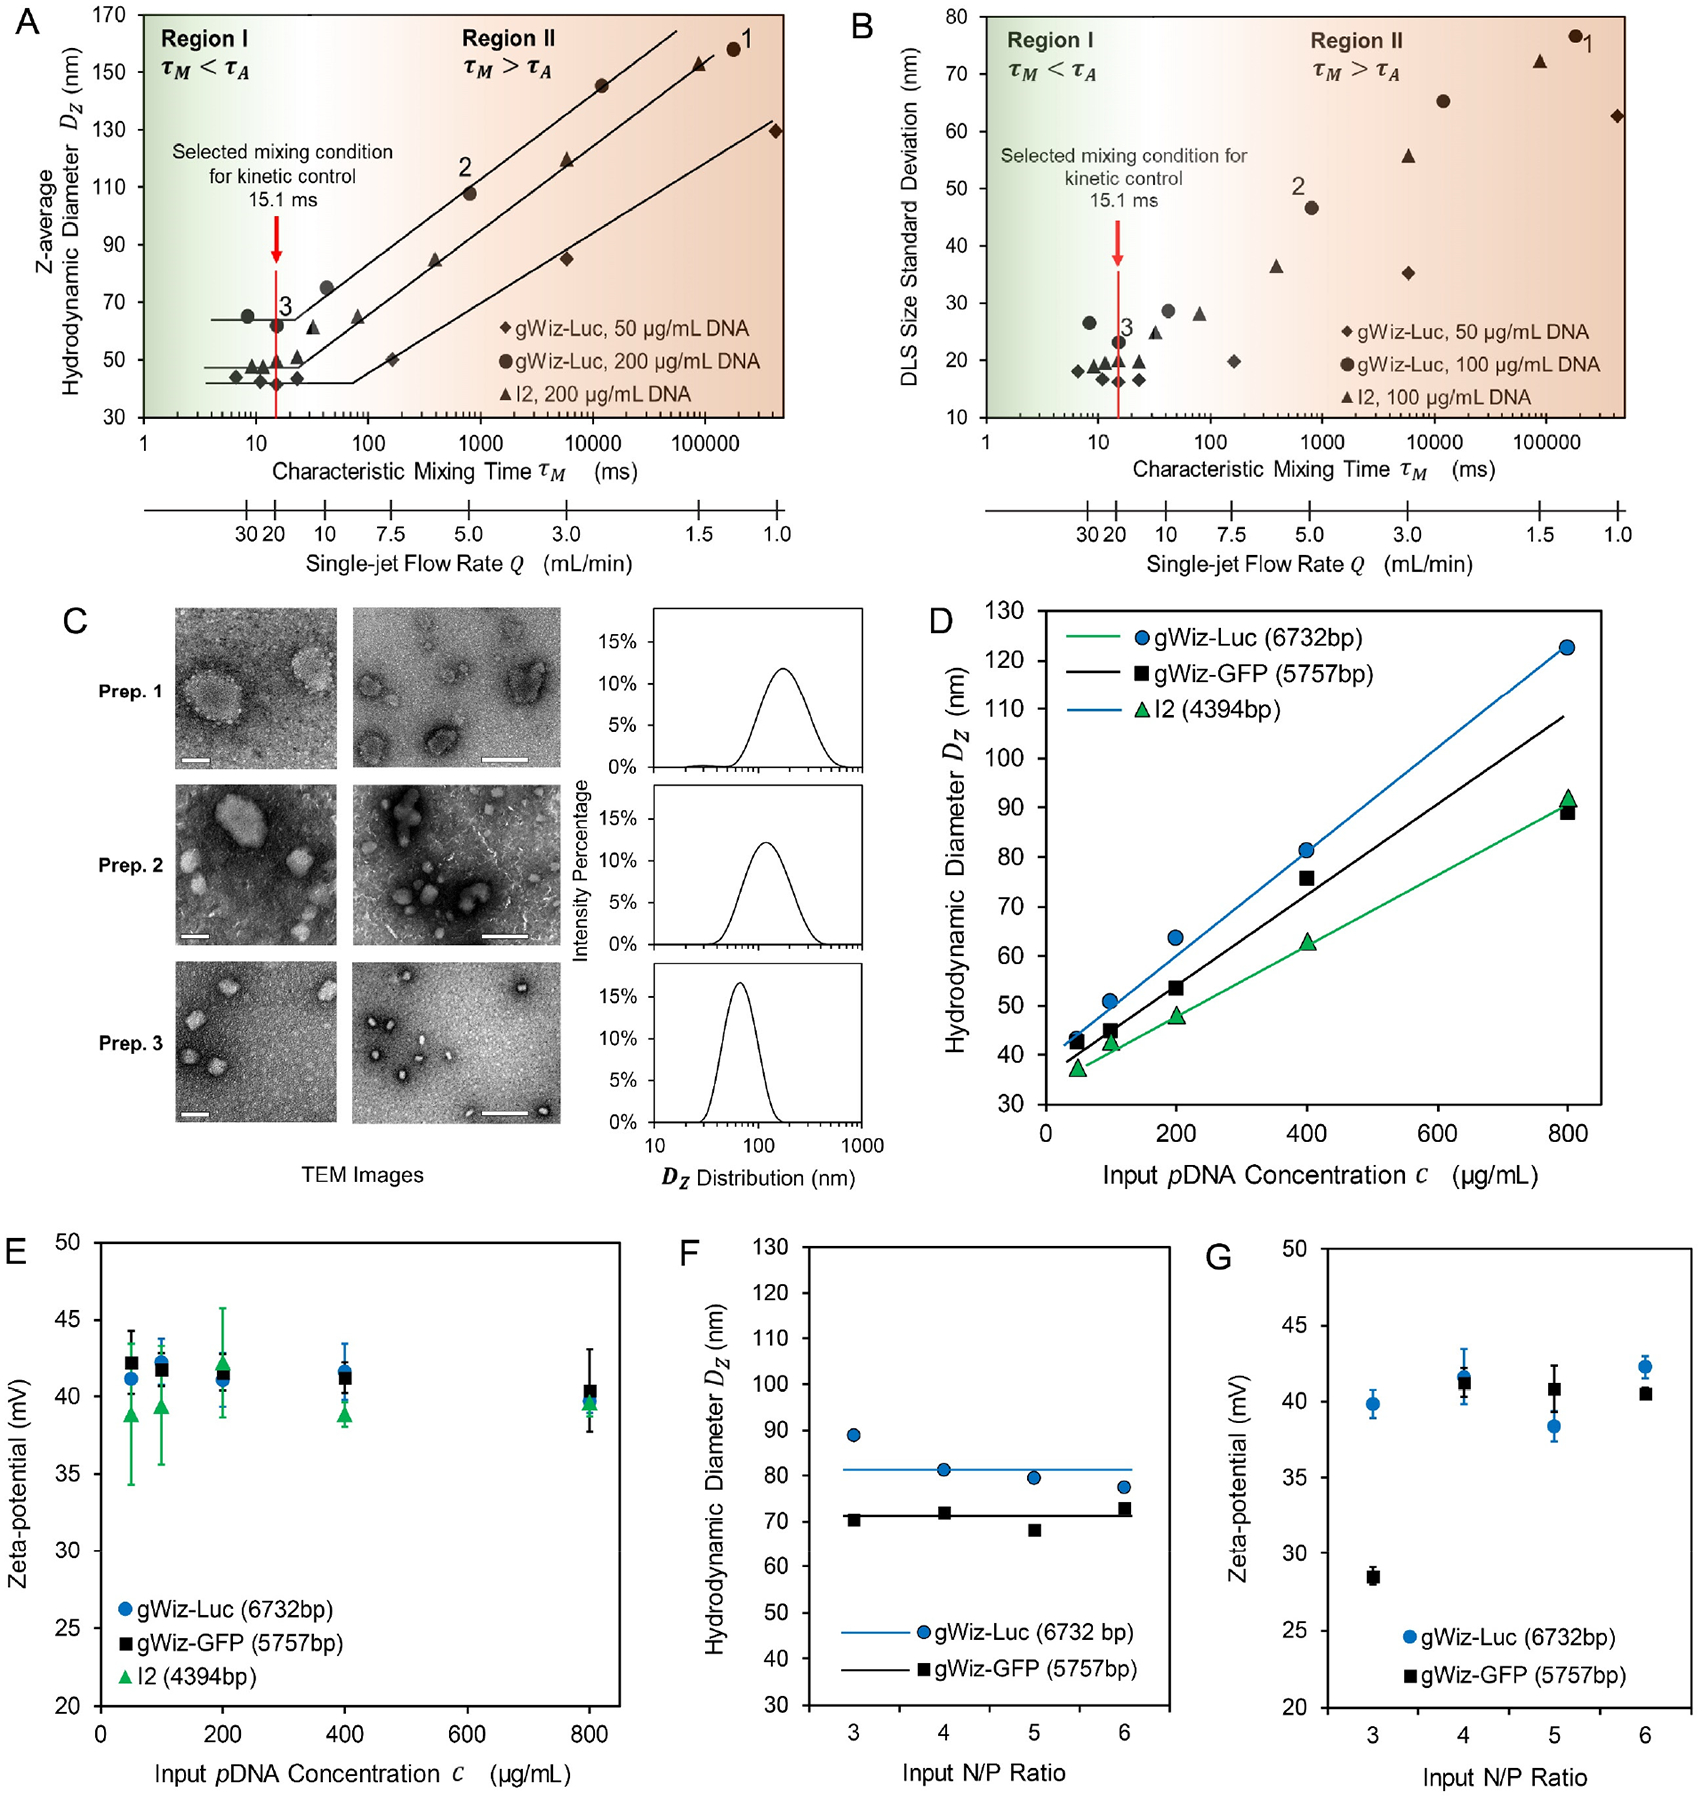
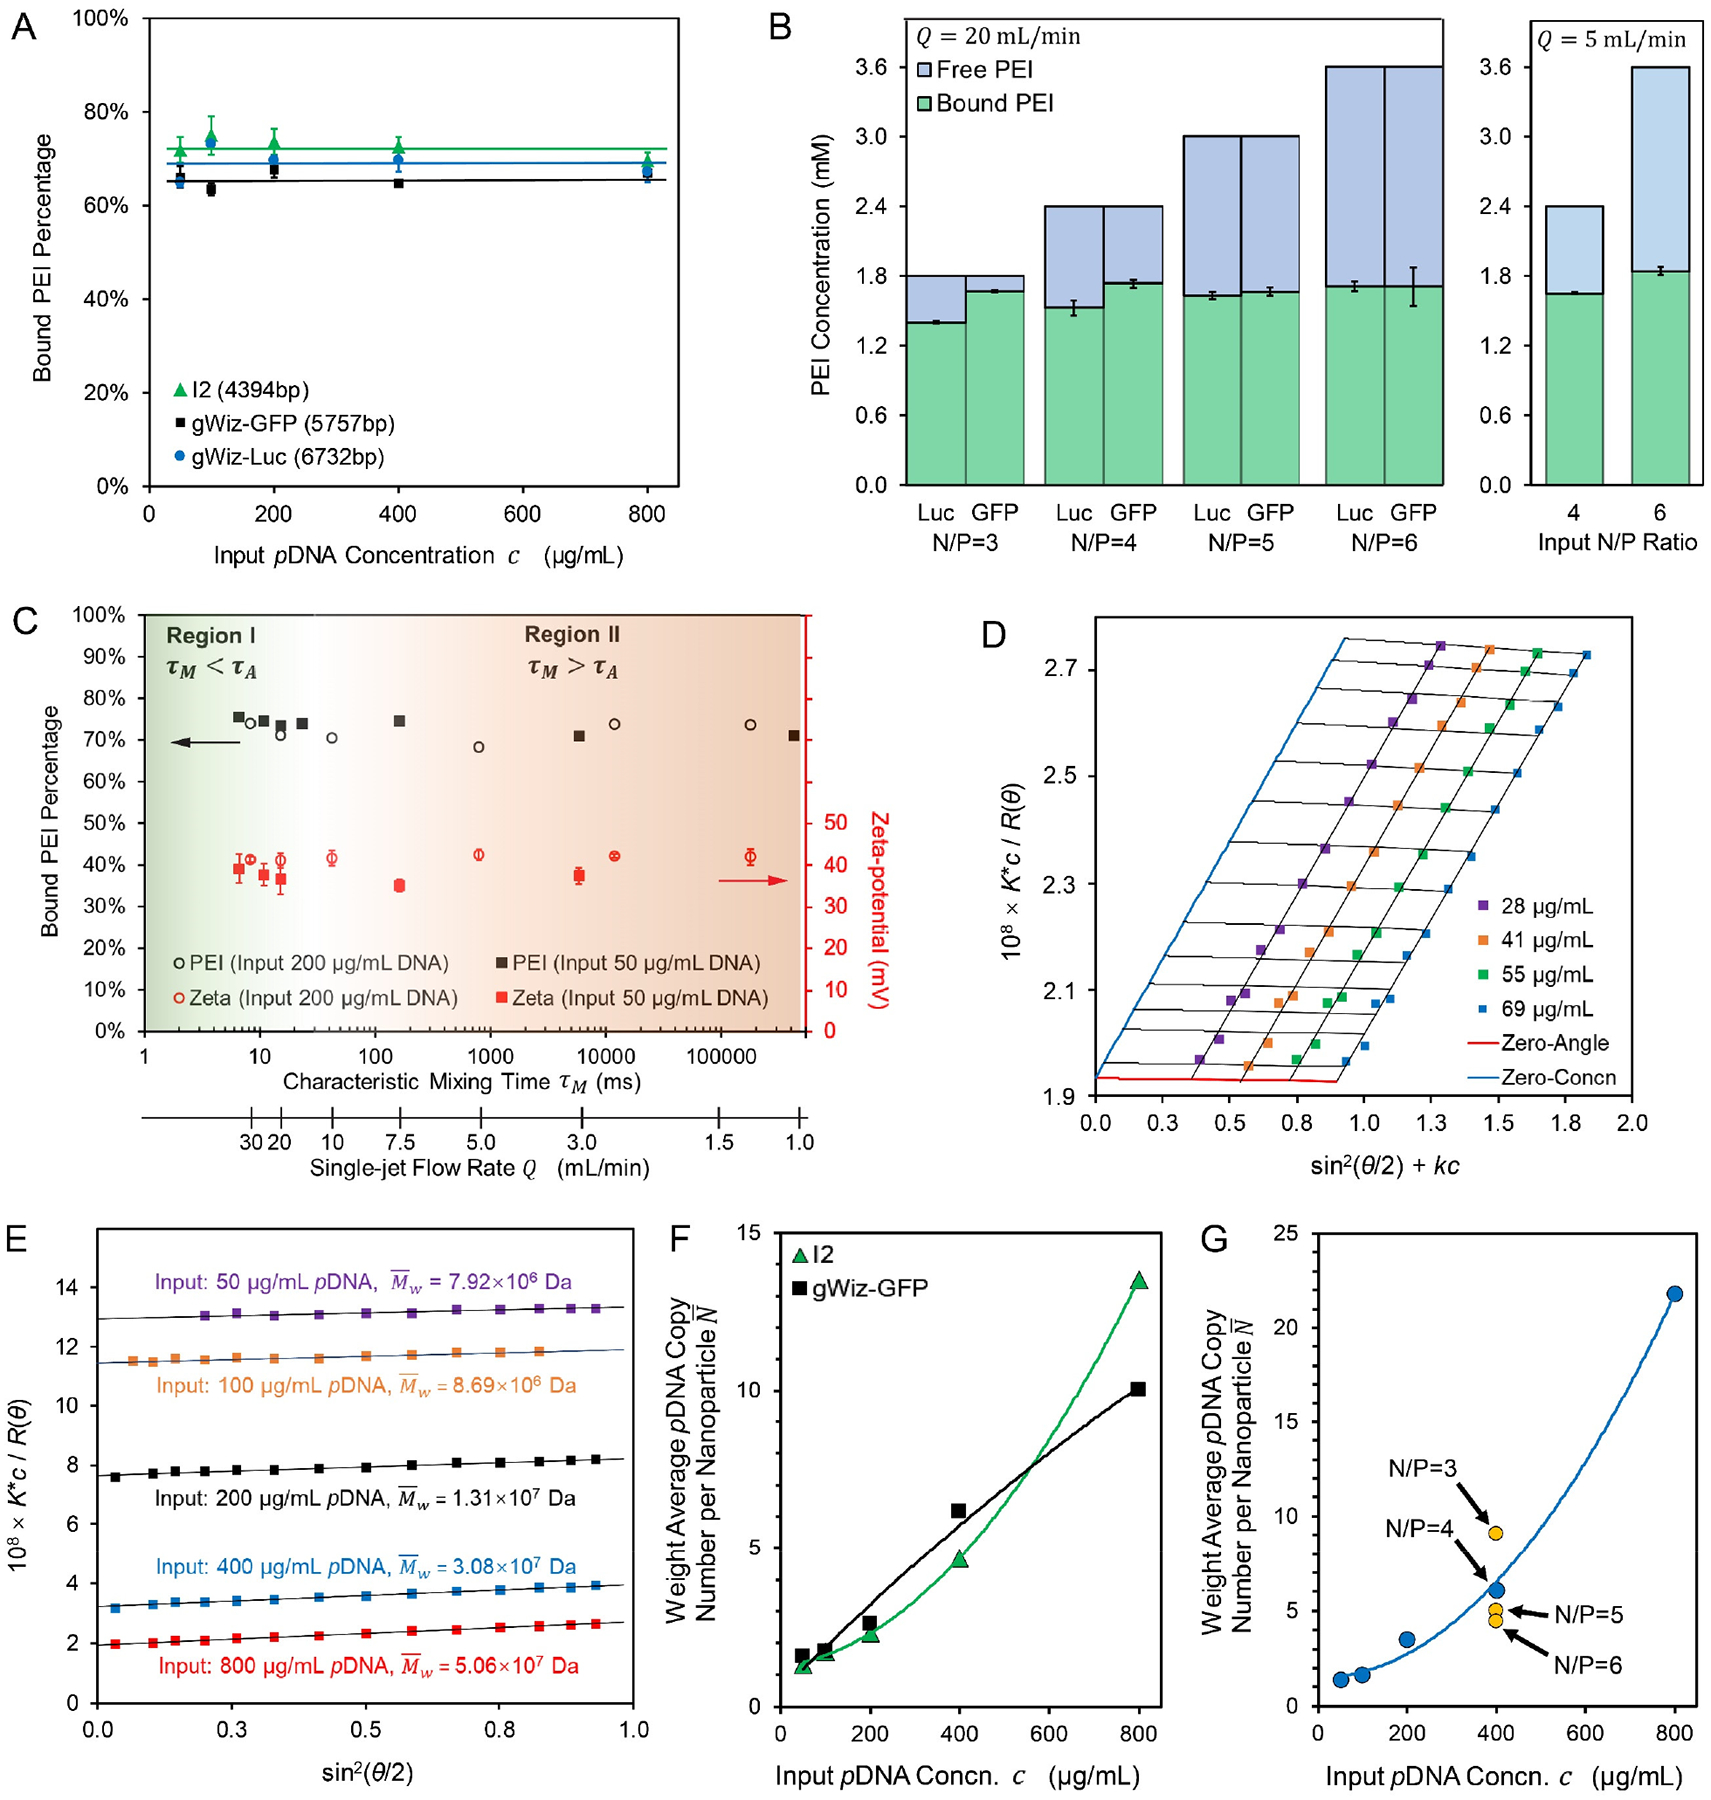
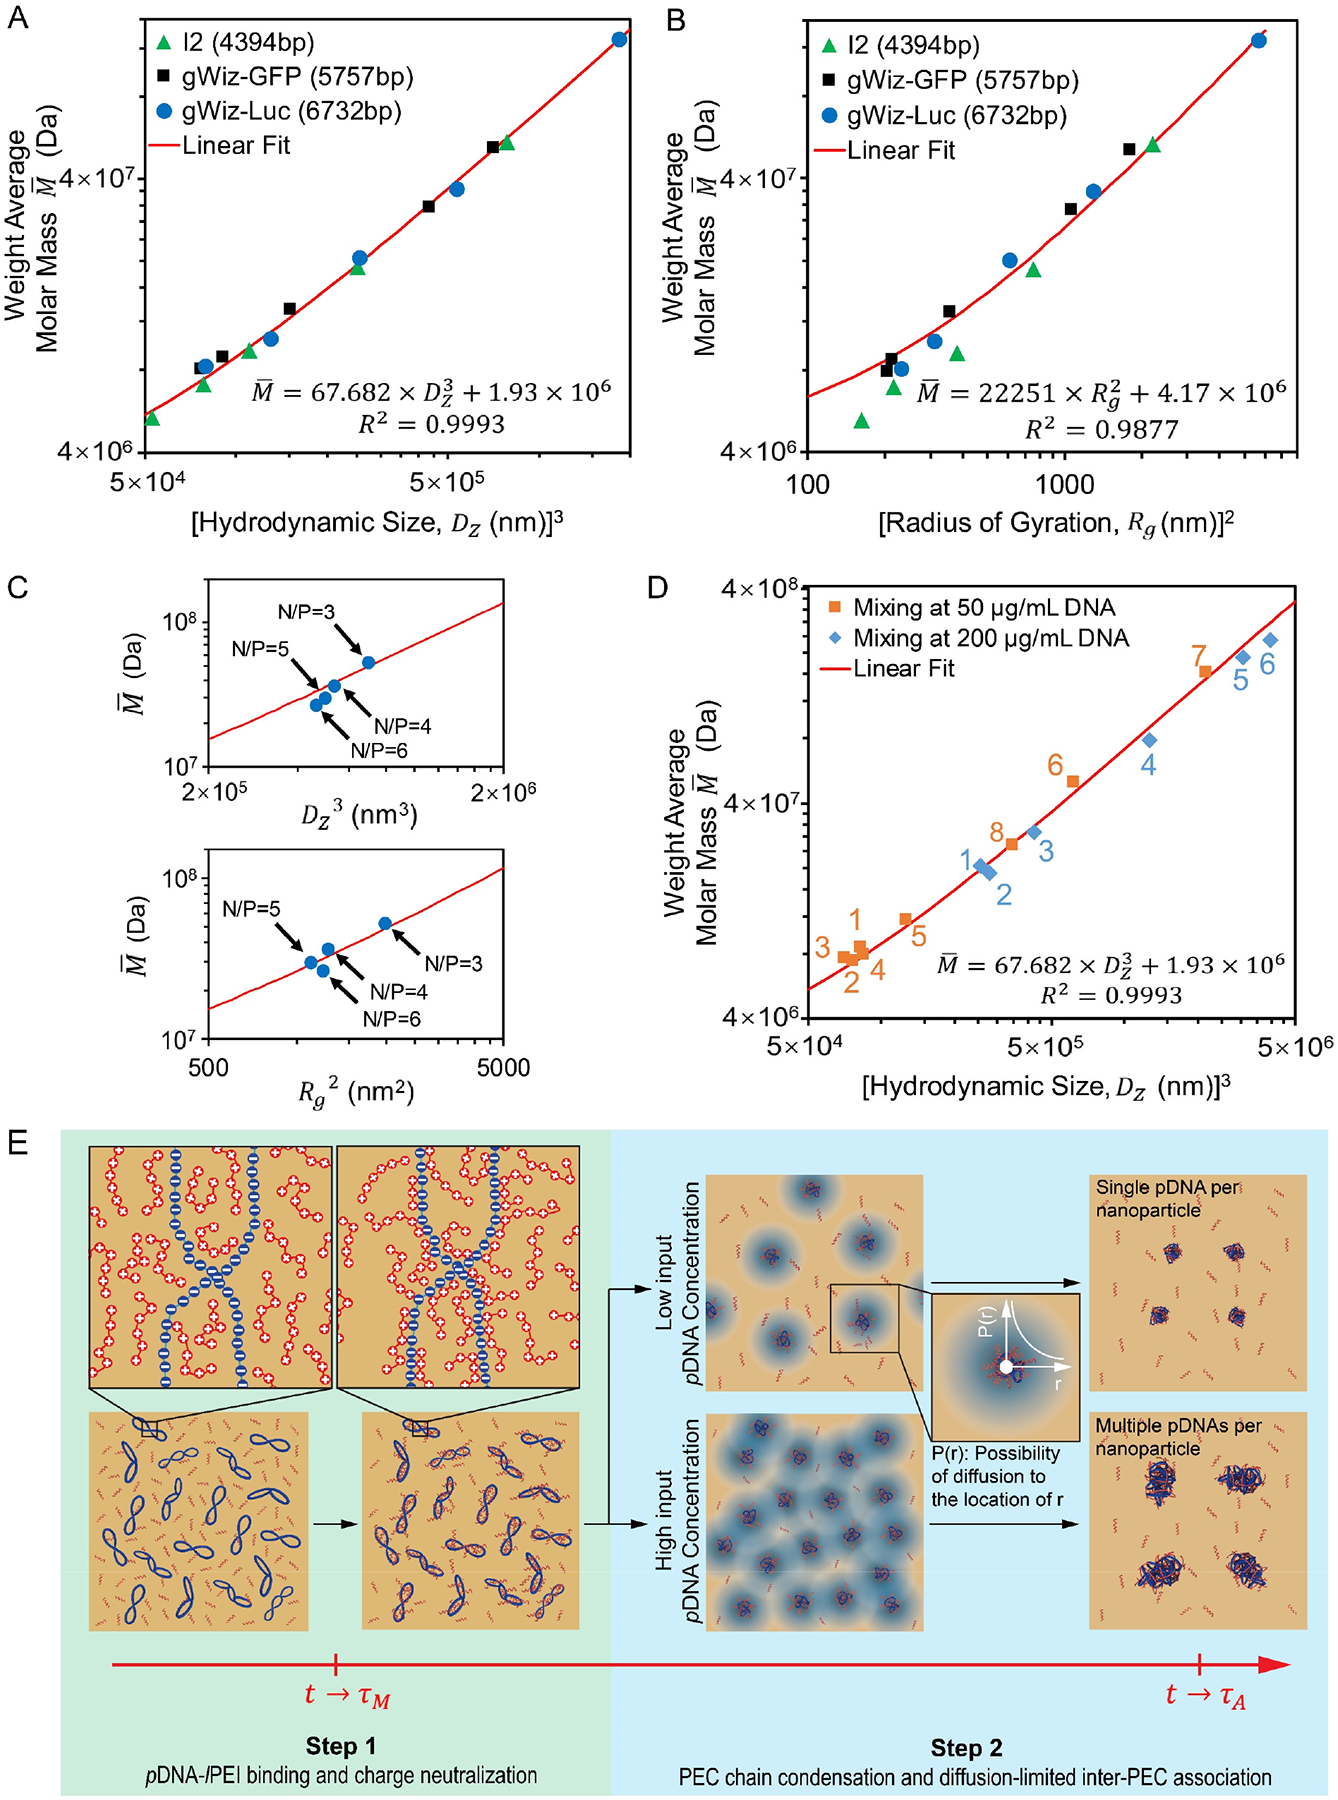
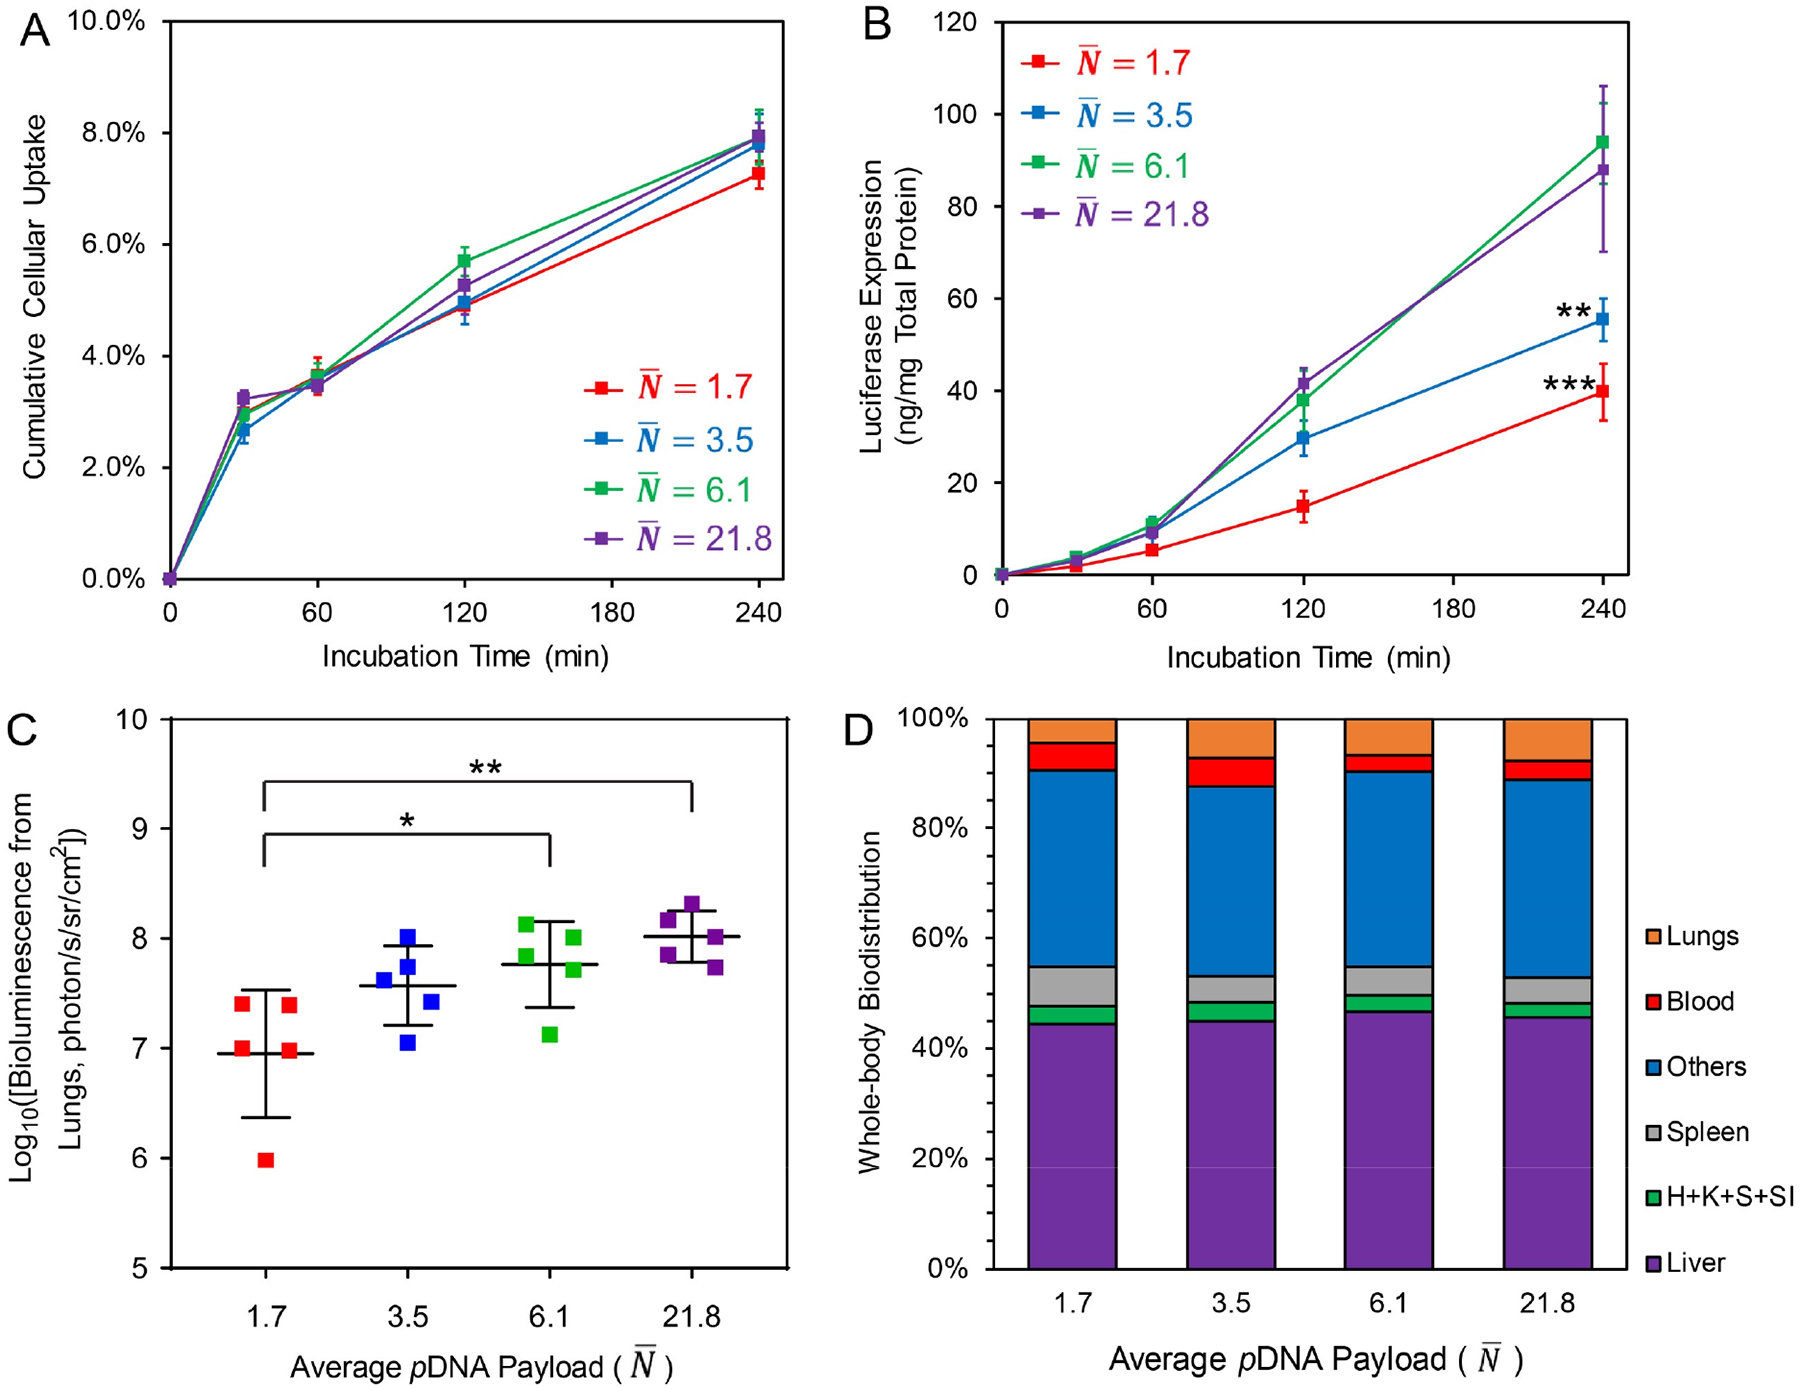
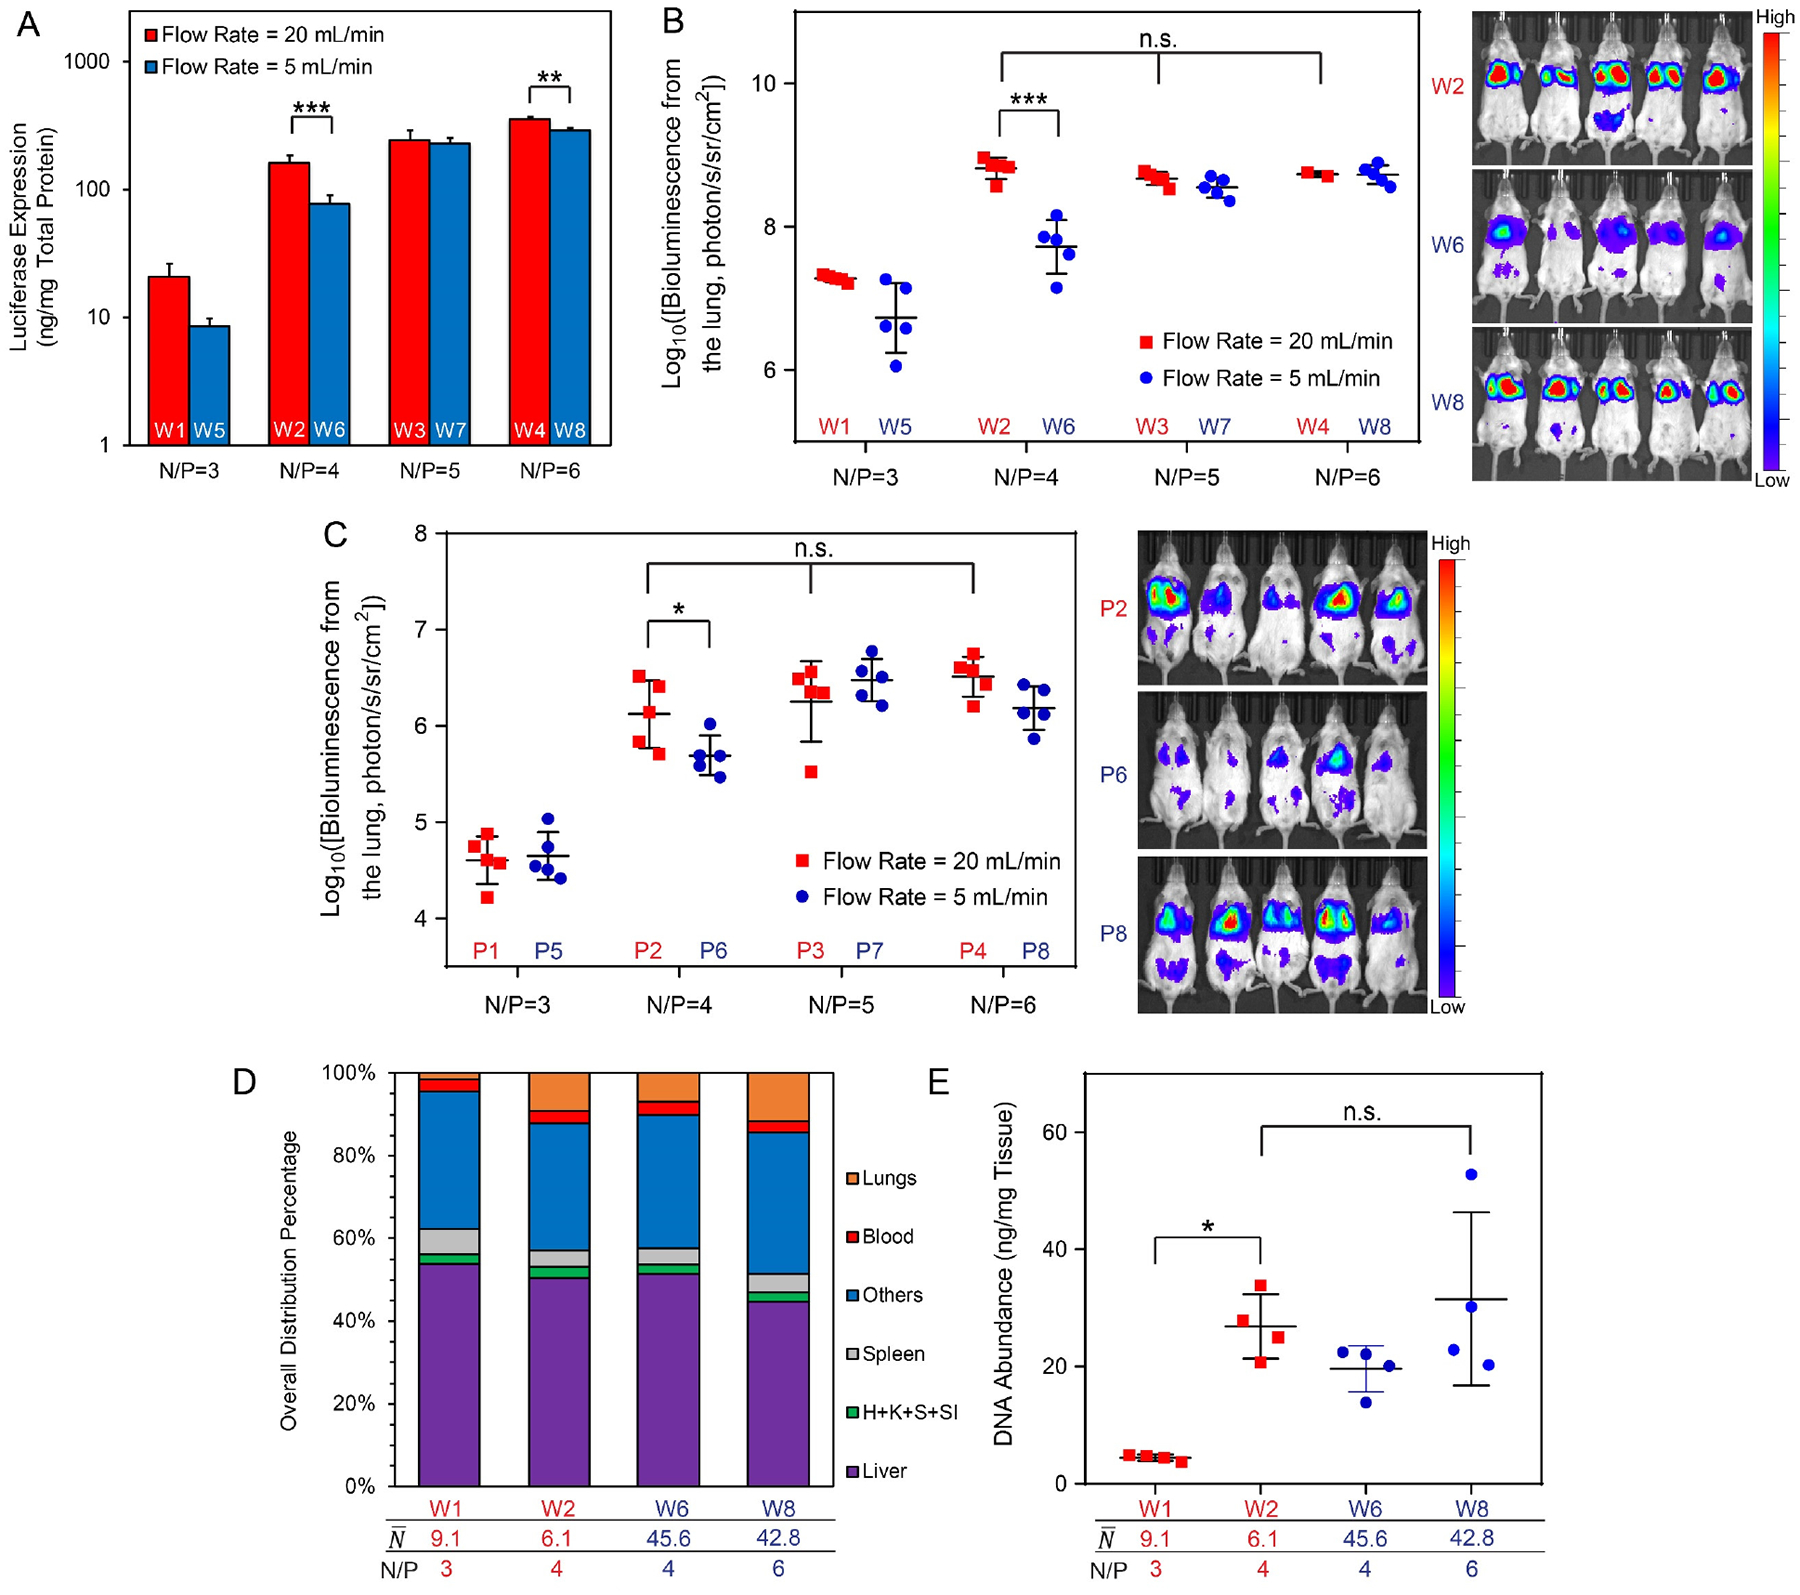
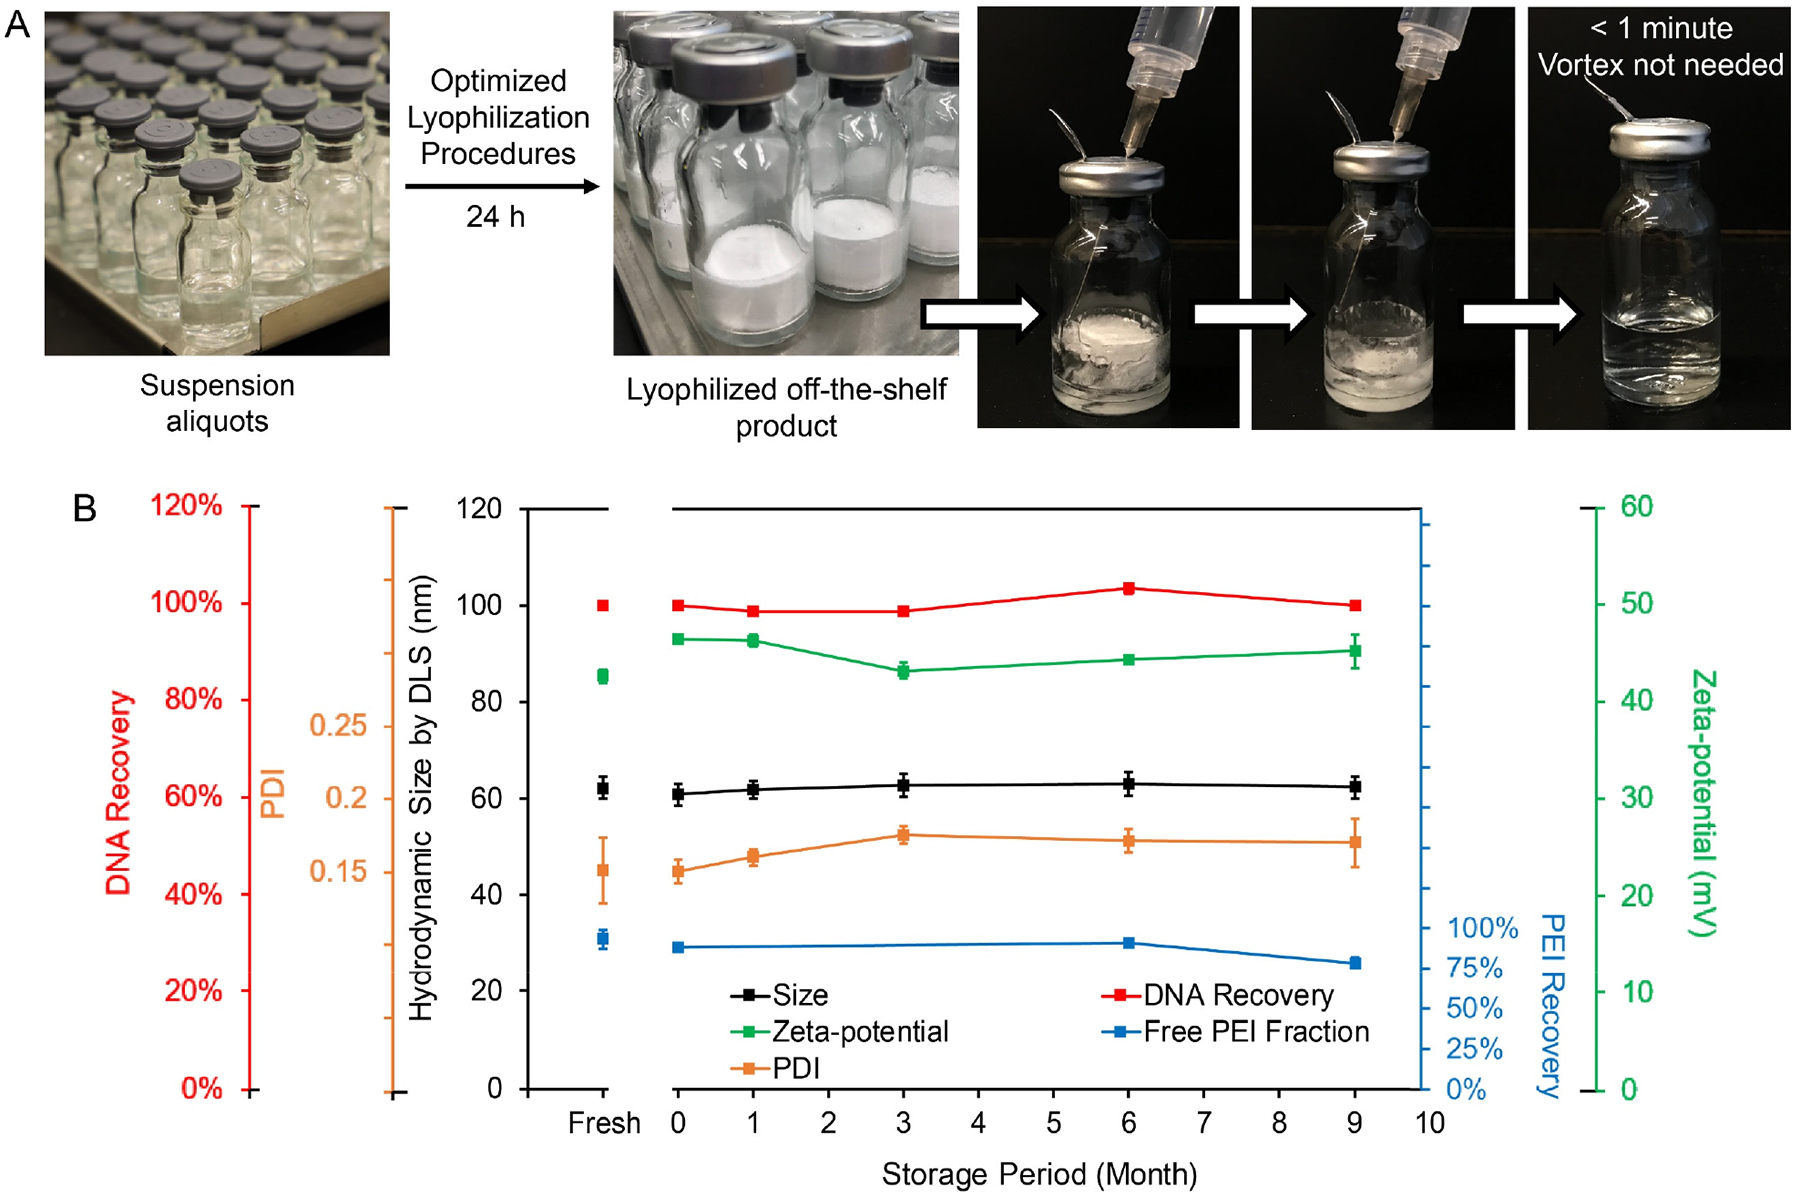
Polyelectrolyte complex (PEC) nanoparticles assembled from plasmid DNA (pDNA) and polycations such as linear polyethylenimine (lPEI) represent a major nonviral delivery vehicle for gene therapy tested thus far. Efforts to control the size, shape, and surface properties of pDNA/polycation nanoparticles have been primarily focused on fine-tuning the molecular structures of the polycationic carriers and on assembly conditions such as medium polarity, pH, and temperature. However, reproducible production of these nanoparticles hinges on the ability to control the assembly kinetics, given the nonequilibrium nature of the assembly process and nanoparticle composition. Here we adopt a kinetically controlled mixing process, termed flash nanocomplexation (FNC), that accelerates the mixing of pDNA solution with polycation lPEI solution to match the PEC assembly kinetics through turbulent mixing in a microchamber. This achieves explicit control of the kinetic conditions for pDNA/lPEI nanoparticle assembly, as demonstrated by the tunability of nanoparticle size, composition, and pDNA payload. Through a combined experimental and simulation approach, we prepared pDNA/lPEI nanoparticles having an average of 1.3 to 21.8 copies of pDNA per nanoparticle and average size of 35 to 130 nm in a more uniform and scalable manner than bulk mixing methods. Using these nanoparticles with defined compositions and sizes, we showed the correlation of pDNA payload and nanoparticle formulation composition with the transfection efficiencies and toxicity in vivo. These nanoparticles exhibited long-term stability at -20 °C for at least 9 months in a lyophilized formulation, validating scalable manufacture of an off-the-shelf nanoparticle product with well-defined characteristics as a gene medicine.

Keywords: DNA/polycation nanoparticle; gene delivery; kinetic control; linear polyethylenimine; polyelectrolyte complex; transfection; turbulent mixing.


Conflict of interest statement

H.-Q.M., Y.H., H.-W.L., I.M., M.G.P., C.G.U., and C.A.C. are co-inventors of U.S. Patent Applications covering the method and plasmid DNA/polycation nanoparticles as described in this paper. M.P. is a co-founder of Cancer Targeting Systems (CTS), Inc. that has licensed the technology described here. Other authors declare no competing financial interest.

Figures

Figure 1.
Figure 1.. Turbulent mixing of pDNA and lPEI solutions in a confined impinging jet (CIJ) microchamber.
(A) Simulated flow fields based on the actual CIJ mixer dimensions: (1) Time-averaged turbulent kinetic energy (TKE) distribution, (2) Instantaneous velocity isosurface sampled at t = 110 ms, and (3) Instantaneous Q-criterion vortex isosurface sampled at t = 110 ms; (B) Illustrations of (1) the turbulent mixing flow structures generated at a flow rate of 20 mL/min, (2) separation of the pDNA and lPEI solution flows at the Kolmogorov length scale η, (3) diffusion of lPEI molecules into the pDNA flow regions, and (4) uniform mixing as defined by the input concentration profile of pDNA and lPEI across a time scale of τM; (C) Correlation between the characteristic mixing time τM and flow rate Q, as fitted from simulation results of 6 different flow rates.
Figure 2.
Figure 2.. Effect of characteristic mixing time τM on pDNA/lPEI nanoparticle assembly.
(A, B) Effect of mixing kinetics profile (τM and flow rate Q) on the average nanoparticle size Dz (A) and uniformity shown as the DLS size standard deviation (B). The mixing kinetics scale is divided into two regions: Region I (τM < τA) and Region II (τM > τA). Labels 1, 2 and 3 denote three representative preparations generated from three different mixing conditions; (C) Transmission electron microscopy (TEM) images and DLS profiles of the three sets of nanoparticles prepared at Q = 1.25 mL/min, τM = 1.8 × 10⁵ ms (Prep. 1), Q = 5 mL/min, τM = 790 ms (Prep. 2), and Q = 20 mL/min, τM = 15 ms (Prep. 3). Scale bar = 50 nm (for left panel) and 200 nm (for right panel); (D, E) Effect of input pDNA concentration and plasmid size on the average nanoparticle size Dz (D) and zeta potential (E) prepared by τM = 15 ms; (F, G) Effect of N/P ratio on the average nanoparticle size Dz (F) and zeta potential (G) prepared by τM = 15 ms. For the conditions tested, the size profile and zeta potential of pDNA/lPEI nanoparticles did not vary with the N/P ratio from 4 to 6.
Figure 3.
Figure 3.. Compositions of the FNC-assembled pDNA/lPEI nanoparticles.
(A) The fraction of bound lPEI and the composition of the assembled nanoparticles remained similar when nanoparticles were prepared at different input pDNA concentrations or with different plasmids; (B) Bound vs. free lPEI amount and proportions with an input N/P ratio from 3 to 6 for gWiz-Luc and gWiz-GFP nanoparticle formulations assembled under a turbulent mixing condition (Q = 20 mL/min, τM = 15 ms < τA) and a laminar mixing condition (Q = 5 mL/min, τM= 790 ms > τA). Labels: Luc and GFP for gWiz-Luc and gWiz-GFP plasmid nanoparticles, respectively; (C) Bound lPEI fraction and zeta-potential of nanoparticles prepared with 50 or 200 μg/mL of gWiz-Luc pDNA under different flow rates, suggesting that all gWiz-Luc/lPEI nanoparticles share the same average composition; (D) A representative Zimm plot for I2/lPEI nanoparticles with a molar mass of 5.32 × 10⁷ Da, also showing the second viral coefficient A approaching zero; (E) Representative Debye plots for gWiz-GFP/lPEI nanoparticles prepared by varying input pDNA concentration for I2 plasmid; (F, G) Calculated weight average pDNA copy numbers per nanoparticle (N) for preparations from lPEI and I2 or gWiz-GFP plasmids at N/P = 4 (F) or gWiz-Luc plasmid at different concentrations and N/P ratios (G).
Figure 4.
Figure 4.. Assembly of pDNA/lPEI PEC nanoparticles.
(A, B) Correlation of nanoparticle average molar mass and size (A) and radius of gyration (B) for nanoparticles assembled under turbulent mixing condition (Q = 20 mL/min, τM = 15 ms). Each data point in (A) and (B) represents an independent formulation batch; (C) Application of the linear fits from Eq. 5 (Upper panel) and Eq. 6 (Bottom panel) to nanoparticles formulated with different N/P ratios at Q = 20 mL/min; (D) Correlation of nanoparticle average molar mass and size for nanoparticles produced by different mixing conditions, i.e. with different τM. For input pDNA concentration of 25 μg/mL (orange), label 1 to 8 represent τM of 7, 11, 15, 23, 163, 5855, 4 × 10⁵ ms, and pipetting respectively; for 100 μg/mL (blue), label 1 to 6 represent τM of 8, 15, 42, 795, 104 and 2 × 10⁵ ms, respectively; (E) The proposed two-step pDNA/lPEI PEC nanoparticle assembly model under turbulent mixing condition (τM < τA).
Figure 5.
Figure 5.. Transfection process and efficiency of pDNA/lPEI nanoparticles with different numbers of pDNA per particle.
(A) Cellular uptake quantitative assay of nanoparticles prepared with 3H-labeled pDNA in PC3 prostate cell line following a 4-h incubation period (pDNA dosage = 0.6 μg/104 cells); (B) The in vitro transfection efficiency of nanoparticles with different N¯ in PC3 cells with a 4-h incubation (pDNA dosage = 0.6 μg/104 cells). The asterisks denote significance level when comparing with N¯=6.1 nanoparticle group; (C) The in vivo transfection efficiency (bioluminescence radiance) in the lung of BALB/c mice at 12 h post i.v. injection of nanoparticles (dose = 30 μg pDNA per mouse); (D) Whole-body biodistribution of nanoparticles at 1-h post i.v. injection of 3H-labeled nanoparticles containing 30 μg pDNA per mouse. Labels: H: heart, K: kidneys, S: stomach, SI: small intestine. For statistical analysis, *p < 0.05, **p < 0.01, and ***p < 0.001 from one-way ANOVA and multiple comparisons (GraphPad Prism 8).
Figure 6.
Figure 6.. Transgene expression of pDNA/lPEI nanoparticles produced under kinetically controlled conditions with different N/P ratios and payload levels (N¯).
(A) In vitro transfection efficiencies of nanoparticles (W1–W8, see Table 1) in PC3 cancer cell line (dose = 0.6 μg gWiz-Luc plasmid/104 cells); (B) In vivo transfection efficiency in the lung in healthy BALB/c mice at 12 h post i.v. injection of nanoparticles (W1–W8, see Table 1) containing 40 μg gWiz-Luc plasmid per mouse (left) and representative IVIS images of groups with significant differences in transgene expression (right); (C) In vivo transfection efficiency in the lung of an LL/2 metastasis model in the NSG mice at 48 h post injection of nanoparticles (P1-P8, see Table 1) containing 40 μg PEG-Luc plasmid per mouse (left) and representative IVIS images of groups with significant differences in transgene expression (right); (D) Whole-body biodistributions in BALB/c mice at 1 h post injection of nanoparticles (W1, W2, W6, W8) containing 40 μg 3H-labeled gWiz-Luc plasmid per mouse. Labels: H: heart, K: kidneys, S: stomach, SI: small intestine; (E) Biodistributions to the lung of mice shown in (D); For statistical analysis, n.s. denotes no statistical significance with p > 0.05, *p < 0.05, **p < 0.01, and ***p < 0.001 from one-way or two-way ANOVA and multiple comparisons.
Figure 7.
Figure 7.. Scale-up production of off-the-shelf pDNA/lPEI nanoparticles and the long-term storage stability.
(A) Lyophilization and reconstitution of nanoparticles prepared using FNC setup; (B) Nanoparticle characteristics upon reconstitution of lyophilized nanoparticles stored at −20°C at Months 0, 1, 3, 6 and 9. Month 0 represents a reconstituted sample right after completion of lyophilization.

Similar articles

Cited by

References

    1. Shi B; Zheng M; Tao W; Chung R; Jin D; Ghaffari D; Farokhzad OC Challenges in DNA Delivery and Recent Advances in Multifunctional Polymeric DNA Delivery Systems. Biomacromolecules 2017, 18, 2231–2246. - PubMed
    1. Hickey JW; Santos JL; Williford J-M; Mao H-Q Control of Polymeric Nanoparticle Size to Improve Therapeutic Delivery. J. Controlled Release 2015, 219, 536–547. - PMC - PubMed
    1. Williford J-M; Santos JL; Shyam R; Mao H-Q Shape Control in Engineering of Polymeric Nanoparticles for Therapeutic Delivery. Biomater. Sci 2015, 3, 894–907. - PMC - PubMed
    1. Blanco E; Shen H; Ferrari M Principles of Nanoparticle Design for Overcoming Biological Barriers to Drug Delivery. Nat. Biotechnol 2015, 33, 941. - PMC - PubMed
    1. Lu M; Ho Y-P; Grigsby CL; Nawaz AA; Leong KW; Huang TJ Three-Dimensional Hydrodynamic Focusing Method for Polyplex Synthesis. ACS Nano 2014, 8, 332–339. - PMC - PubMed

Publication types