. 2019 Oct 3;4(19):e130978.
doi: 10.1172/jci.insight.130978.

Antisense regulation of atrial natriuretic peptide expression

Affiliations

Antisense regulation of atrial natriuretic peptide expression

Selvi Celik et al. JCI Insight. .

Abstract

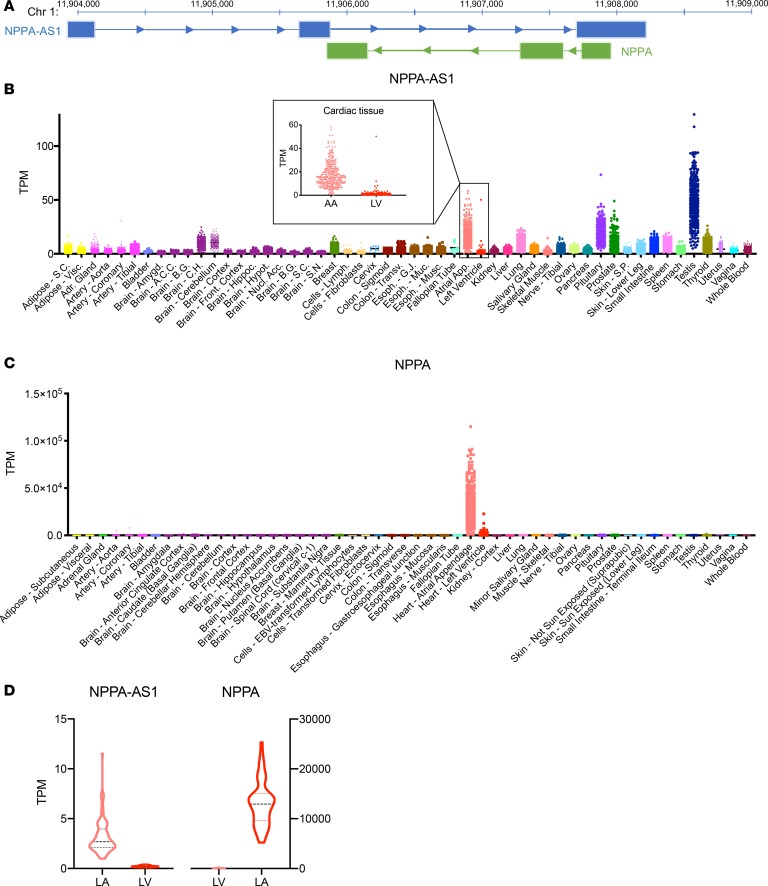
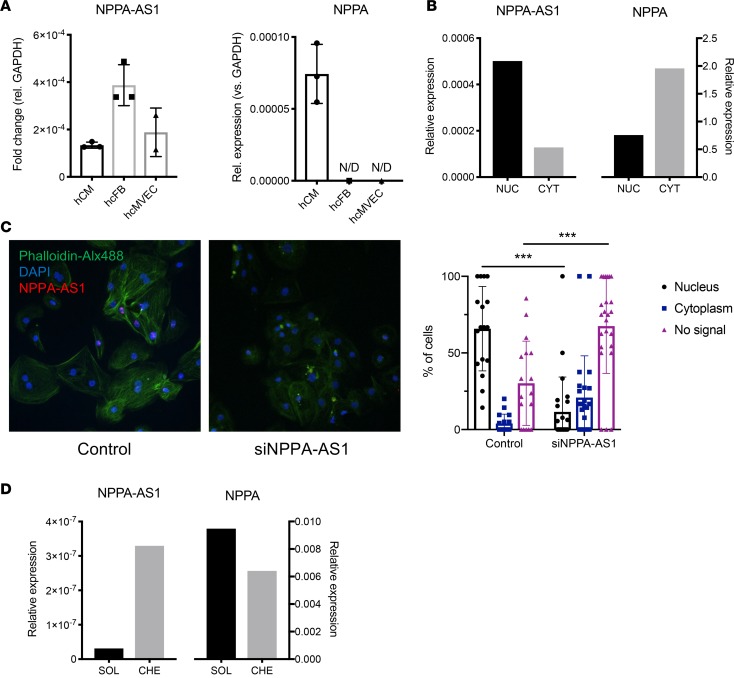
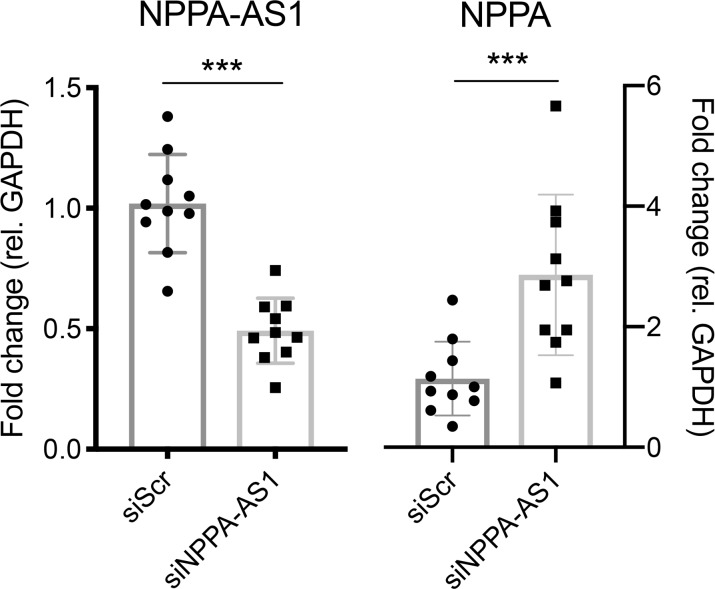
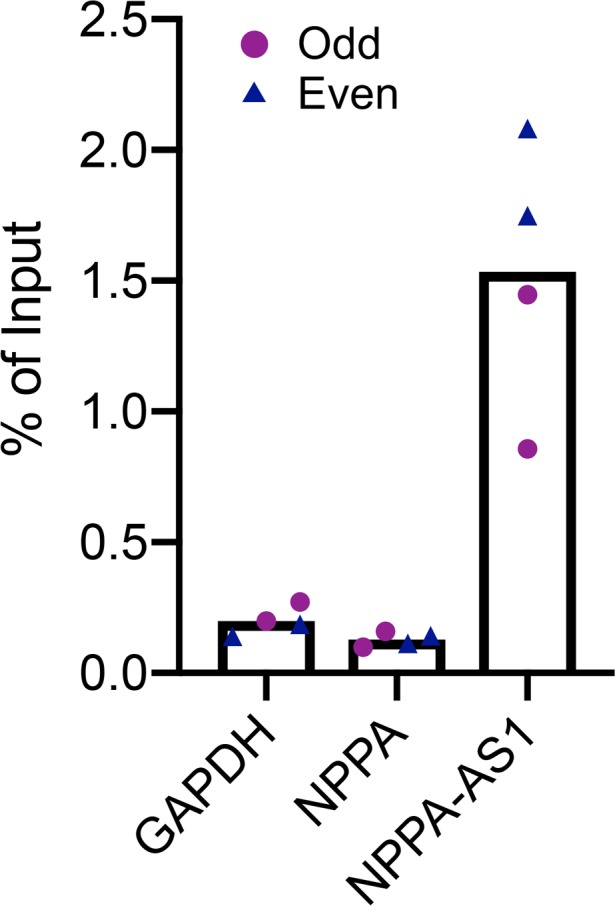
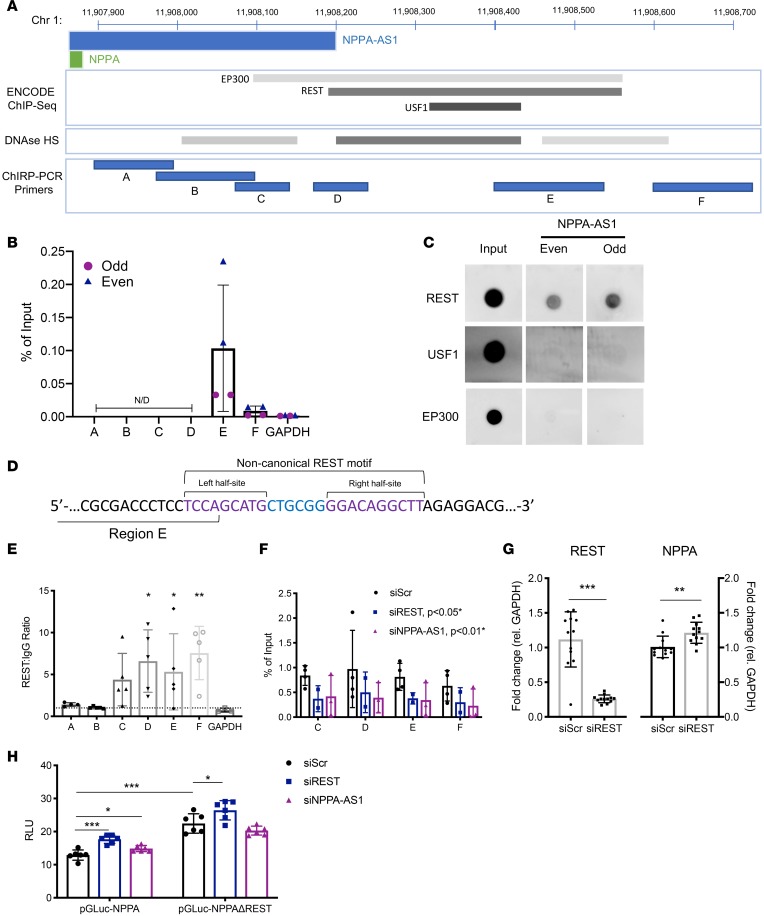
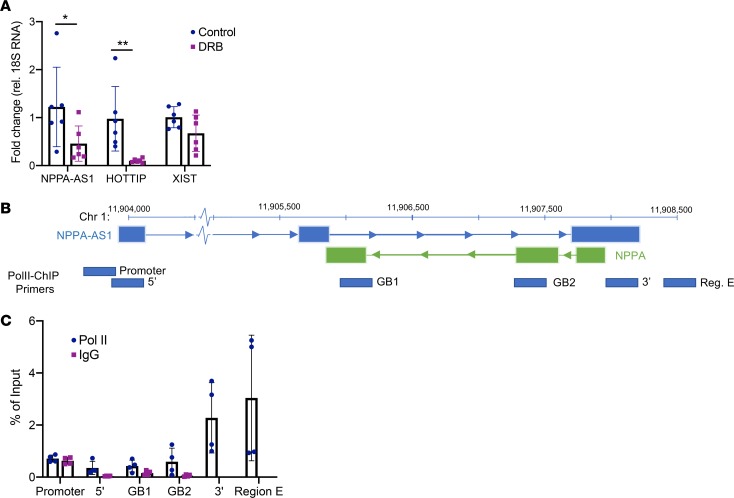
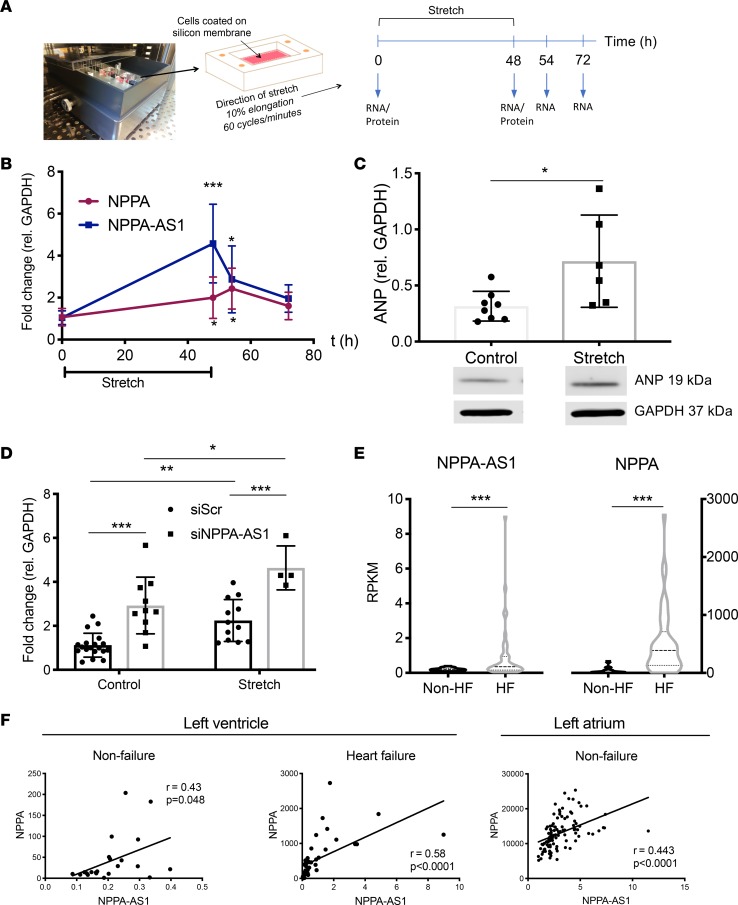
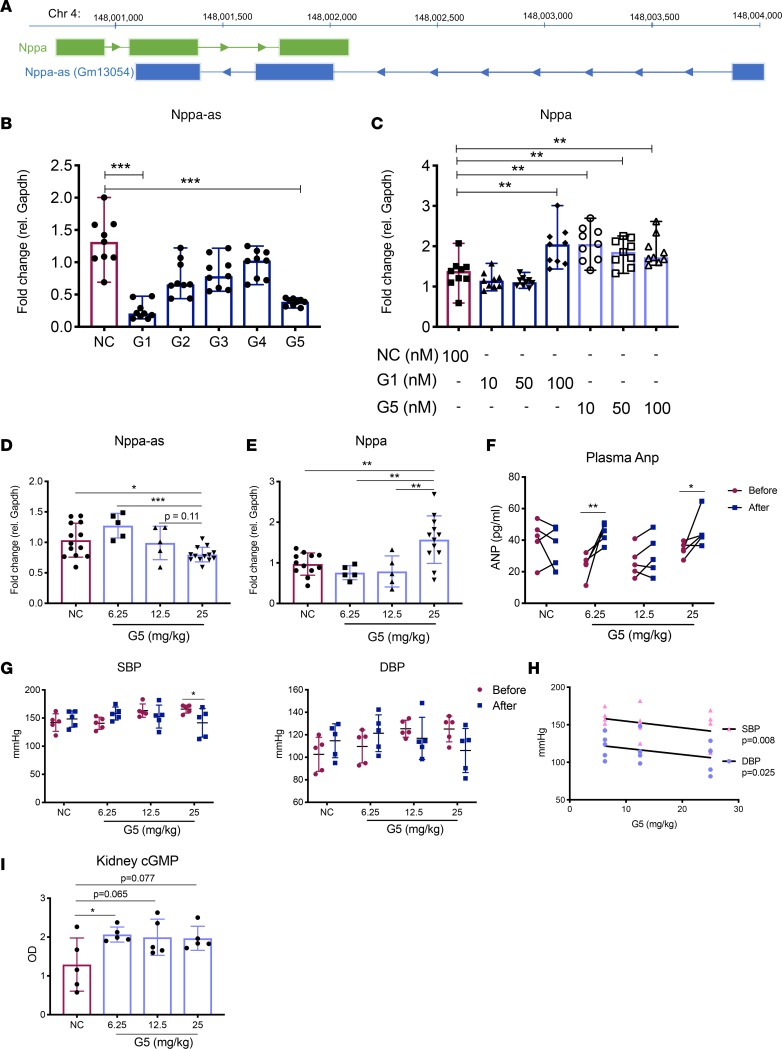
The cardiac hormone atrial natriuretic peptide (ANP) is a central regulator of blood volume and a therapeutic target in hypertension and heart failure. Enhanced ANP activity in such conditions through inhibition of the degradative enzyme neprilysin has shown clinical efficacy but is complicated by consequences of simultaneous accumulation of a heterogeneous array of other hormones. Targets for specific ANP enhancement have not been available. Here, we describe a cis-acting antisense transcript (NPPA-AS1), which negatively regulates ANP expression in human cardiomyocytes. We show that NPPA-AS1 regulates ANP expression via facilitating NPPA repressor RE1-silencing transcription factor (REST) binding to its promoter, rather than forming an RNA duplex with ANP mRNA. Expression of ANP mRNA and NPPA-AS1 was increased and correlated in isolated strained human cardiomyocytes and in hearts from patients with advanced heart failure. Further, inhibition of NPPA-AS1 in vitro and in vivo resulted in increased myocardial expression of ANP, increased circulating ANP, increased renal cGMP, and lower blood pressure. The effects of NPPA-AS1 inhibition on NPPA expression in human cardiomyocytes were further marked under cell-strain conditions. Collectively, these results implicate the antisense transcript NPPA-AS1 as part of a physiologic self-regulatory ANP circuit and a viable target for specific ANP augmentation.

Keywords: Cardiology; Heart failure; Noncoding RNAs; Transcription.


Conflict of interest statement

Conflict of interest: The authors have declared that no conflict of interest exists.

Figures

Figure 1
Figure 1. Tissue distribution of NPPA-AS1.
(A) Schematic overview of the NPPA/NPPA-AS1 locus. Arrows indicate direction of transcription. Chromosomal position is indicated at the top (GRCh37/hg19 genome assembly). Expression of NPPA-AS1 (B) and NPPA (C) across 53 different human tissues based on RNA-Seq data from the GTEx database (v. 7). Cardiac tissues are highlighted. TPM, transcripts per million reads. (D) Expression of NPPA and NPPA-AS1 in left ventricular (LV, n = 22) and left atrial (LA, n = 101) tissue based on RNA-Seq data from the Myocardial Applied Genomics Network. FPKM, fragments per kilobase million.
Figure 2
Figure 2. Cellular and subcellular localization of NPPA-AS1.
(A) NPPA-AS1 and NPPA expression in cardiac cells assessed with qRT-PCR. Results are expressed relative to GAPDH. hCM, human primary cardiomyocytes, n = 3; hcFB, human cardiac fibroblasts, n = 3; hcMVEC, human cardiac microvascular endothelial cells, n = 2. N/D, not detected. (B) NPPA-AS1 and NPPA mRNA levels in nuclear (NUC) and cytoplasmic (CYT) RNA extracts from iPS-CMs measured by qRT-PCR. Results are expressed relative to GAPDH in each fraction. (C) Fluorescence in situ hybridization of NPPA-AS1 (red) in iPS-CMs. Cells were stained with Alexa Fluor 488–conjugated phalloidin (green) and nuclei were counterstained with DAPI (blue). Original magnification, ×20. The proportion of cells with nuclear and cytoplasmic FISH foci was quantified in cells transfected with siRNA specific for NPPA-AS1 or negative control siRNA. A total of 41 random cell-containing visual fields were analyzed. ***P < 0.01 by Mann-Whitney U test. (D) NPPA-AS1 and NPPA levels in nuclear fractions from iPS-CMs measured by qRT-PCR. CHE, chromatin-enriched; SOL, soluble. Results are expressed relative to 18S RNA.
Figure 3
Figure 3. NPPA-AS1 inhibits NPPA expression.
iPS-CMs were transfected with scrambled negative control siRNA (siScr) or siRNA targeting NPPA-AS1 (siNPPA-AS1) for 48 hours. NPPA-AS1 and NPPA mRNA expression relative to GAPDH and normalized to the mean of the control cells in iPS-CMs was measured by qRT-PCR. Results are based on 3 separate experiments with 3–4 replicates per group. Mean and standard deviation are shown. ***P < 0.01 by Mann-Whitney U test.
Figure 4
Figure 4. NPPA-AS1 does not form a duplex with NPPA mRNA.
Chromatin isolation by RNA purification (ChIRP) in human cardiac tissue (n = 2). qRT-PCR quantification of NPPA in RNA coprecipitated with 2 independent ChIRP probe sets specific for NPPA-AS1 (“Even” and “Odd”). NPPA-AS1 and GAPDH mRNA was quantified as positive and negative controls, respectively. Results are expressed relative to input RNA.
Figure 5
Figure 5. NPPA-AS1 facilitates binding of the repressive transcription factor REST to the NPPA promoter.
(A) Schematic overview of the genomic region 1 kb upstream of the NPPA transcription start site (GRCh37/hg19 assembly). Indicated are the positions of the ChIRP primer pairs A–F. ENCODE ChIP-Seq transcription factor binding sites and DNase I hypersensitivity clusters are also indicated. The darkness of gray boxes is proportional to the maximum signal strength in the ENCODE v3 database. (B) qRT-PCR analysis of human atrial DNA coprecipitated with 2 independent ChIRP probe sets specific for NPPA-AS1 (“Even” and “Odd”). N/D, not detected. (C) Dot blots for protein coprecipitated with probes specific for NPPA-AS1. See complete unedited blots in the supplemental material. (D) Depiction of the noncanonical REST motif in the NPPA promoter and its overlap with region E. Indicated are the 2 half-sites and linker sequence as proposed by Johnson et al. (21). (E) REST ChIP-qPCR in iPS-CMs across the NPPA promoter. The GAPDH promoter was included as a negative control. The ChIP signal is expressed normalized to the negative control IgG ChIP for each region. The Kruskal-Wallis test was used to compare the ChIP signal for each individual region with the signal for the negative control (GAPDH) region. *P < 0.05, **P < 0.01 after adjustments for multiple comparisons using Dunn’s test. (F) REST ChIP-qPCR of iPS-CMs transfected with siRNA specific for REST, NPPA-AS1, or negative control siRNA, examining REST occupancy across regions C–F of the NPPA promoter. The ChIP signal is expressed relative to input DNA. *Two-way ANOVA was used to test the effect of each siRNA treatment on ChIP signal across all regions compared to negative control siRNA. REST occupancy was decreased with siREST and siNPPA-AS1 compared with negative control siRNA, P < 0.05 and P < 0.01, respectively. (G) qRT-PCR quantification of REST and NPPA expression in iPS-CMs transfected with siRNA specific for REST. Results are expressed relative to GAPDH and normalized to the mean of the control group. **P < 0.01, ***P < 0.001 using the Mann-Whitney U test. (H) Promoter reporter assay signals in cells cotransfected with pGLuc-NPPA or pGLuc-NPPAΔREST and siREST or siNPPA-AS1. Two-way ANOVA was used to test differences within and between groups. *P < 0.05, **P < 0.01, ***P < 0.001 after adjusting for multiple comparisons using Tukey’s test. For all graphs, mean and standard deviation are shown. All results are based on at least 2 separate experiments with 2–6 replicates for each condition or treatment group.
Figure 6
Figure 6. Tethering of NPPA-AS1 to chromatin is RNA polymerase II dependent.
(A) Assessment of the amount of chromatin-enriched NPPA-AS1 in response to DRB treatment. HEK293 cells were treated with 100 μM DRB or vehicle control for 2 hours and chromatin-enriched RNA was prepared using nuclear fractionation. Expression of NPPA-AS1, HOTTIP, and XIST was assessed using qRT-PCR. Data are expressed relative to 18S RNA and normalized to the mean of the control group. Results are based on 2 separate experiments with 3 replicates in each group. *P < 0.05, **P < 0.01 comparing expression between control and DRB-treated cells using the Mann-Whitney U test. Mean and standard deviation are shown. (B) Overview of the positions of each primer pair assessment of RNA polymerase II occupancy across the NPPA-AS1 promoter and gene body for ChIP-qPCR (GRCh37/hg19 assembly). (C) RNA polymerase II and negative control IgG ChIP signal for each genomic region in iPS-CMs. The signal is expressed relative to the DNA input sample. GB, gene body. Data are from 2 separate experiments with 2 technical replicates.
Figure 7
Figure 7. Mechanical strain increases NPPA and NPPA-AS1 expression in cardiomyocytes.
(A) Overview of the setup and design of the strain experiment. (B) NPPA and NPPA-AS1 expression during the time course of the experiment quantified by qRT-PCR. Expression is presented relative to GAPDH and normalized to the mean of the cells at time point 0 hours. Results are based on 3 separate experiments with 3 replicates in each group. Mean and standard deviation are shown. The Kruskal-Wallis test was used to test the difference in expression between baseline and each time point. *P < 0.05, ***P < 0.001 after adjustment for multiple comparisons using Dunn’s test. (C) Protein levels of ANP at baseline and after 48 hours of stretch. Results are expressed relative to GAPDH protein levels. Data are from 2 separate experiments with 3–4 replicates in each group. Shown are mean and standard deviation in each group. *P < 0.05 by Mann-Whitney U test. Shown below are representative blots for NPPA and GAPDH. US, unstretched; S, stretched. See complete unedited blots in the supplemental material. (D) NPPA expression in iPS-CMs first transfected with siRNA against NPPA-AS1 and then subjected to 48 hours of stretch. Two-way ANOVA with Tukey’s multiple-comparisons test was used to test differences within and between groups.*P < 0.05, **P < 0.01, ***P < 0.001. (E) RNA-Seq expression data for NPPA and NPPA-AS1 in ventricular tissue from heart failure patients (n = 42) and unused donor hearts (n = 22). ***P < 0.001 by Mann Whitney U test. (F) Correlation of NPPA and NPPA-AS1 in left ventricle and left atrium from heart failure and nonfailure donors. Pearson’s correlation coefficient and P value are shown.
Figure 8
Figure 8. Knockdown of Nppa-as increases Nppa levels in vitro and in vivo.
(A) Schematic overview of the Nppa locus, including the natural antisense transcript Gm13054 on chromosome 4 (GRCm38/mm10 assembly). Arrows indicate direction of transcription. (B) Nppa-as and (C) Nppa expression in HL-1 cells transfected with different GapmeR designs and negative control, as measured by qRT-PCR. Expression is presented relative to Gapdh and normalized to the mean of the control group. Results are based on 3 separate experiments with 3 replicates in each group. Kruskal-Wallis was used to test the effect of each GapmeR design compared to the negative control. ***P < 0.001, **P < 0.01 after adjustment for multiple comparisons using Dunn’s test. (D) Nppa-as and (E) Nppa expression in atrial tissue of mice injected subcutaneously with 6.25, 12.5, or 25 mg/kg of GapmeR5 or 25 mg/kg of negative control GapmeR for 48 hours (n = 5–13 per group). Kruskal-Wallis was used to test the difference between animals treated with negative control and each of the G5 doses, as well as within G5 treatment groups. ***P < 0.001, *P < 0.05 after adjusting for multiple comparisons using Dunn’s test. (F) Plasma concentration of Anp in the saphenous vein of mice before and 48 hours after injection of the different Gapmer5 doses or 25 mg/kg of negative control GapmeR, as measured by ELISA (n = 5–13 per group). Repeated-measures 2-way ANOVA was used to test the difference before and after treatment in each group. *P < 0.05, **P < 0.01 after adjusting for multiple comparisons using Dunn’s test. (G) Systolic (SBP) and diastolic blood pressure (DBP) in mice before and 48 hours after GapmeR injections measured using a noninvasive tail cuff method (n = 5/group). Repeated-measures 2-way ANOVA was used to test for differences within groups. *P < 0.05 after adjusting for multiple comparisons using Dunn’s test. (H) Correlation of G5 dose with SBP and DBP in treated animals. Pearson’s correlation coefficient and P value are shown. (I) Kidney cGMP in each treatment group (n = 5/group) as measured by ELISA. Kruskal-Wallis was used to test the effect of each of the G5 doses compared to negative control GapmeR. *P < 0.05 after adjustment for multiple comparisons using Dunn’s test. For all graphs, mean and standard deviation are shown.

Similar articles

Cited by

References

    1. de Bold AJ, Borenstein HB, Veress AT, Sonnenberg H. A rapid and potent natriuretic response to intravenous injection of atrial myocardial extract in rats. Life Sci. 1981;28(1):89–94. doi: 10.1016/0024-3205(81)90370-2. - DOI - PubMed
    1. Potter LR, Yoder AR, Flora DR, Antos LK, Dickey DM. Natriuretic peptides: their structures, receptors, physiologic functions and therapeutic applications. Handb Exp Pharmacol. 2009;(191):341–366. - PMC - PubMed
    1. McMurray JJ, et al. Angiotensin-neprilysin inhibition versus enalapril in heart failure. N Engl J Med. 2014;371(11):993–1004. doi: 10.1056/NEJMoa1409077. - DOI - PubMed
    1. Chrysant SG. Benefits and pitfalls of sacubitril/valsartan treatment in patients with hypertension. J Clin Hypertens (Greenwich) 2018;20(2):351–355. doi: 10.1111/jch.13169. - DOI - PMC - PubMed
    1. Sergeeva IA, Christoffels VM. Regulation of expression of atrial and brain natriuretic peptide, biomarkers for heart development and disease. Biochim Biophys Acta. 2013;1832(12):2403–2413. - PubMed

Publication types