. 2019 Dec 2;129(12):5261-5277.
doi: 10.1172/JCI127721.

Myeloid loss of Beclin 1 promotes PD-L1hi precursor B cell lymphoma development

Affiliations

Myeloid loss of Beclin 1 promotes PD-L1hi precursor B cell lymphoma development

Peng Tan et al. J Clin Invest. .

Abstract

Beclin 1 (Becn1) is a key molecule in the autophagy pathway and has been implicated in cancer development. Due to the embryonic lethality of homozygous Becn1-deficient mice, the precise mechanisms and cell type-specific roles of Becn1 in regulating inflammation and cancer immunity remain elusive. Here, we report that myeloid-deficient Becn1 (Becn1ΔM) mice developed neutrophilia, were hypersusceptible to LPS-induced septic shock, and had a high risk of developing spontaneous precursor B cell (pre-B cell) lymphoma with elevated expression of immunosuppressive molecules programmed death ligand 1 (PD-L1) and IL-10. Becn1 deficiency resulted in the stabilization of MEKK3 and aberrant p38 activation in neutrophils, and mediated neutrophil-B cell interaction through Cxcl9/Cxcr3 chemotaxis. Neutrophil-B cell interplay further led to the activation of IL-21/STAT3/IRF1 and CD40L/ERK signaling and PD-L1 expression; therefore, it suppressed CD8+ T cell function. Ablation of p38 in Becn1ΔM mice prevented neutrophil inflammation and B cell tumorigenesis. Importantly, the low expression of Becn1 in human neutrophils was significantly correlated with the PD-L1 levels in pre-B acute lymphoblastic lymphoma (ALL) patients. Our findings have identified myeloid Becn1 as a key regulator of cancer immunity and therapeutic target for pre-B cell lymphomas.

Keywords: B cells; Cellular immune response; Immunology; Neutrophils; Oncology.


Conflict of interest statement

Conflict of interest: The authors have declared that no conflict of interest exists.

Figures

Figure 1
Figure 1. Characterization and phenotypic analysis of Becn1ΔM mice.
(A) SP size comparison between WT and Becn1ΔM mice and SP/ body weight ratio (n = 4). H&E staining of SP sections from WT and Becn1ΔM mice. Scale bars: 500 μm. (B) Lymphadenopathy in Becn1ΔM mice compared with WT control. Inguinal (i), axillary (ii), and mesenteric (iii) LNs were examined. Data are representative of 3 independent experiments with 6- to 8-week-old mice (n = 2) in each group. (C) Total number of splenic CD45+CD11c+ DCs, CD4+ T cells, CD8+ T cells, B220+ B cells, CD11b+F4/80+ macrophages, and CD11b+Ly6G+ neutrophils from WT and Becn1ΔM mice (n = 4). (D and E) Representative flow cytometry plots and statistical analysis of Gr-1+CD11b+ myeloid cells, Ly6G+CD11b+ neutrophils, and F4/80+CD11b+ macrophages in BM (D) and SP (E) of WT and Becn1ΔM mice (n = 5). (F and G) Representative flow cytometry plots and statistical analysis of monocytic (Ly6ChiLy6G) and granulocytic (Ly6CintLy6G+) cells in BM (F) and SP (G) of 6-to 8-week-old WT and Becn1ΔM mice (n = 5). Data represented in A and CG were from 6- to 8-week-old mice and are presented as box plots, with lines representing median and error bars showing mean ± SEM. Statistical differences between groups were calculated using Student’s unpaired t test. *P < 0.05; **P < 0.01.
Figure 2
Figure 2. Cell type–specific regulation of Becn1 in proinflammatory signaling pathways and immune responses.
(A and B) Neu (A) or pMAC (B) from the periphery of WT and Becn1ΔM mice were treated with LPS for the indicated time points, followed by IB with indicated antibodies. (C) ELISA measurement of TNF-α, IL-6, and IL-1β production by Neu and pMAC of WT and Becn1ΔM mice treated with 100 ng/ml LPS for indicated time points (n = 4). (D) IB of pro–IL-1β expression in Neu or pMAC from WT and Becn1ΔM mice. (E) Survival of WT and Becn1ΔM mice (n = 10; female) treated with high-dose LPS (30 mg/kg, i.p.). (F) Plasma concentrations of TNF-α, IL-6, and IL-1β in WT or Becn1ΔM mice (n = 5) at indicated time points after LPS treatment. (G) Survival of WT and Becn1ΔM mice (n = 4; female) treated with PBS- or clodronate-containing liposomes to deplete macrophages or with anti-Ly6G antibody (1A8) to deplete neutrophils, followed by high-dose LPS treatment. (H) Heatmap representation of differential expressed genes in neutrophils isolated from Becn1ΔM mice compared with WT controls: neutrophil-mediated immunity and IL-17–related cytokines (purple), chemokine receptor and neutrophil-chemotaxis (green), cell metabolism (blue). Data shown in A, B, and D are representative of 3 independent experiments with 6- to 8-week-old mice (n = 3; female) in each group. Statistical differences between groups were calculated using Student’s unpaired t test (mean ± SEM) (C and F) and Mantel-Cox log-rank test (E and G). *P < 0.05; **P < 0.01; ***P < 0.001.
Figure 3
Figure 3. Becn1 ablation suppresses proteasomal degradation of neutrophil MEKK3 upstream of p38.
(A and B) Screening of Becn1 binding proteins in NF-κB and MAPK pathways in 293T cells. WCL, whole-cell lysate. (C) 293T cells transfected with 100 ng HA-MEKK3 along with increased amounts (0, 100, 250, and 500 ng) of FLAG-Becn1, followed by IB with indicated antibodies. (D) IB of MEKK3 protein expression in Becn1-deficient Neu and pMAC compared with WT controls. (E and F) WT or Becn1-deficient neutrophils were treated with LPS for the indicated time points, followed by IB with antibodies against MEKK3, TAK1 or p-p38 (E), and MKK3/6 signaling (F). (G) IB of 293T cells transfected with HA-MEKK3 along with empty vector or FLAG-Becn1 left untreated or treated with proteasome inhibitor MG132 (1 μM) or autophagy inhibitors 3-MA (5 mM) or CQ (10 μM). (H) IB of 293T cells transfected with WT or HA-MEKK3 (K69R, K79R, K174R, K273R, K299R, K397R, K435R) along with empty vector or FLAG-Becn1. (I) 293T cells were transfected with FLAG-MEKK3 WT or FLAG-MEKK3 K299R along with GFP-Becn1 and HA-ubiquitin K48 expression vectors, followed by immunoprecipitation with FLAG beads and IB with indicated antibodies. Data are representative of 3 independent experiments in 293T cells (AC and GI) and with 6- to 8-week old mice (n = 3; female) (DF).
Figure 4
Figure 4. p38 or MEKK3 ablation restores Becn1ΔM mouse phenotype so that it is similar to WT.
(A) SP size (left) and SP/body weight ratio (right) isolated from WT, Becn1ΔM, and Becn1ΔM:Mapk14ΔM mice (n = 4). (B) Representative flow cytometry plots of Gr-1+CD11b+ neutrophils in WT, Becn1ΔM, and Becn1ΔM:Mapk14ΔM mice. (C) ELISA measurement of TNF-α, IL-6, IL-1β, and IL-17A production in serum from WT, Becn1ΔM, and Becn1ΔM:Mapk14ΔM mice treated with high-dose LPS. (D) Survival of WT, Becn1ΔM, Becn1ΔM:Mapk14ΔM, and Becn1ΔM:Il6–/– mice treated with high-dose LPS. (E) Neutrophils isolated from WT, Becn1ΔM, and Becn1ΔM:Map3k3Cas9 mice treated with LPS for the indicated time points, followed by IB with indicated antibody. (F) Representative flow cytometry plots of CD11b+Ly6G+ neutrophils in WT, Becn1ΔM, and Becn1ΔM:Map3k3Cas9 mice. (G) ELISA analysis of TNF-α, IL-1β, and IL-17A production in serum from WT, Becn1ΔM, and Becn1ΔM:Map3k3Cas9 mice treated with high-dose LPS. (H) Survival of WT, Becn1ΔM, and Becn1ΔM:Map3k3Cas9 mice treated with high-dose LPS. Data are representative of 3 independent experiments with 6- to 8-week-old mice (n = 3; female) (BD) and 10- to 12-week-old mice (n = 3; female) (EG). Statistical differences between groups were calculated using 1-way ANOVA with Dunnett’s multiple comparison test (A, C, and G) and Mantel-Cox log-rank test (D and H). *P < 0.05; **P < 0.01.
Figure 5
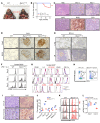
Figure 5. Identification of MHC-IhiB220lo TdT+ pre-B cell lymphoma in Becn1ΔM mice.
(A) Tumor formation in cervical LN (red arrows) in Becn1ΔM mice. T, tumor; SLG, sublingual gland; SMG, submandibular gland. (B) Kaplan-Meier curves for tumor-free animals were calculated based on the tumor latency of the controls (n = 21; 11 females, 10 males; blue) and Becn1ΔM mice (n = 40; 31 females, 9 males; red). (C) IHC staining of tumor sections from Becn1ΔM tumor-bearing mice with indicated antibodies. Scale bars: 500 μm. (D) IHC staining of lung sections stained with B cell markers. T1, low antibody concentration; T2, high antibody concentration. Scale bars: 100 μm. (E) IHC staining of lung sections stained with anti–Bcl-6 (LN follicular B cells as a positive control). Scale bars: 100 μm. (F) FACS analysis of CFSE-labeled (APC-CFSE) B cells treated with LPS and IL-4 at indicated time points. (G) FACS analysis of B cell surface markers. Significant right-shift markers are indicated in red. (H) FACS analysis of cell populations in tumor with indicated antibody. (I) IHC staining of tumor sections with TdT and Ki67 antibodies. Scale bars: 100 μm. (J) FACS and statistical analysis of BM pre–pro B cell (B220+CD43+), pro–B cell (B220+CD43lo), pre-B cell (B220+CD43), immature B cell (B220+CD43IgM+IgD), and mature B cell (B220+CD43IgM+IgD+) populations. (K) FACS analysis of B220+ B cell population in BM, SP, and LN of WT and Becn1ΔM tumor-bearing mice. (L) Quantitative reverse-transcription PCR (qRT-PCR) of S1p1r and Cxcr4 mRNA in B220+ cells from WT (n = 5) and Becn1ΔM tumor-bearing mice (n = 9). Data are presented as box plots, with error bars showing mean ± SEM (J and L) and are representative of 3 independent experiments (n = 3; female) (A, CI, and K). Statistical differences between groups were calculated using Mantel-Cox log-rank test (B) and Student’s unpaired t test (J and L). *P < 0.05; **P < 0.01.
Figure 6
Figure 6. Becn1 deficiency induces B cell helper protumorigenic function of neutrophils.
(A and B) IHC staining or IF of tumor in cLN and lung stained with indicated antibody showing the interaction of B cells with neutrophils (arrows). DAPI, DNA-intercalating dye (nucleus, blue). Scale bars: 25 μm. (C) IHC staining of intestinal Peyer’s patch sections with indicated antibodies (green circle indicates B cell zone; arrowheads indicate neutrophils). Scale bars: 500 μm. Drawing illustrates a strip of neutrophils surrounding the edge of the B cell zone likely to support B cell proliferation and migration. (D) qRT-PCR of B cell helper neutrophil signature genes. (E) ELISA analysis of BAFF and IL-21 production by neutrophils after in vitro culture for 12 hours. IF shows accumulation of Gr-1+CD11b+ neutrophils in the tumor expressing IL-21. Original magnification, ×20. (F) IB of p38 activation in neutrophils from lymphoma (T) and lungs in Becn1ΔM tumor-bearing mice compared with WT controls. N, normal. (G) Fluorescence and statistical analysis of NET formation in neutrophils using SYTOX dye (green). White arrows indicate NETs. Scale bars: 100 μm. (H) IF of tumor section with Ly6G (red) and CXCR3 (green) antibodies compared with WT LN. Scale bars: 25 μm. (I) IHC staining of tumor sections with anti-CXCL9 antibody compared with WT LN. Scale bars: 200 μm. Data are presented as box plots with error bars showing mean ± SEM (D, E, and G) and are representative of 3 independent experiments (n = 3; female) (AC, F, H, and I). Statistical differences between groups were calculated using 1-way ANOVA with Dunnett’s multiple comparison test (D and E) and Student’s unpaired t test (G). *P < 0.05; **P < 0.01.
Figure 7
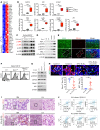
Figure 7. Neutrophil Becn1 levels correlate with PD-L1 in pre-B lymphoma.
(A and B) Heatmap of upregulated genes in B cells with selected genes confirmed by qRT-PCR (n = 4). (C) IB of B220+ cells with indicated antibodies after stimulation with CD40 agonist. (D) IB of B cells with indicated antibodies comparing B220hi and B220lo cells in tumor. (E) IF of tumor sections with anti–PD-L1 (red) and anti-B220 (green). Scale bars: 100 μm. (F) FACS analysis of PD-L1 expression in B cells from WT, Becn1ΔM (T), and Becn1ΔM: Il21Cas9 DKO mice. (G) Immunoblot analysis of B cells from WT, Becn1ΔM, and Becn1ΔM: Il21Cas9 DKO mice with indicated antibodies. (H) IF and statistical analyses of Becn1 expression in MPO+ cells with or without NET formation in pre-B-cell ALL compared with normal controls. Scale bars: 25 μm (normal, n = 6; pre-B-cell ALL, n = 10). Arrows indicate MPO+ neutrophils. (I) IHC of PD-L1 expression in pre-B cell ALL samples (n = 10) compared with normal controls (n = 6). Scale bars: 100 μm. LN, reactive lymphoid hyperplasia. (J) Correlation of IL-21, PD-L1, and neutrophil marker (LY6G6D) in B-cell ALL data set (TARGET). Data are presented as box plots with error bars showing mean ± SEM (B and H) and are representative of 3 independent experiments (n = 3; female) (CG). Statistical analysis using 1-way ANOVA with Dunnett’s multiple comparison test (B) and Student’s unpaired t test (H). *P < 0.05; **P < 0.01; ***P < 0.001.

Comment in

Similar articles

Cited by

References

    1. Lorin S, Hamaï A, Mehrpour M, Codogno P. Autophagy regulation and its role in cancer. Semin Cancer Biol. 2013;23(5):361–379. doi: 10.1016/j.semcancer.2013.06.007. - DOI - PubMed
    1. Deretic V, Saitoh T, Akira S. Autophagy in infection, inflammation and immunity. Nat Rev Immunol. 2013;13(10):722–737. doi: 10.1038/nri3532. - DOI - PMC - PubMed
    1. Qu X, et al. Promotion of tumorigenesis by heterozygous disruption of the beclin 1 autophagy gene. J Clin Invest. 2003;112(12):1809–1820. doi: 10.1172/JCI20039. - DOI - PMC - PubMed
    1. Powell DR, Huttenlocher A. Neutrophils in the tumor microenvironment. Trends Immunol. 2016;37(1):41–52. doi: 10.1016/j.it.2015.11.008. - DOI - PMC - PubMed
    1. Zenaro E, et al. Neutrophils promote Alzheimer’s disease-like pathology and cognitive decline via LFA-1 integrin. Nat Med. 2015;21(8):880–886. doi: 10.1038/nm.3913. - DOI - PubMed

Publication types

MeSH terms