

doi: 10.1364/AO.58.006446.
Creep deformation in elastomeric membranes of liquid-filled tunable-focus lenses
- PMID: 31503794
- PMCID: PMC7409532
- DOI: 10.1364/AO.58.006446
Item in Clipboard
Creep deformation in elastomeric membranes of liquid-filled tunable-focus lenses
Appl Opt.
.
Abstract
Liquid-filled tunable-focus lenses have been demonstrated to be suitable for autofocus eyewear applications. Traditionally, these lenses are constructed using an elastomeric polymer chamber filled with a high-index liquid. In this work, we investigate the effect of elastomeric creep on the deformation and eventual degradation of these tunable lenses. We use numerical analysis of a deformable circular disk representative of the lens and provide rigorous experimental results testing the creep property of a number of elastomers. Finally, we provide a comparative study of different elastomeric materials and select the best one for this application.
Figures
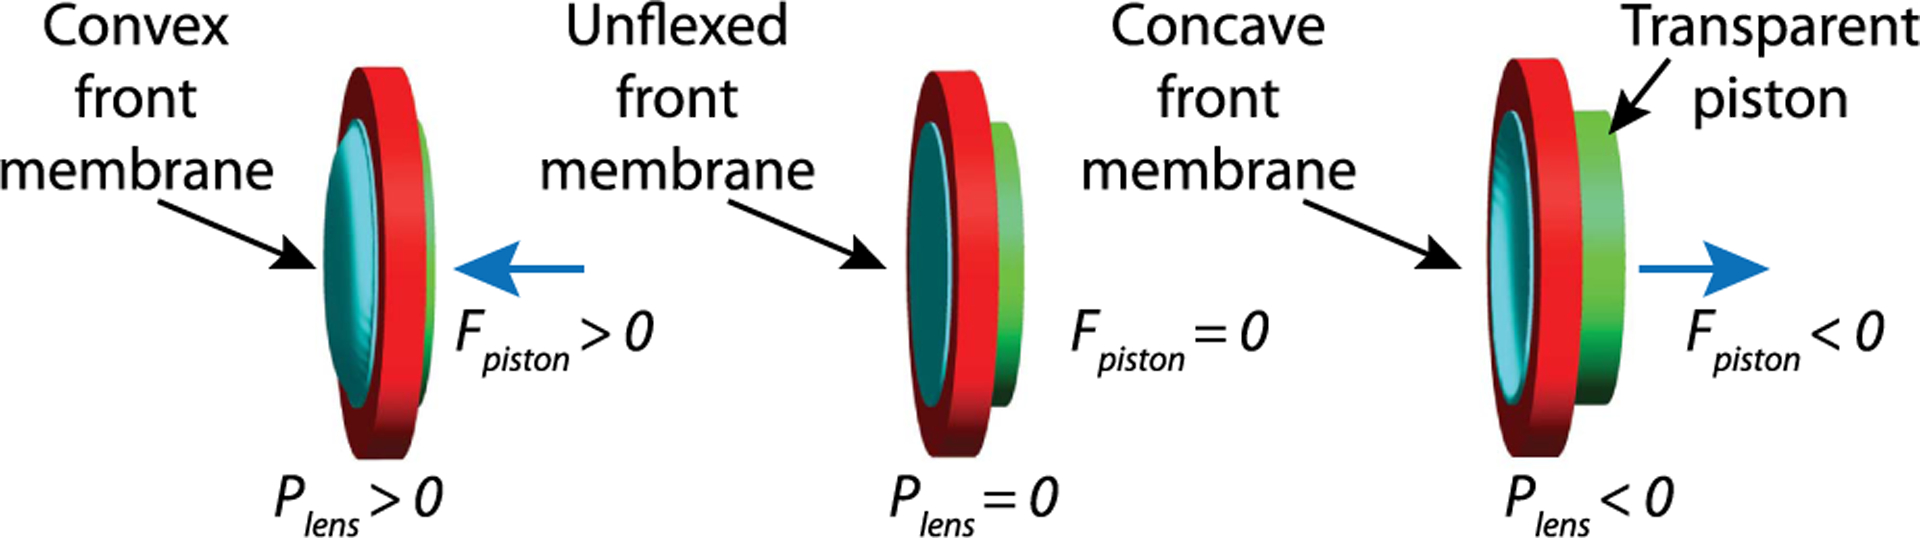
Schematic of tunable-focus liquid-filled lenses excluding the actuators. The actuators connect to the transparent piston and are responsible for imparting the force Fpiston. The change in the radius of curvature of the lens front membrane is responsible for change in the optical power of the lens.
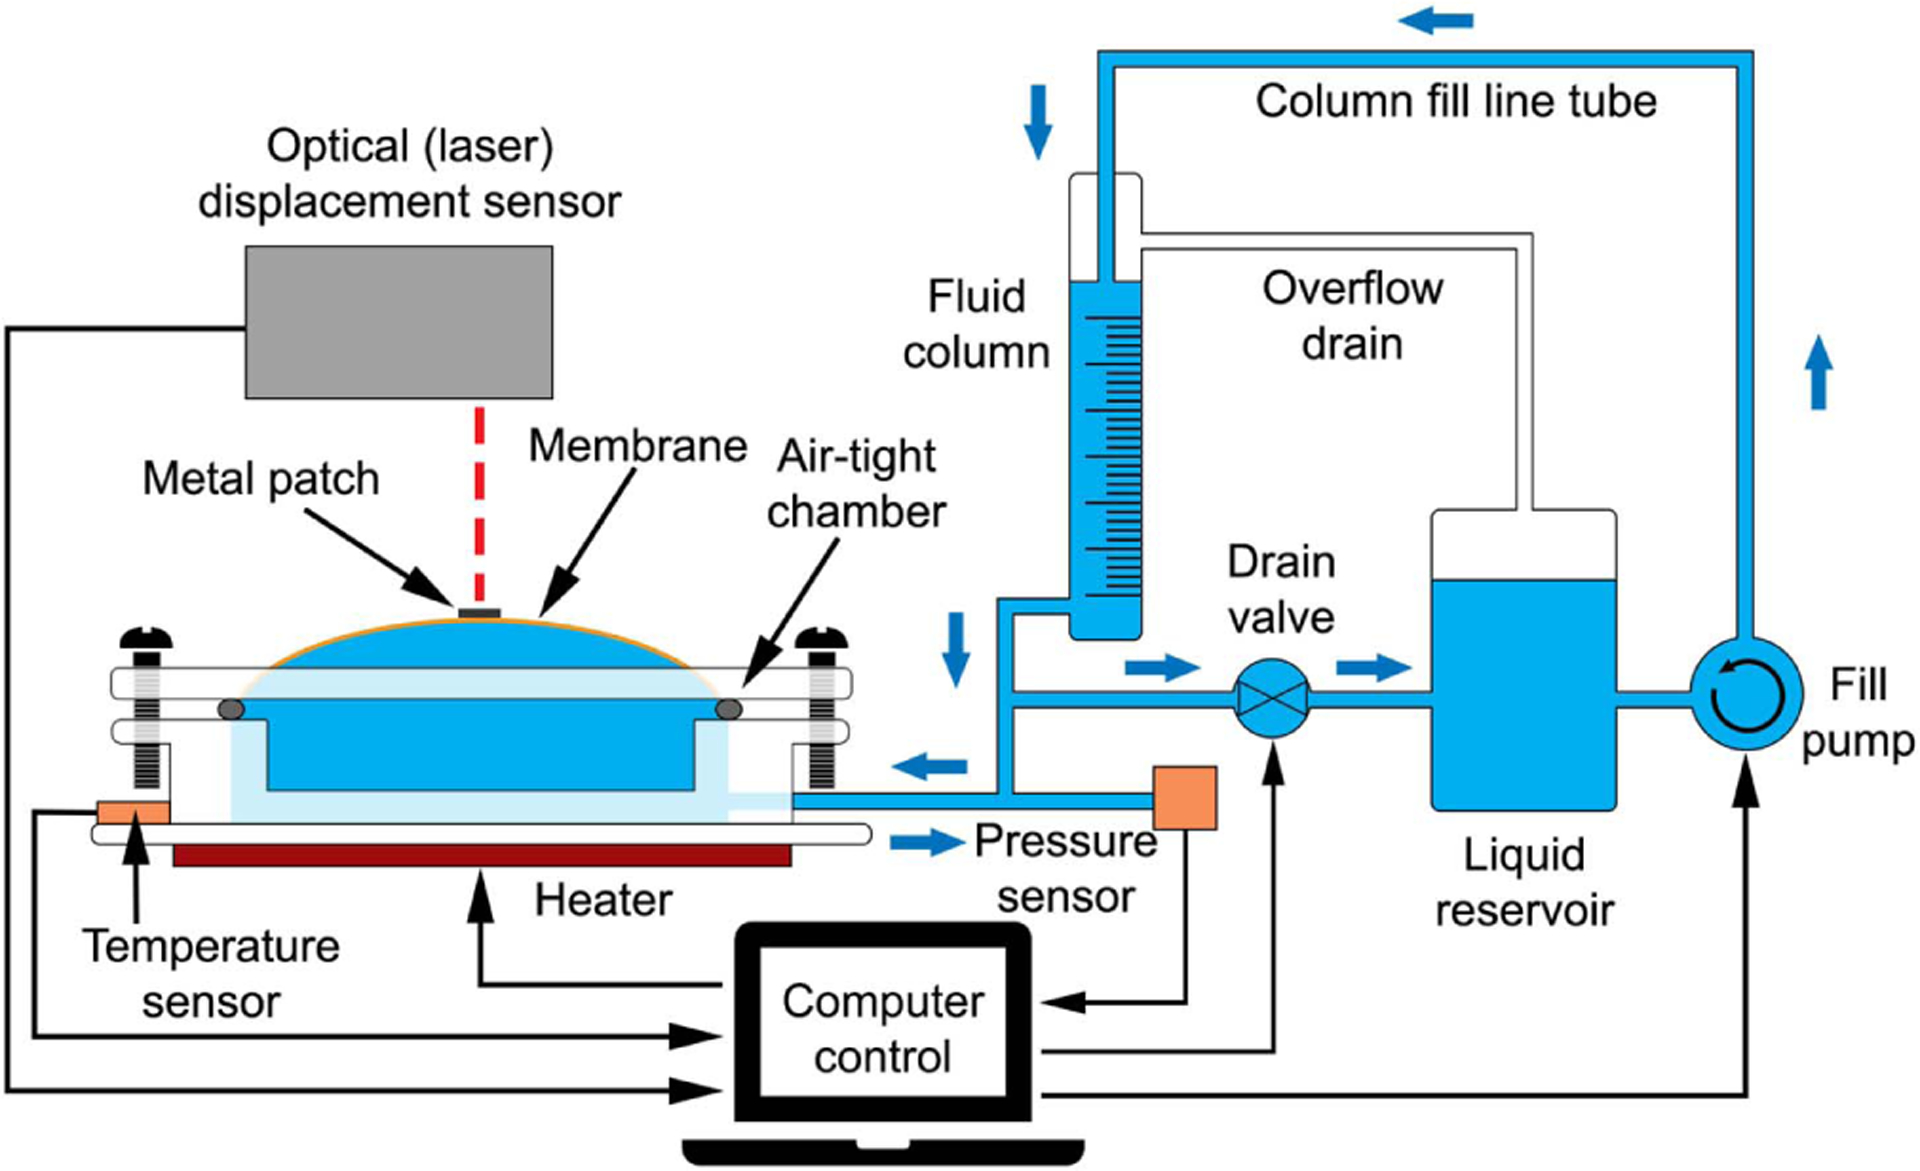
Schematic of the experimental setup used to analyze mechanical properties of membranes for tunable-focus liquid-filled lenses subject to periodic deflections.
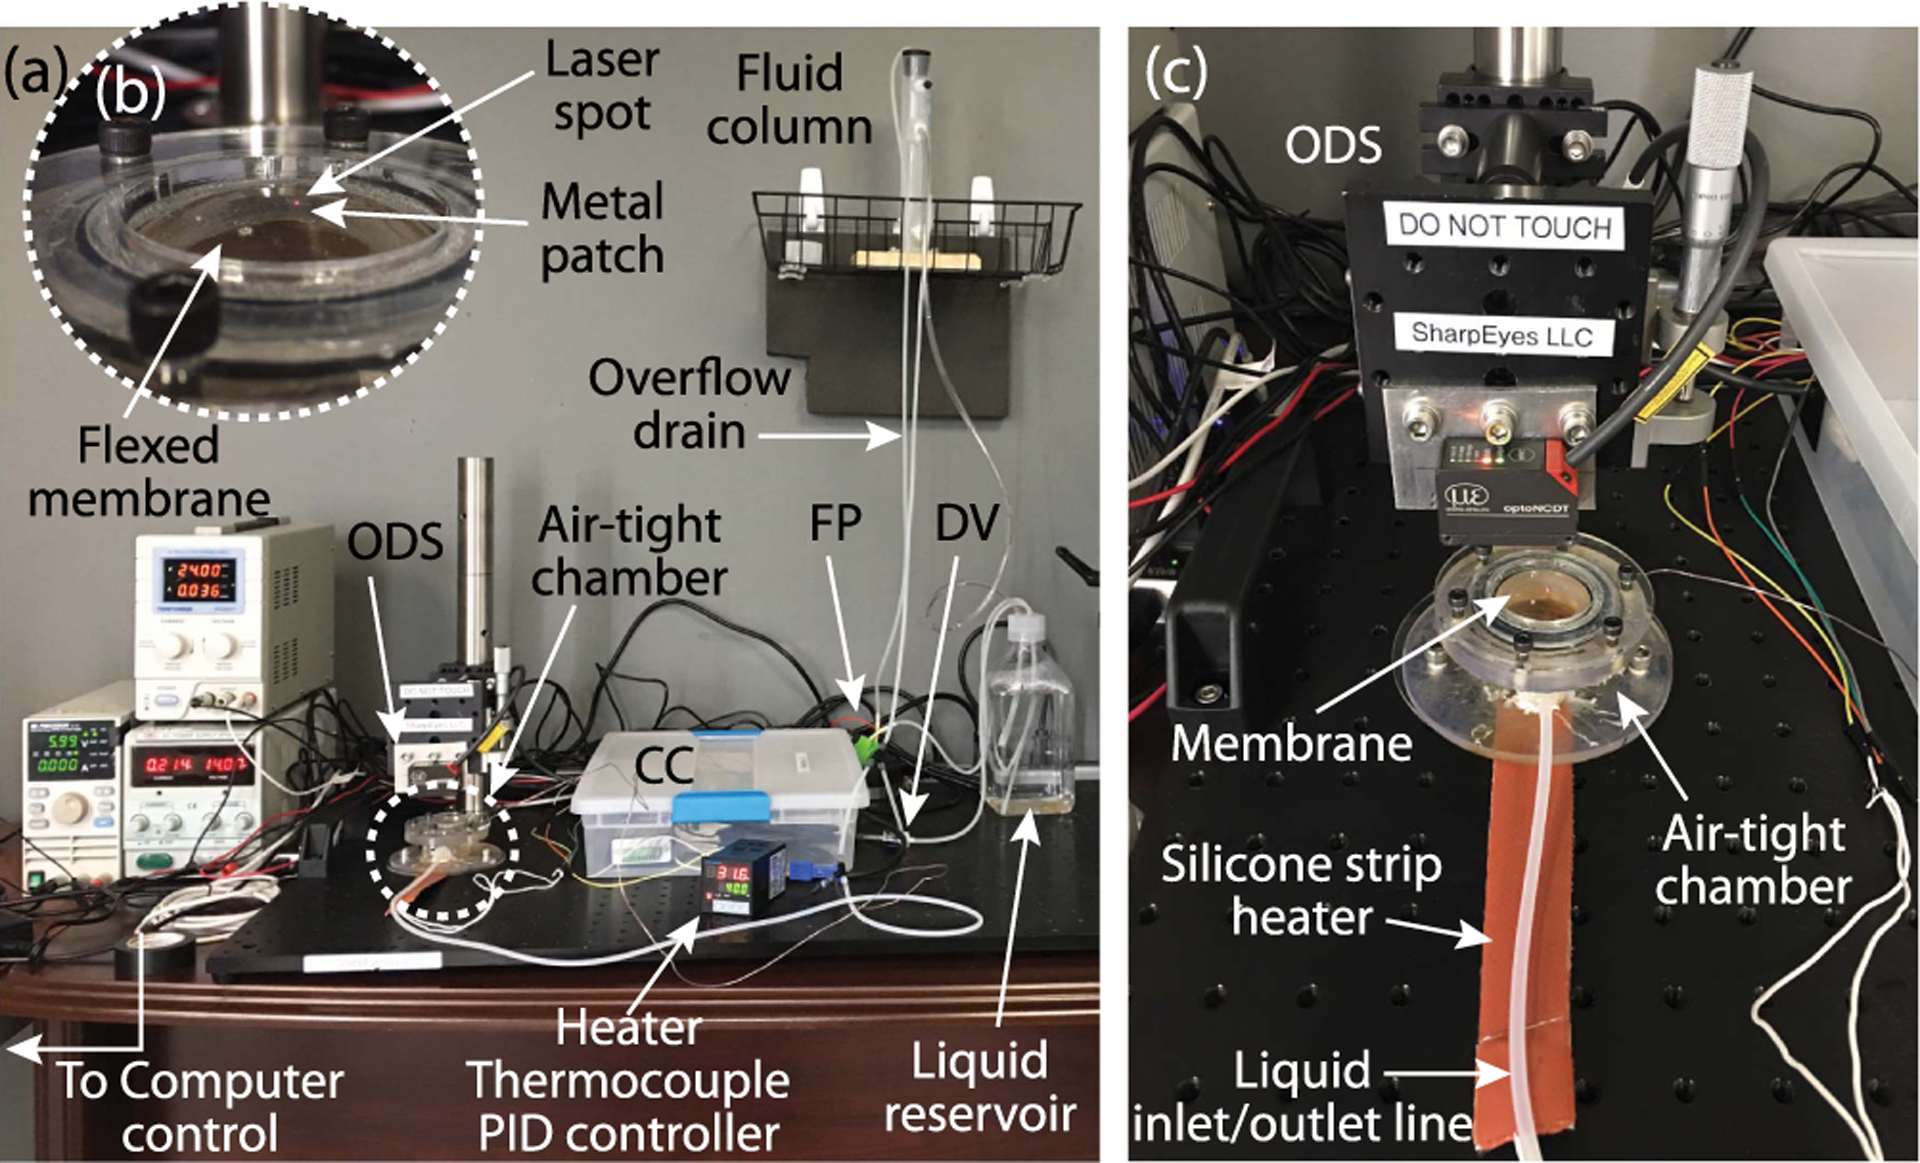
Experimental setup used to analyze mechanical properties of membranes for tunable-focus liquid-filled lenses. (a) Setup showing different components: ODS, optical displacement (laser) sensor; FP, fill pump; DV, drain valve; CC, control circuits. (b) Close-up view of a flexed membrane with a tiny metal patch and laser spot from the optical displacement sensor. (c) Close-up view of the air-tight chamber, heater, and displacement sensor assembly.
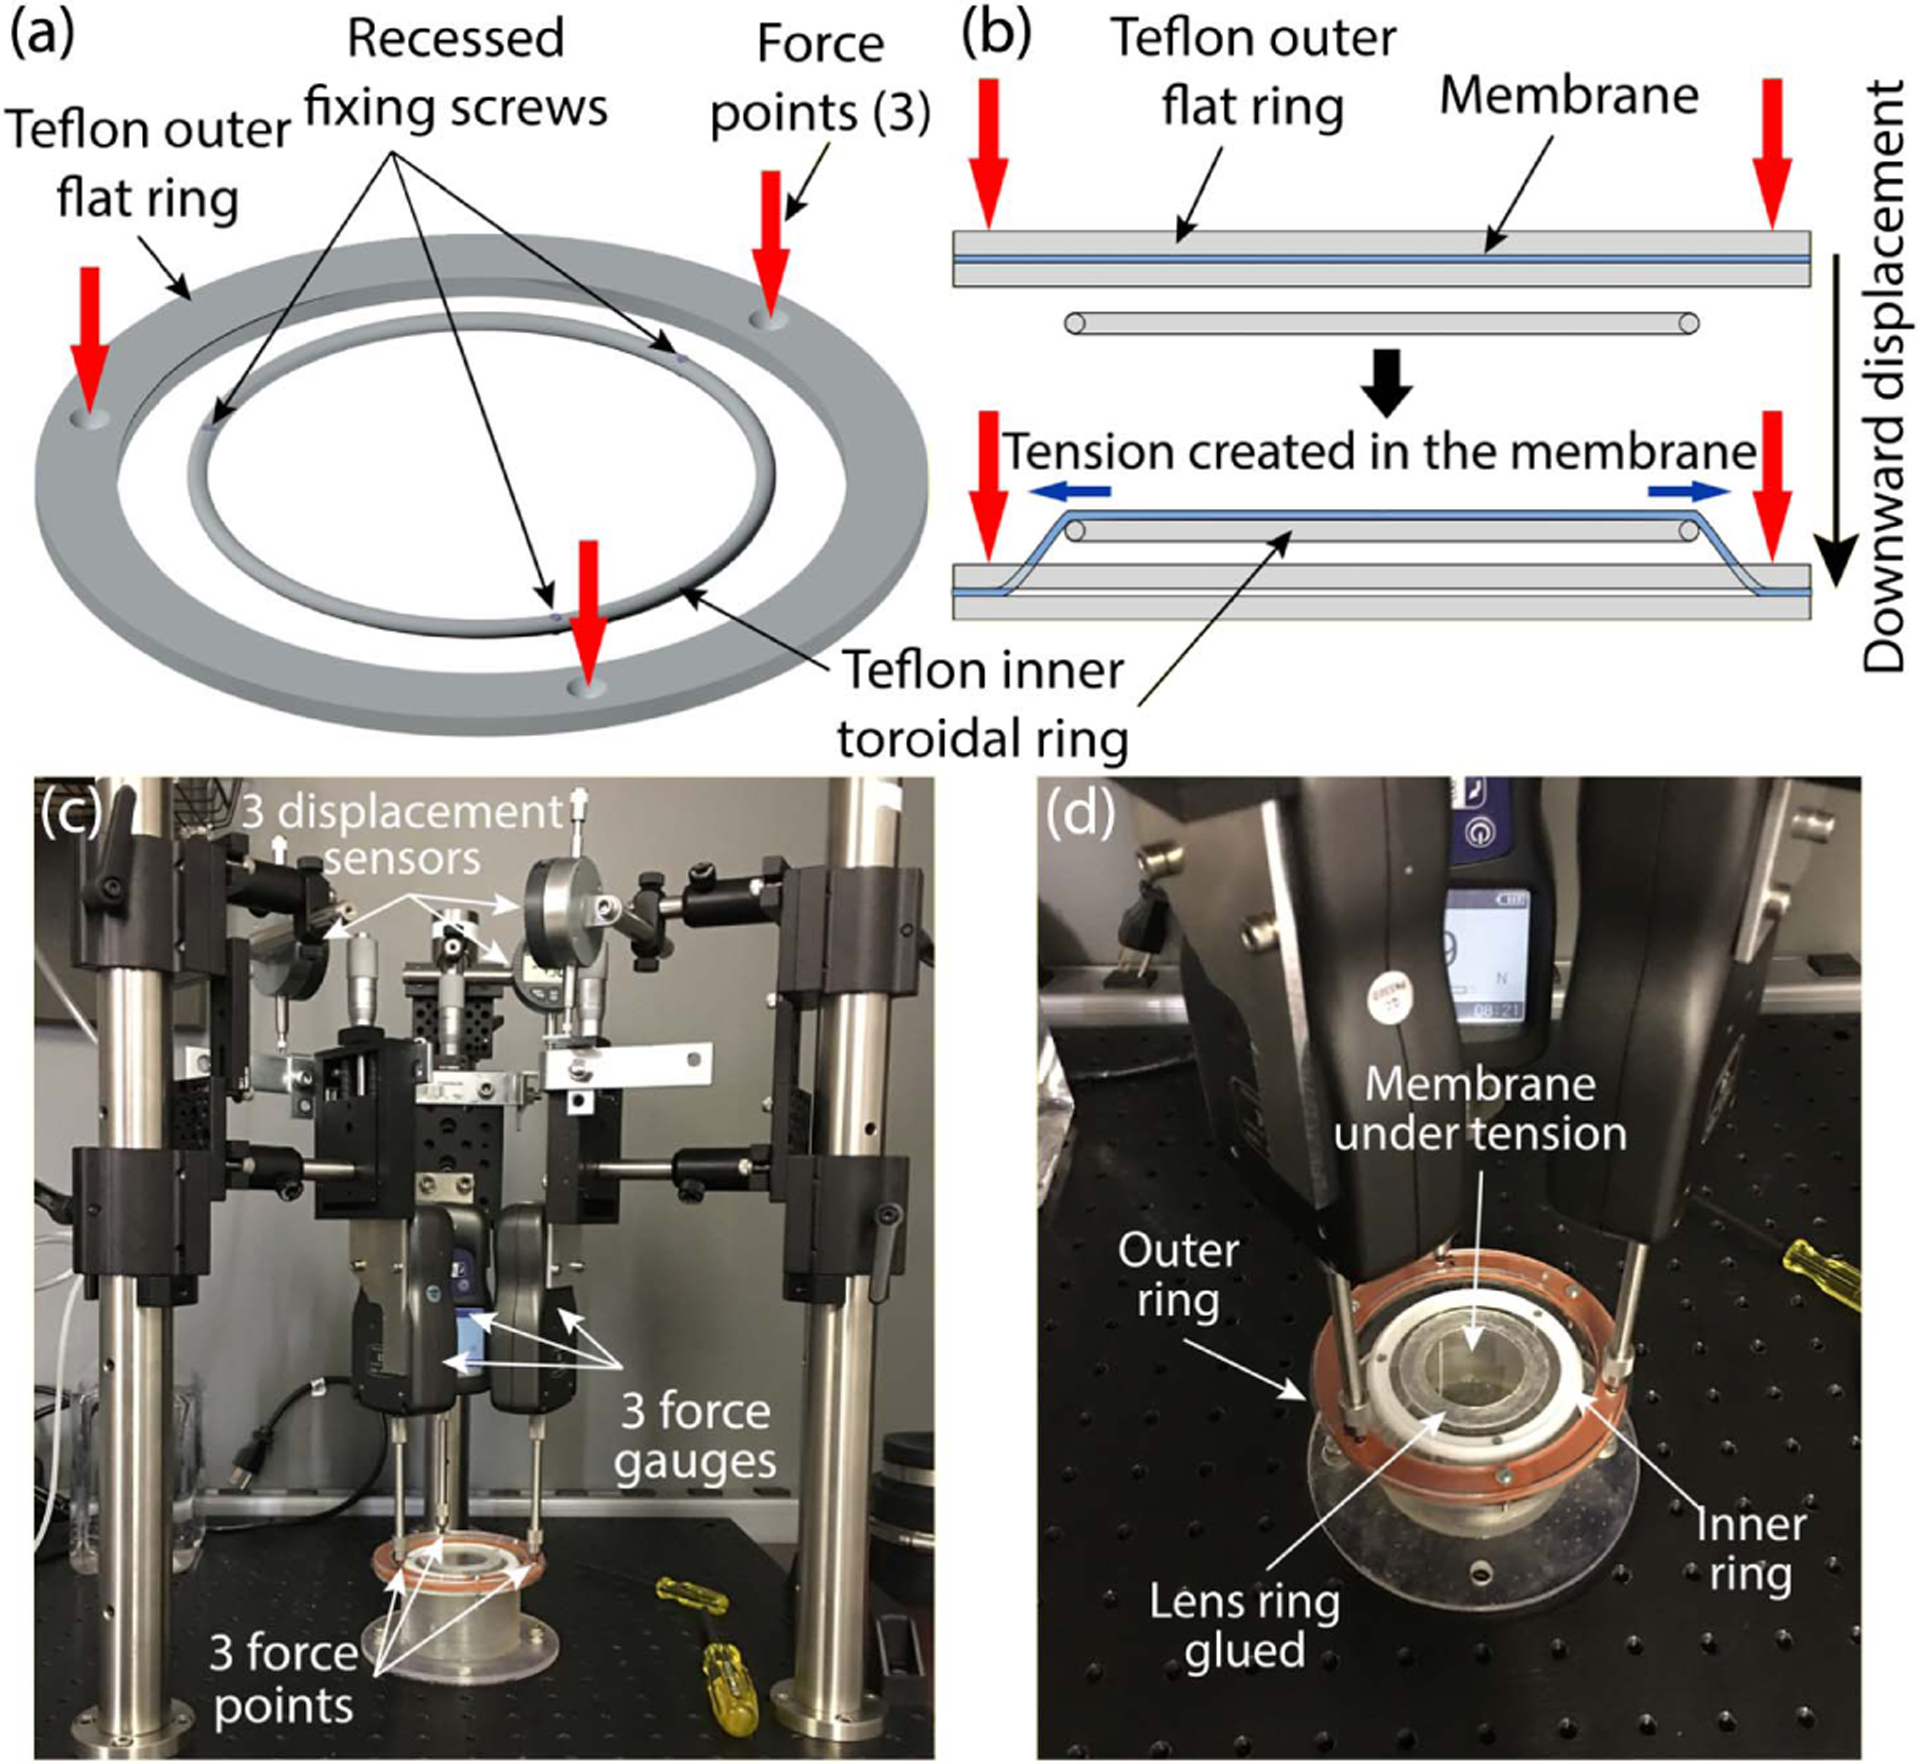
Experimental setup used to introduce tension in elastomeric membranes in a repeatable manner. (a) Schematic showing the two-ring assembly and force points. (b) Schematic showing the introduction of tension in a membrane using this tensor setup. (c) Constructed setup showing the three force gauges and the three displacement gauges with (d) its close-up view showing a Teflon ring glued to a tensed membrane that is then used to transfer the stressed membrane to the flexure setup.
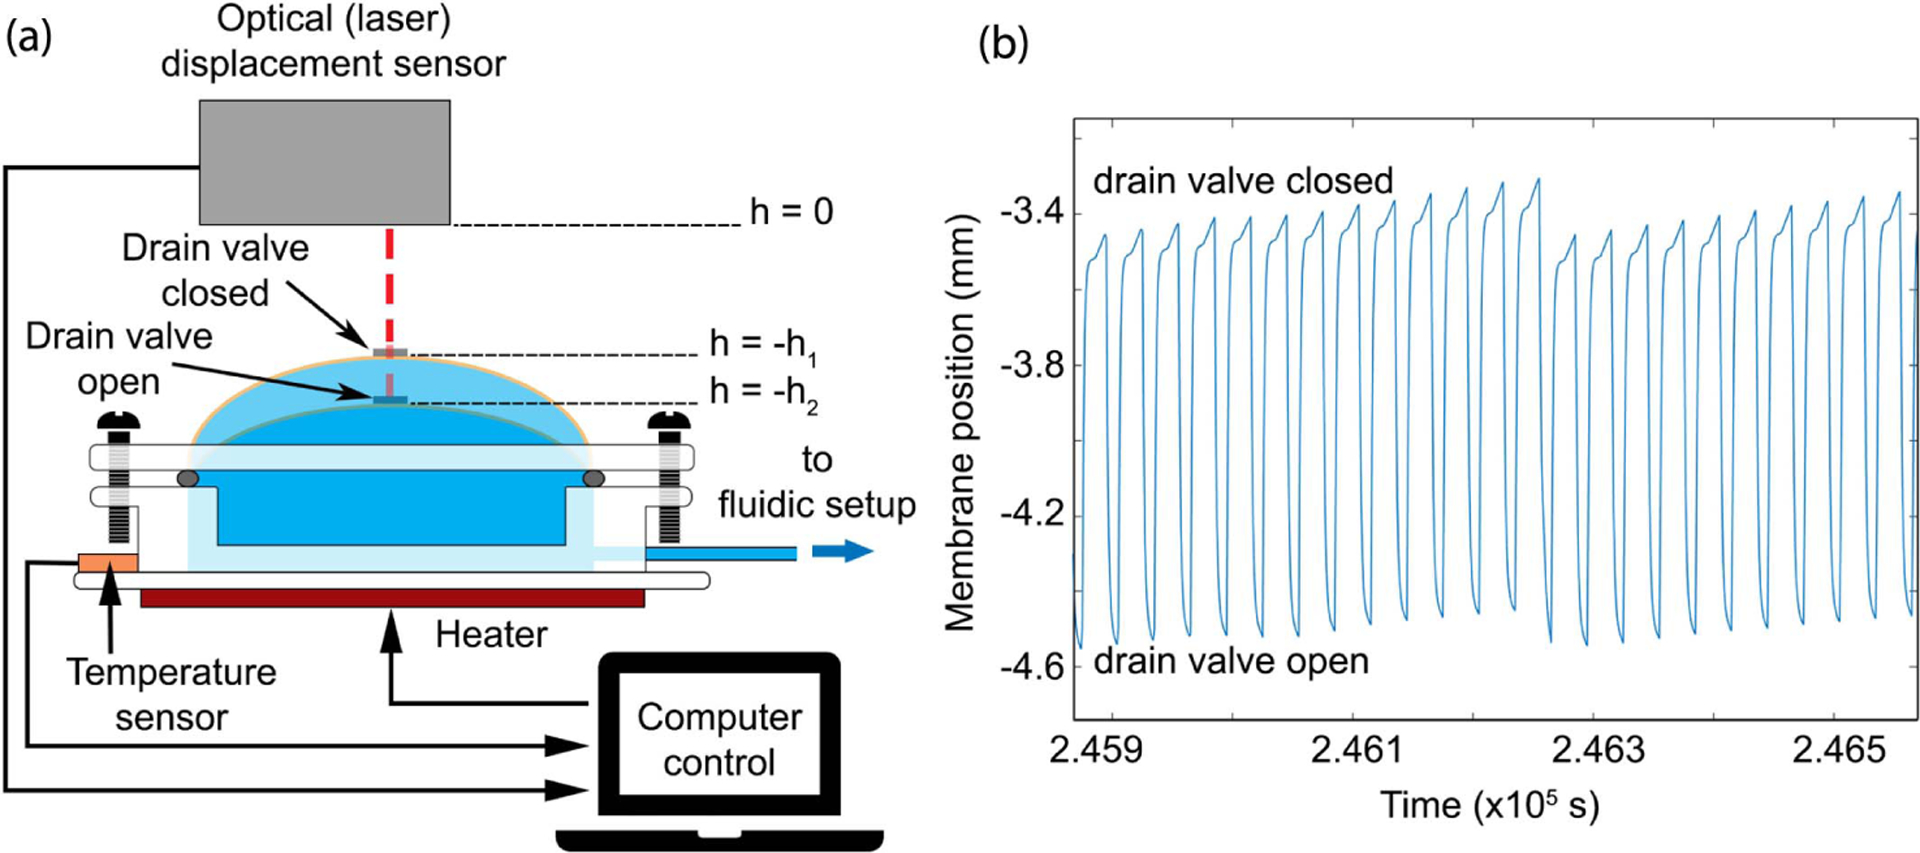
(a) Schematic showing the flexing of the membrane in the periodic fluidic setup. (b) Small data set (~700 s of 3.45 × 10⁵ s) of real-time measurement of the membrane position versus time.
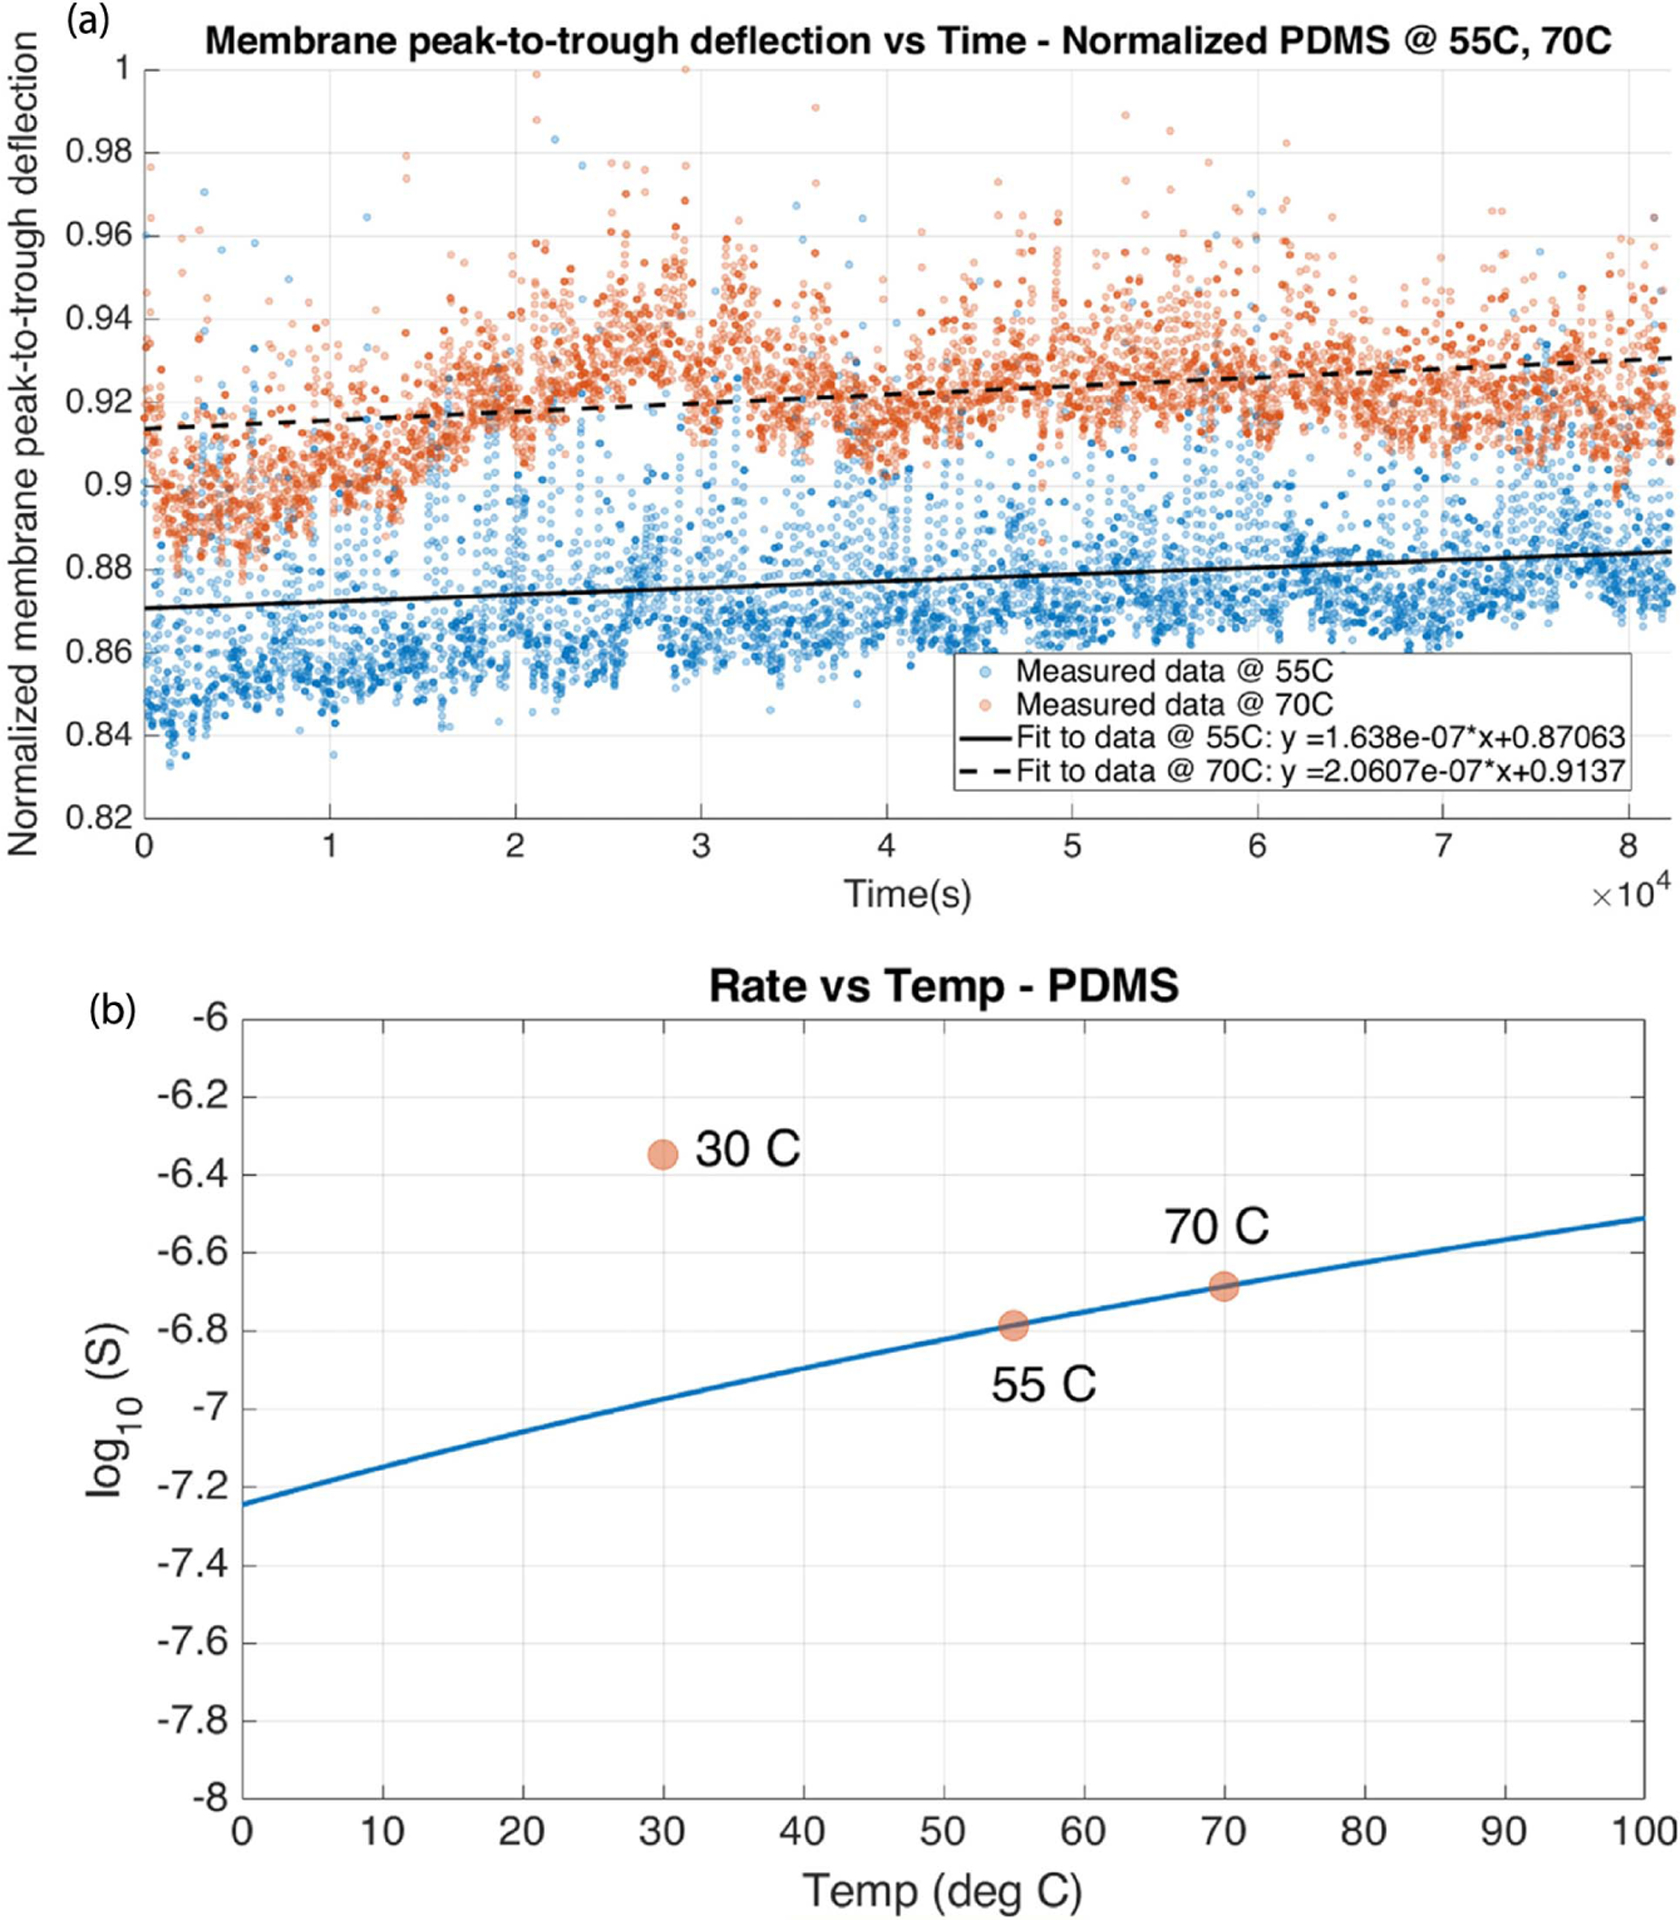
(a) Normalized membrane peak-to-trough deflection v/s time (s) and (b) log10(S)v/s temperature (°C) for nontensed PDMS membrane creep analysis study. The values at 55°C and 70°C were measured first while the membrane creep analysis was being conducted. The value at 30°C was measured by performing an experiment after the analysis was complete. The difference between the predicted value and experimentally measured value at 30°C is 9.866%.
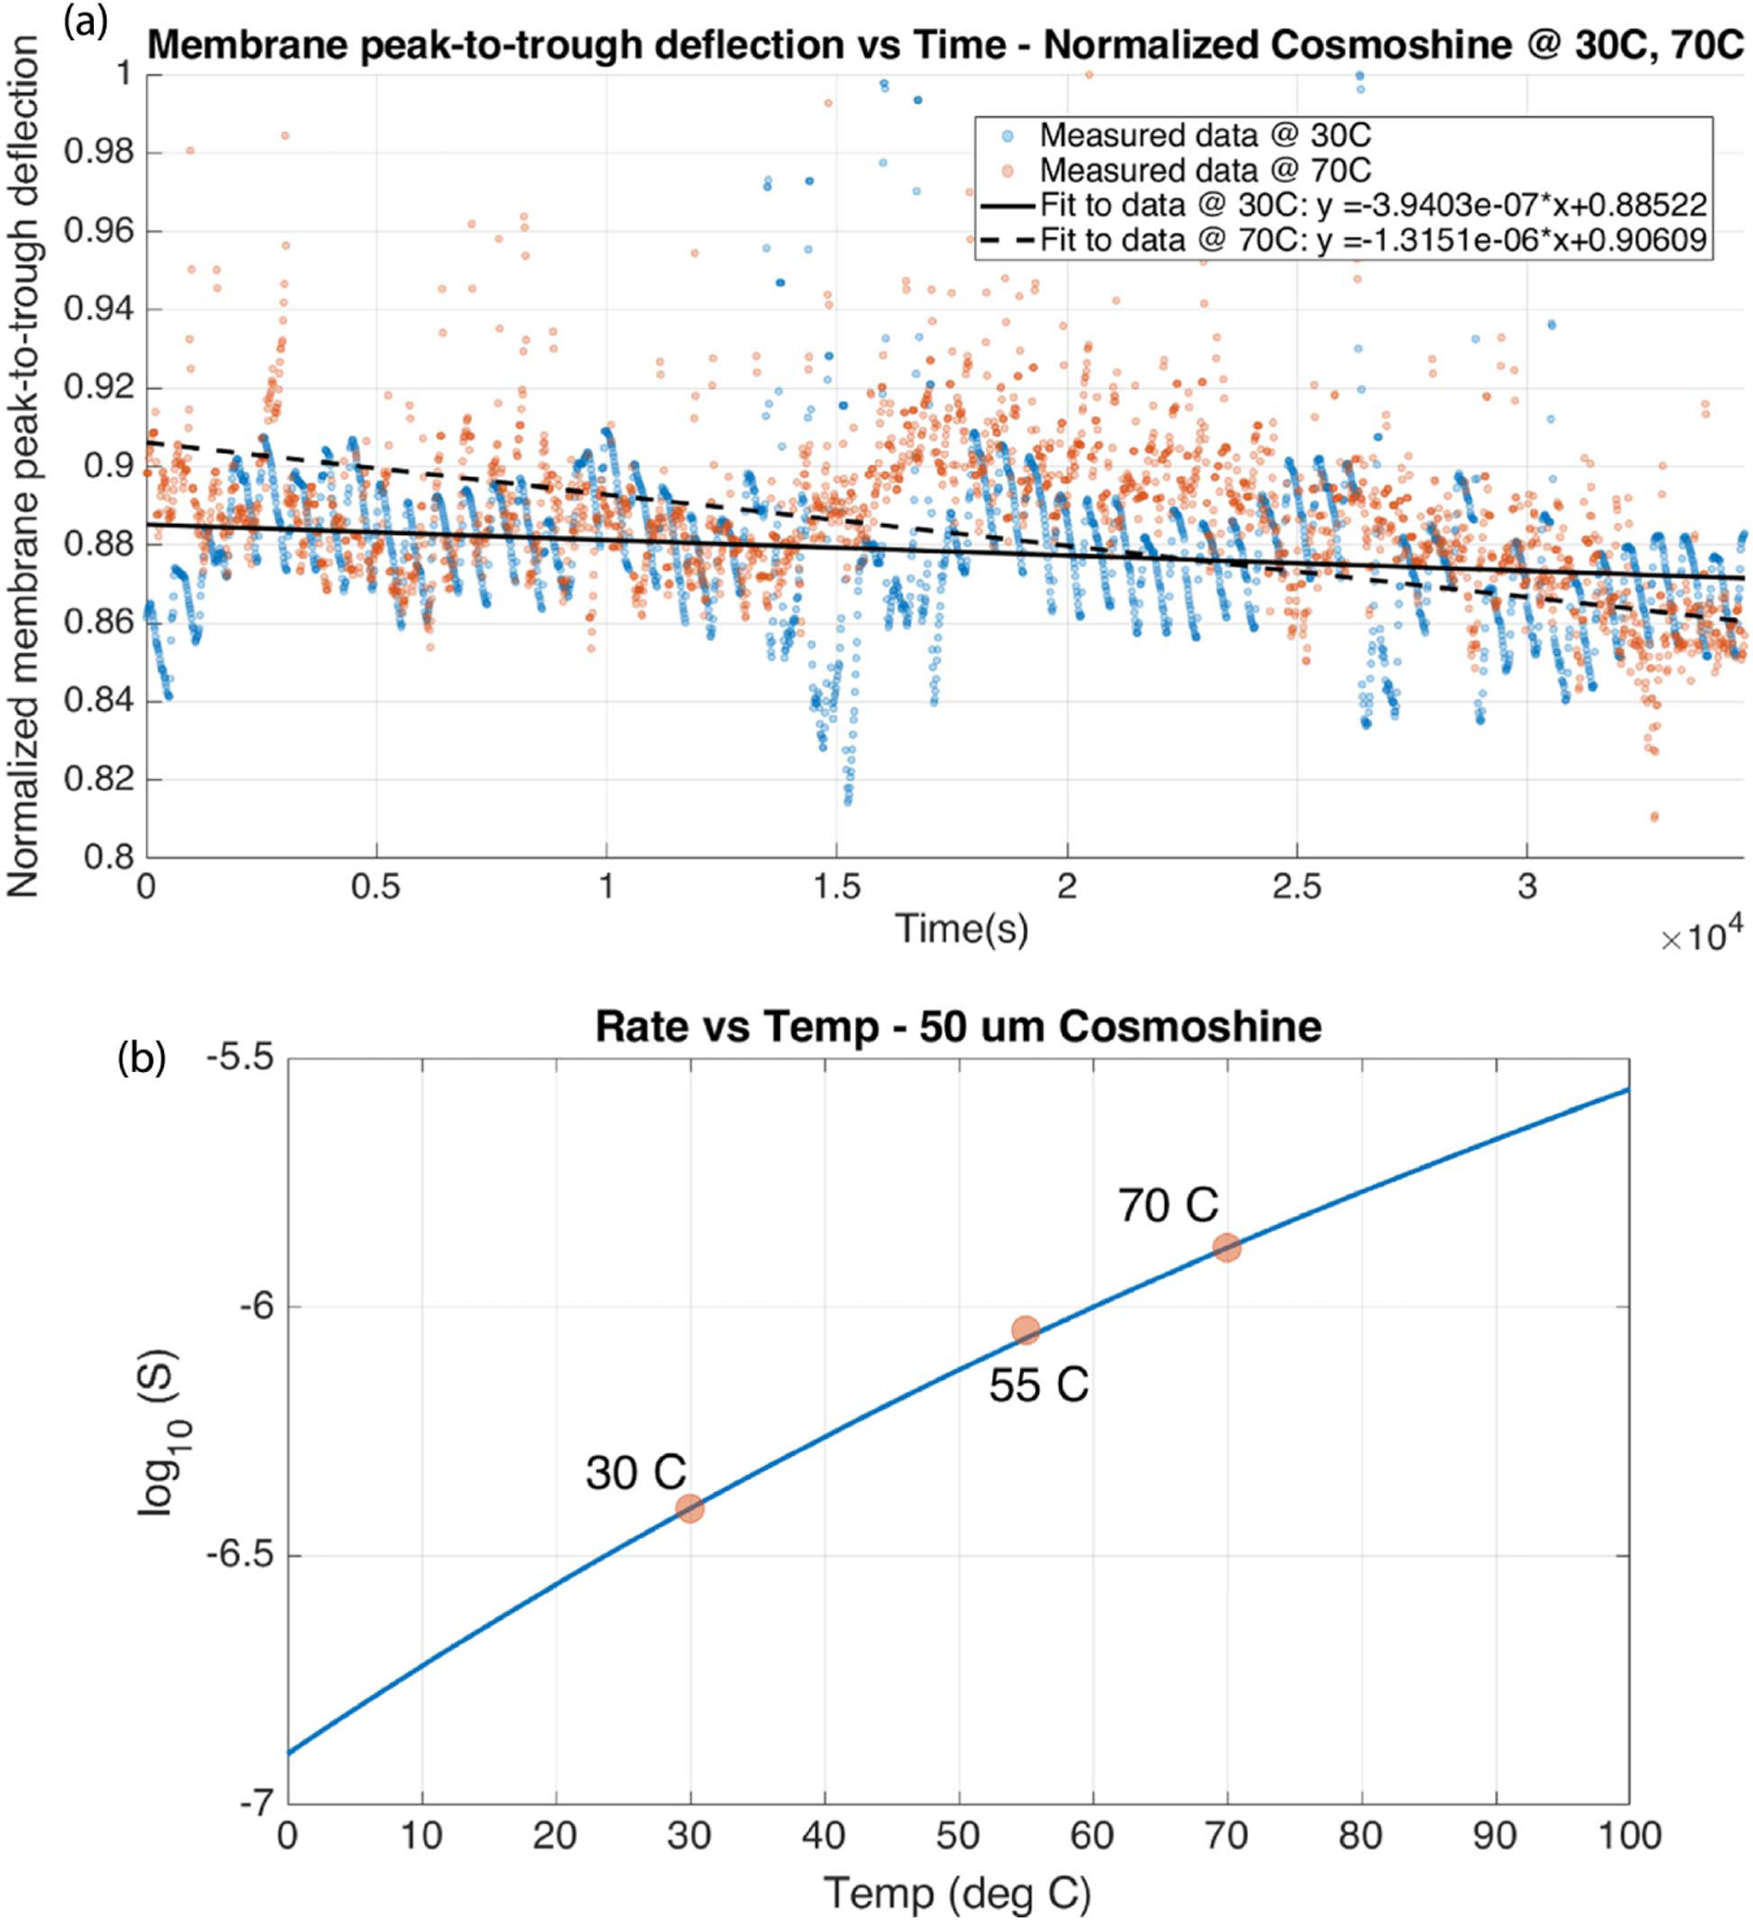
(a) Normalized membrane peak-to-trough deflection v/s time (s) and (b) log10(S)v/s temperature (°C) for tensed Cosmoshine membrane creep analysis study. The values at 30°C and 70°C were measured first while the membrane creep analysis was being conducted. The value at 55°C was measured by performing an experiment after the analysis was complete. The difference between the predicted value and experimentally measured value at 55°C is 0.27%.
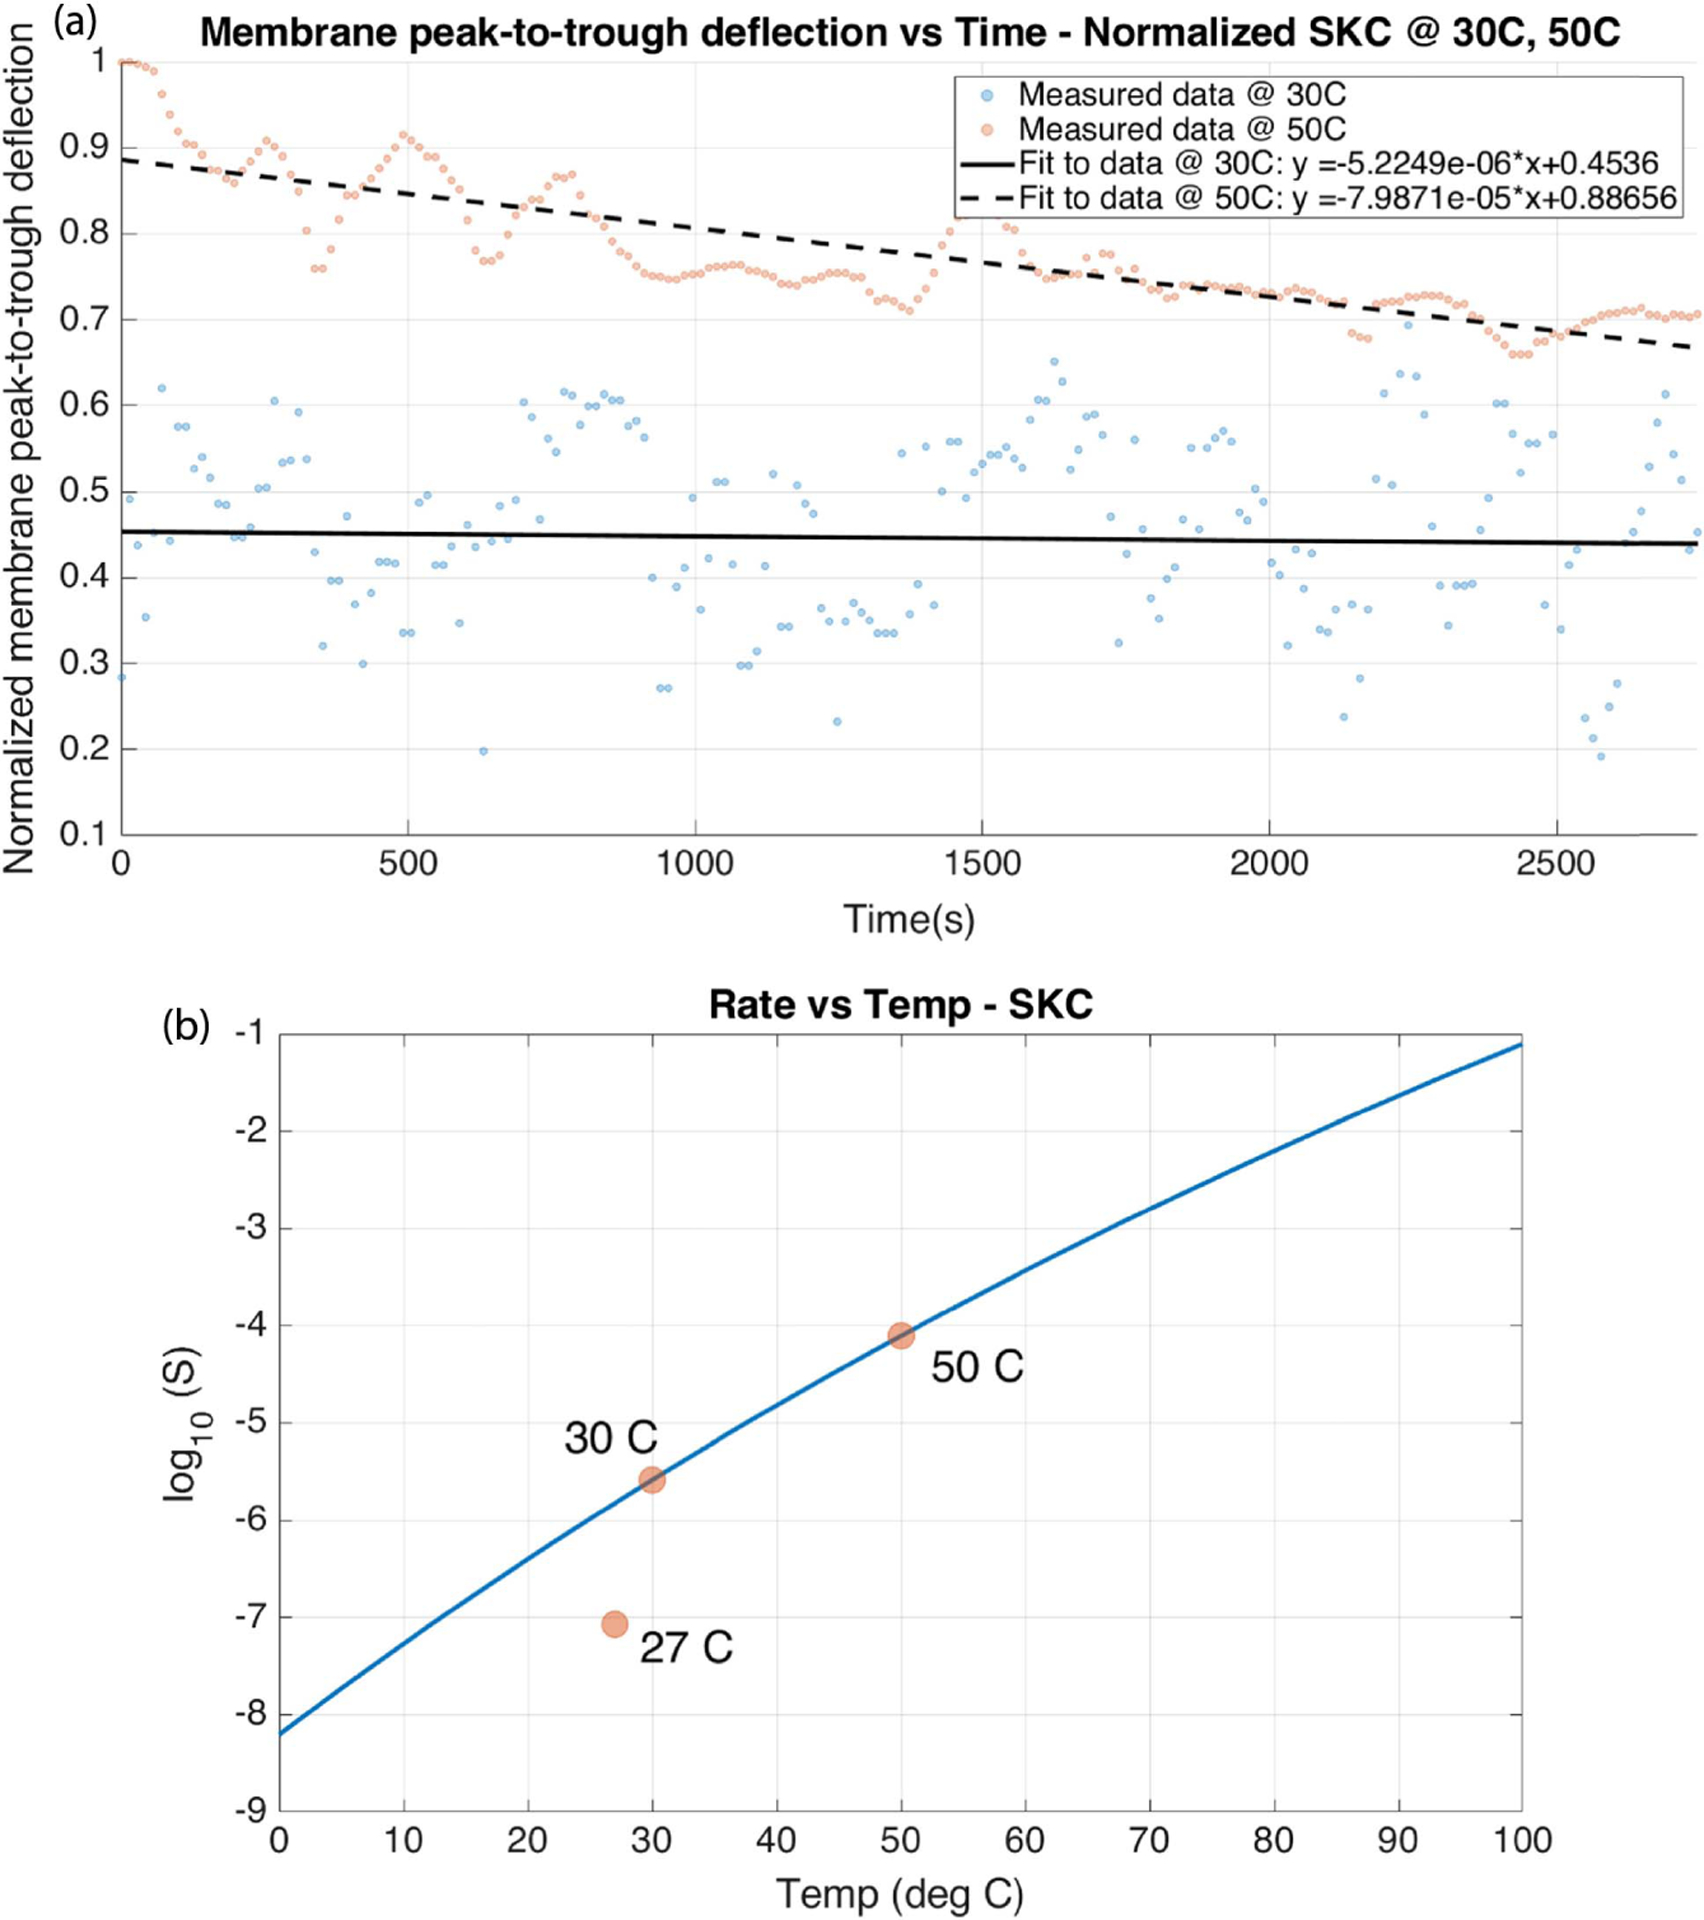
(a) Normalized membrane peak-to-trough deflection v/s time (s) and (b) log10(S)v/s temperature (°C) for tensed SKC membrane creep analysis study. The values at 30°C and 50°C were measured first while the membrane creep analysis was being conducted. The value at 27°C was measured by performing an experiment after the analysis was complete. The difference between the predicted value and experimentally measured value at 27°C is 21.44%.
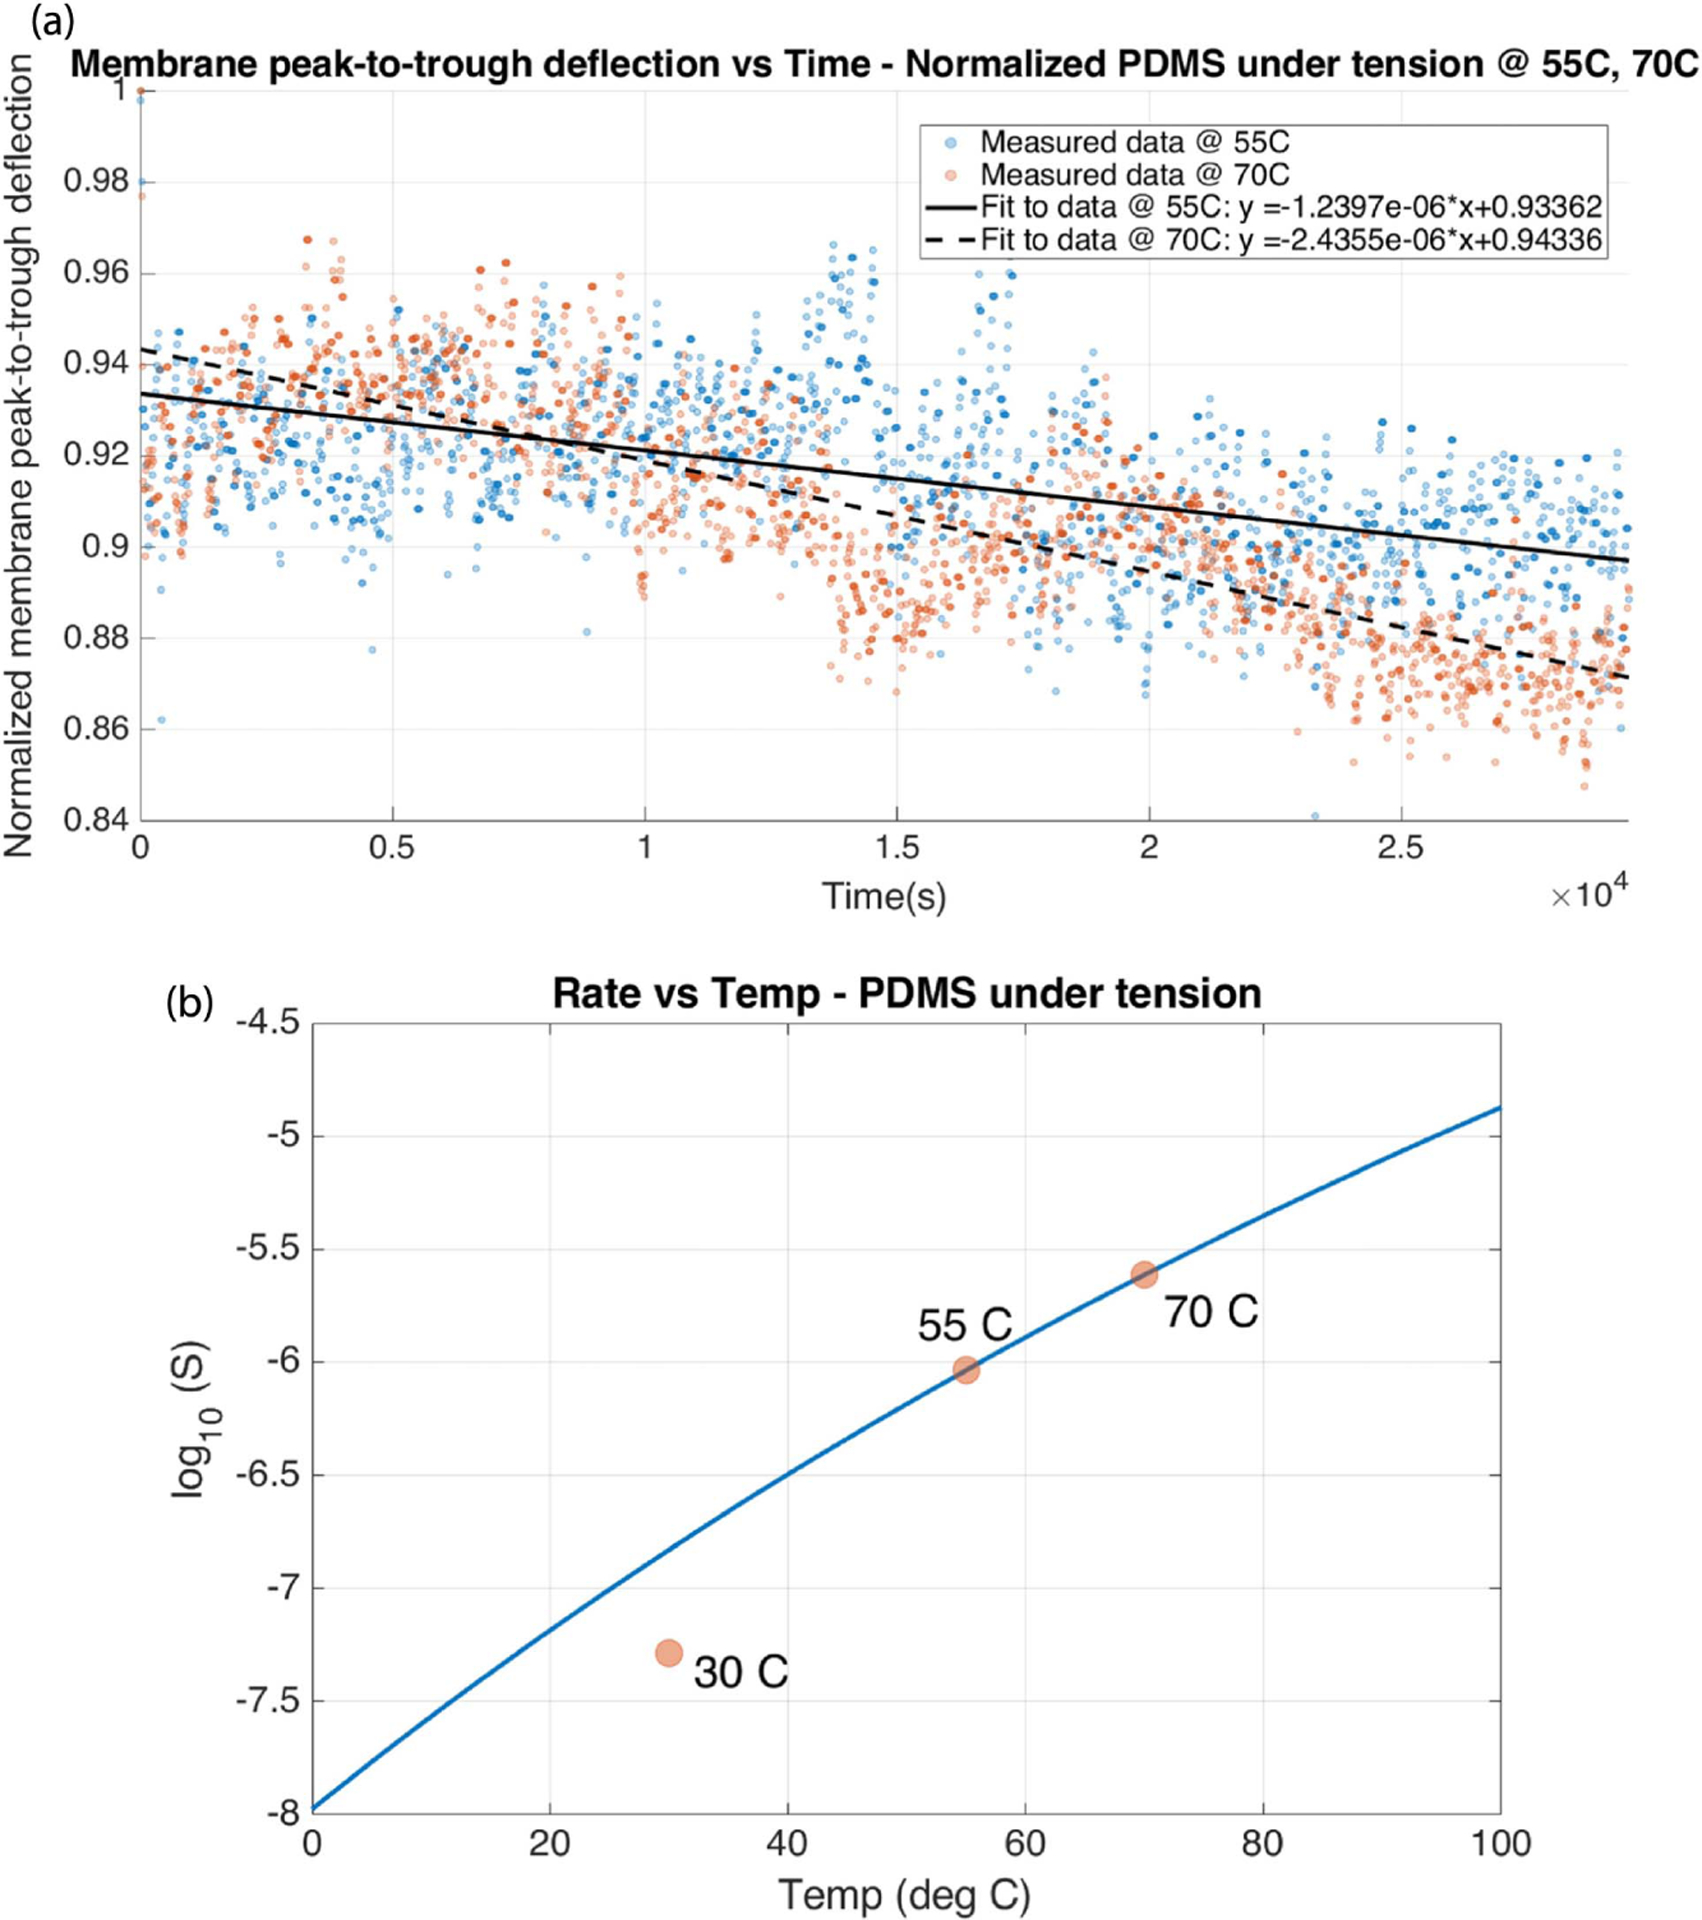
(a) Normalized membrane peak-to-trough deflection v/s time (s) and (b) log10(S)v/s temperature (°C) for tensed PDMS membrane creep analysis study. The values at 55°C and 70°C were measured first while the membrane creep analysis was being conducted. The value at 30°C was measured by performing an experiment after the analysis was complete. The difference between the predicted value and experimentally measured value at 30°C is 6.68%.
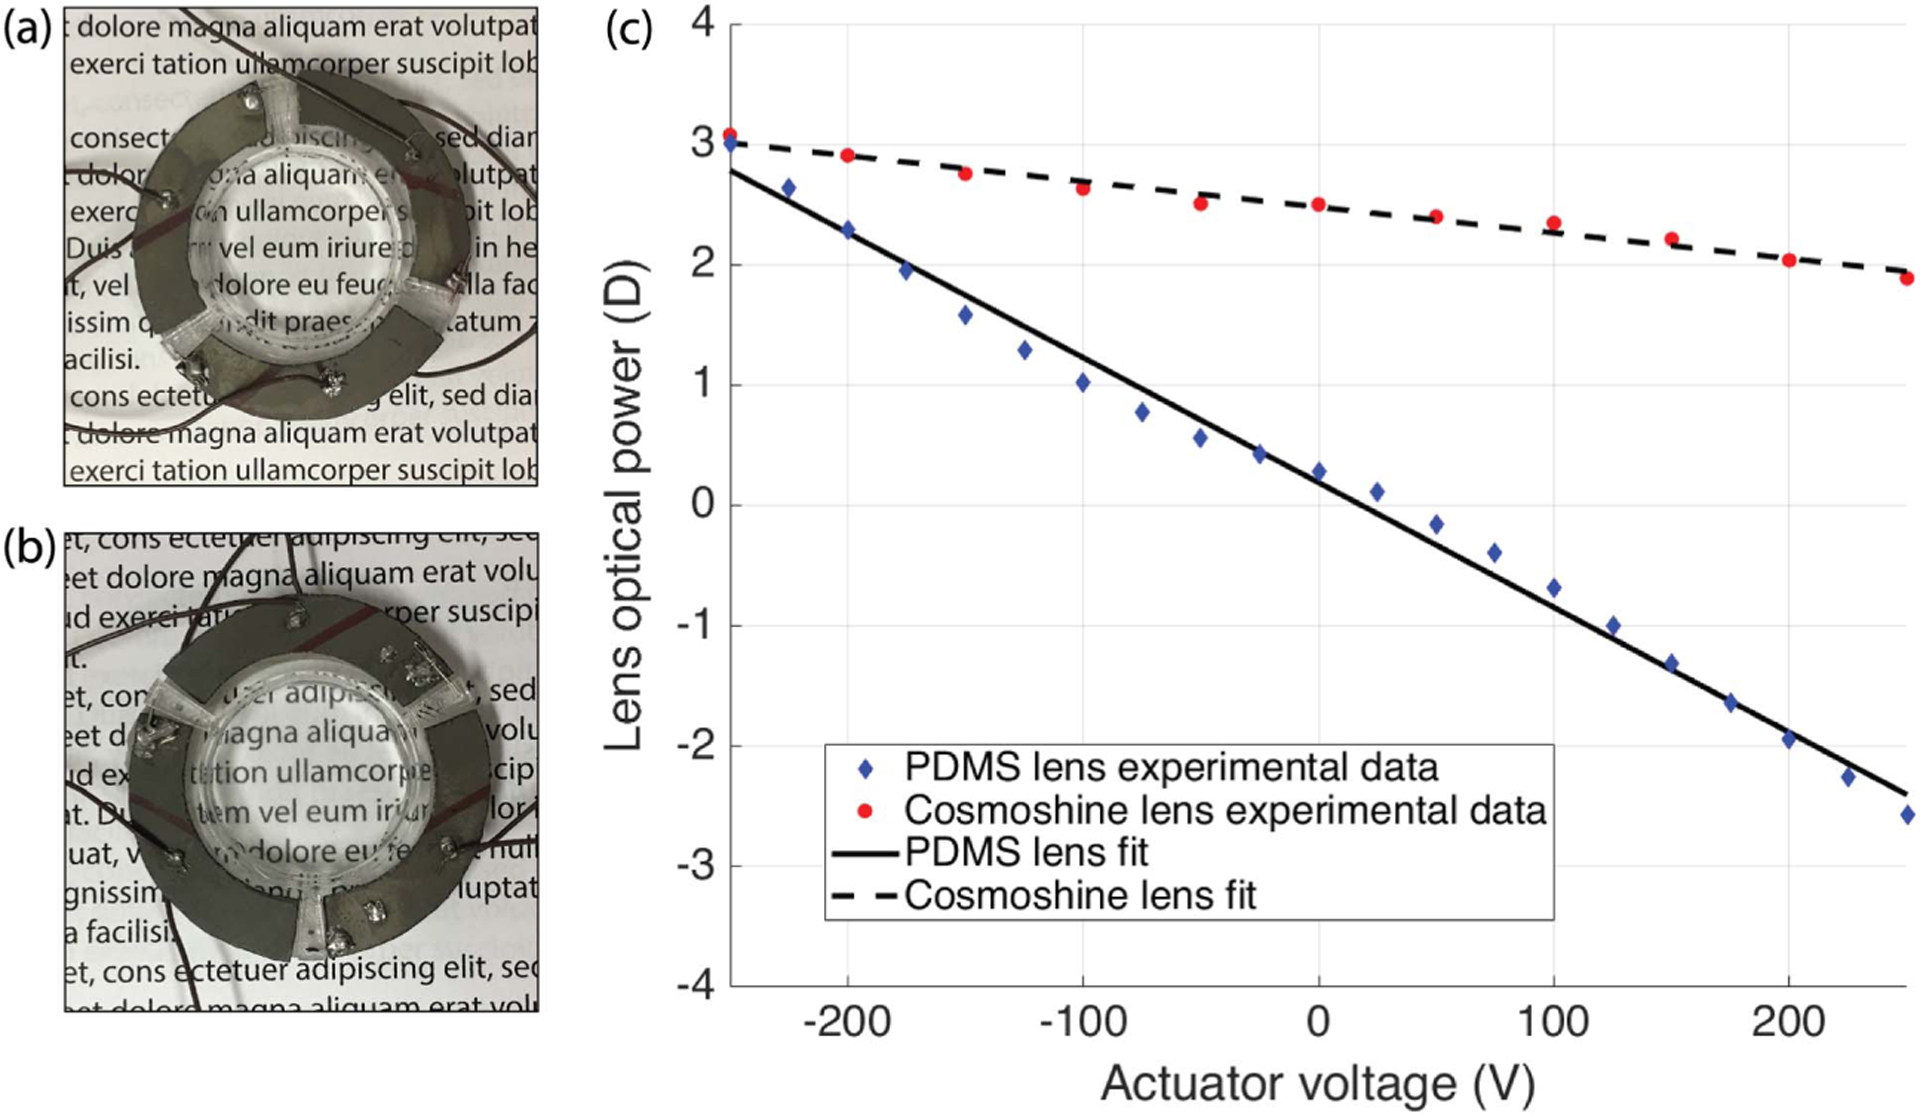
Comparison of performance of two membranes PDMS and Cosmoshine in tunable-focus liquid-filled lenses. Tunable-focus liquid-filled lenses fabricated using (a) PDM membrane and (b) Cosmoshine membrane. (c) Lens optical power (at the lens center) as a function of voltage for the two lenses shown in (a) and (b).
Similar articles
-
Tunable lenses using transparent dielectric elastomer actuators.Opt Express. 2013 Apr 8;21(7):8669-76. doi: 10.1364/OE.21.008669. Opt Express. 2013. PMID: 23571956
-
Tunable polymer lens.Opt Express. 2008 Aug 4;16(16):11847-57. doi: 10.1364/oe.16.011847. Opt Express. 2008. PMID: 18679457
-
A high numerical aperture, polymer-based, planar microlens array.Opt Express. 2009 Oct 26;17(22):19908-18. doi: 10.1364/OE.17.019908. Opt Express. 2009. PMID: 19997214
-
Recent Developments in Optofluidic Lens Technology.Micromachines (Basel). 2016 Jun 10;7(6):102. doi: 10.3390/mi7060102. Micromachines (Basel). 2016. PMID: 30404276 Free PMC article. Review.
-
Electrically Tunable Lenses: A Review.Front Robot AI. 2021 Jun 9;8:678046. doi: 10.3389/frobt.2021.678046. eCollection 2021. Front Robot AI. 2021. PMID: 34179110 Free PMC article. Review.
References
-
- Tyson RK, Principles of Adaptive Optics (CRC Press, 2011).
-
- Ren H and Wu ST, Introduction to Adaptive Lenses (Wiley, 2012).
-
- Varioptic, http://www.varioptic.com.
-
- Optotune, http://www.optotune.com.
-
- Yu H, Zhou G, Chau FS, and Sinha SK, “Tunable electromagnetically actuated liquid-filled lens,” Sens. Actuators A, Phys 167, 602–607 (2011).
Grants and funding
LinkOut - more resources
Full Text Sources
