. 2019 Sep 10;15(9):e1007344.
doi: 10.1371/journal.pcbi.1007344. eCollection 2019 Sep.

Systematically understanding the immunity leading to CRPC progression

Affiliations

Systematically understanding the immunity leading to CRPC progression

Zhiwei Ji et al. PLoS Comput Biol. .

Abstract

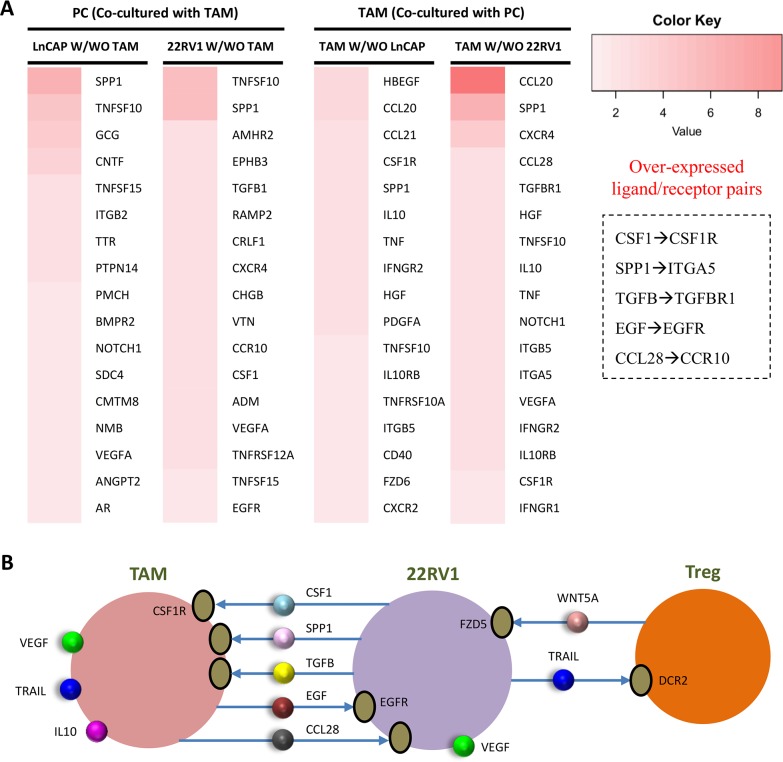
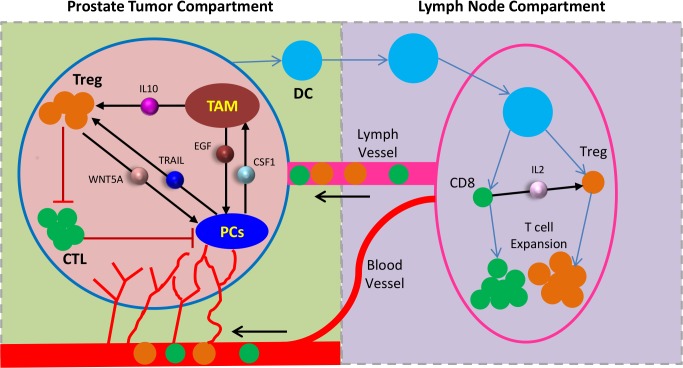
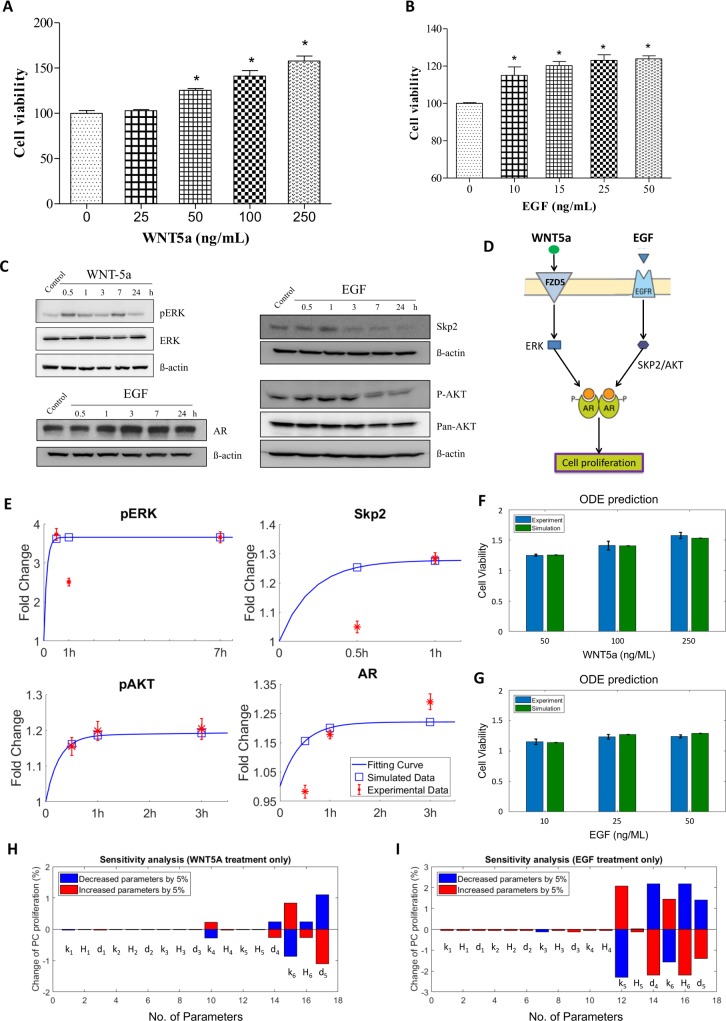
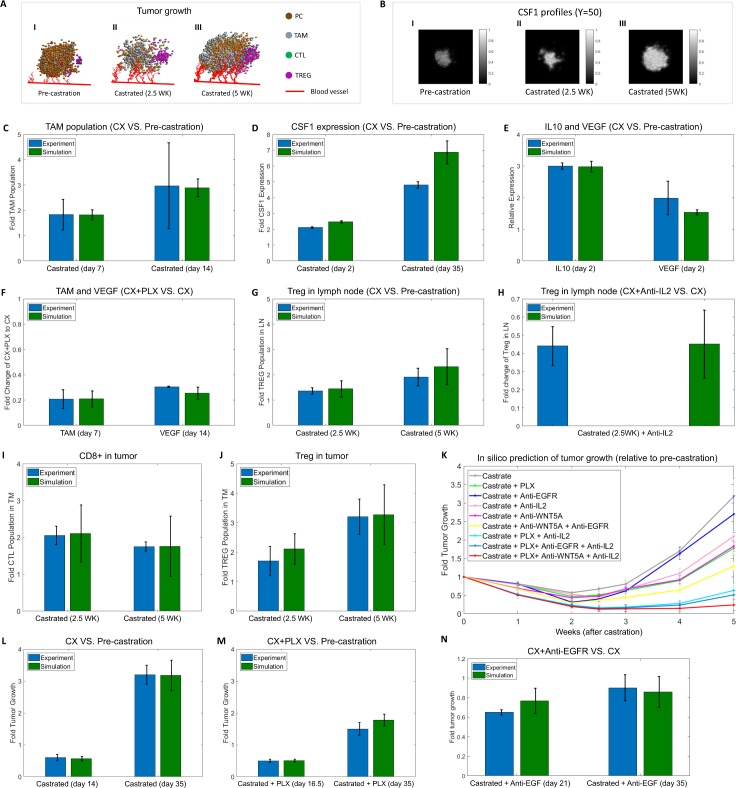
Prostate cancer (PCa) is the most commonly diagnosed malignancy and the second leading cause of cancer-related death in American men. Androgen deprivation therapy (ADT) has become a standard treatment strategy for advanced PCa. Although a majority of patients initially respond to ADT well, most of them will eventually develop castration-resistant PCa (CRPC). Previous studies suggest that ADT-induced changes in the immune microenvironment (mE) in PCa might be responsible for the failures of various therapies. However, the role of the immune system in CRPC development remains unclear. To systematically understand the immunity leading to CRPC progression and predict the optimal treatment strategy in silico, we developed a 3D Hybrid Multi-scale Model (HMSM), consisting of an ODE system and an agent-based model (ABM), to manipulate the tumor growth in a defined immune system. Based on our analysis, we revealed that the key factors (e.g. WNT5A, TRAIL, CSF1, etc.) mediated the activation of PC-Treg and PC-TAM interaction pathways, which induced the immunosuppression during CRPC progression. Our HMSM model also provided an optimal therapeutic strategy for improving the outcomes of PCa treatment.


Conflict of interest statement

The authors have declared that no competing interests exist.

Figures

Fig 1
Fig 1. qRT-PCR and Western blot analysis to determine the effect of WNT5A on AR-signaling associated genes and proteins in androgen-resistant 22RV1 prostate cancer cells.
(A-D) The gene expression levels of FZD5, TNFSF10, BMP6 and AR at 0.5, 1, 3, 7 and 24h after treatment with WNT5A, respectively. (E-G) The effect of WNT5A on protein levels of skp2, Foxo1 and pERK, respectively.
Fig 2
Fig 2. Inference of TAM-PC interactions with RNA-Seq data.
(A) The left panel shows the RNA-seq data from the cocultured macrophage and PC LnCap and 22RV1 cells. Prostate cancer cells (LNCaP or 22RV1) were co-cultured with or without M2 macrophage (TAM) for 48 h and RNA samples were collected for RNA-seq analysis. All of the gene expression data (fold change value) were normalized with non-co-cultured counterpart cells. For example, LNCaP W/WO TAM shows the gene expression ratio of LNCaP cells co-cultured with TAM to LNCaP cells not co-cultured with TAM. The top-ranked overexpressed genes with FC>1.3 are presented. Five enriched ligand-receptor pairs were highlighted. (B) The inferred cell-cell interaction networks between TAM, Treg, 22RV1.
Fig 3
Fig 3. The system modeling diagram of CRPC development.
The HMSM model includes two components: prostate cancer compartment (left) and lymph node compartment (right). The arrows represent cell-cell communications, which were inferred from our data or other public datasets.
Fig 4
Fig 4. Schematic representation of computational framework of HMSM model.
Fig 5
Fig 5. ODE modeling of WNT5A-EGF/AR signaling and experimental validation.
(A) The effect of WNT5A on 22RV1 cell viability. (B) The effect of EGF on 22RV1 cell viability. (C) The effect of WNT5A and EGF on protein levels of Skp2, pERK, pAKT and AR. (D) The network topology of androgen-independent pathways in prostate cancer cells. WNT5A or EGF regulates the cellular proliferation by activating AR-related pathway. This network was represented as a series of ODE equations shown in Eq. (1–6) in the section “Materials and methods”. (E) The predicted values of four proteins fit the observation data well. (F, G) The ODE system-predicted PC proliferation at 72 hours perturbed by WNT5A (F) or EGF (G) with different doses. (H, I) Sensitivity analysis of the ODE system was performed under two conditions: WNT5A treatment only (H), and EGF treatment only (I). Each parameter was perturbed by increasing or decreasing 5%.
Fig 6
Fig 6. Experimental observation and in silico prediction of HMSM Model.
The bars with blue color are experimental-measured values, and the bars with green color are predicted values in the HMSM model. CX: Castration. Time 0 denotes pre-castration. (A) A simulation example of prostate tumor before/after castration. I) pre-castration; II) 2.5 weeks after castration; III) 5 weeks after castration. (B) A simulation example of cytokine profiles before/after castration. I) pre-castration; II) 2.5 weeks after castration; III) 5 weeks after castration. The slices are extracted when Y = 50. Y is the Y axis. (C) TAMs are elevated by ADT in prostate cancer (day 7 and day 14 castration). (D) CSF1 protein level was analyzed from castrated mice (day 2 and day 35 castration). (E) Relative gene expression of IL10 and VEGF at 48hours after ADT. (F) PLX lowered macrophage levels and VEGF expression after ADT. (G) The number of Treg cells is increased in lymph nodes at 2.5 weeks and 5 weeks post-castration. (H) Treg expansion in lymph nodes was reduced by IL-2 neutralization. (I) In silico prediction of CD8+ cells in the castrated tumor at 2.5 and 5 weeks. (J) In silico prediction of Treg cells in the castrated tumor at 2.5 and 5 weeks. (K) In silico prediction of single or combined treatment on PC growth after castration relative to pre-castration. (L-N) The predictions and experimental validations for prostate tumor growth with castration only (L) or plus CSF1R (M) or plus EGFR inhibition (N) after castration.

References

    1. Jemal A, Siegel R, Xu J, Ward E. Cancer statistics, 2010. CA Cancer J Clin. 2010;60(5):277–300. 10.3322/caac.20073 . - DOI - PubMed
    1. Siegel R, Naishadham D, Jemal A. Cancer statistics, 2013. CA Cancer J Clin. 2013;63(1):11–30. 10.3322/caac.21166 . - DOI - PubMed
    1. Fusi A, Procopio G, Della Torre S, Ricotta R, Bianchini G, Salvioni R, et al. Treatment options in hormone-refractory metastatic prostate carcinoma. Tumori. 2004;90(6):535–46. WOS:000226741000001. - PubMed
    1. Devlin HL, Mudryj M. Progression of prostate cancer: multiple pathways to androgen independence. Cancer Lett. 2009;274(2):177–86. 10.1016/j.canlet.2008.06.007 . - DOI - PubMed
    1. Lamont KR, Tindall DJ. Minireview: Alternative activation pathways for the androgen receptor in prostate cancer. Mol Endocrinol. 2011;25(6):897–907. 10.1210/me.2010-0469 - DOI - PMC - PubMed

Publication types

MeSH terms