

Changes in micronutrient and inflammation serum biomarker concentrations after a norovirus human challenge
- PMID: 31504095
- PMCID: PMC6885472
- DOI: 10.1093/ajcn/nqz201
Changes in micronutrient and inflammation serum biomarker concentrations after a norovirus human challenge
Abstract
Background: To accurately assess micronutrient status, it is necessary to characterize the effects of inflammation and the acute-phase response on nutrient biomarkers.
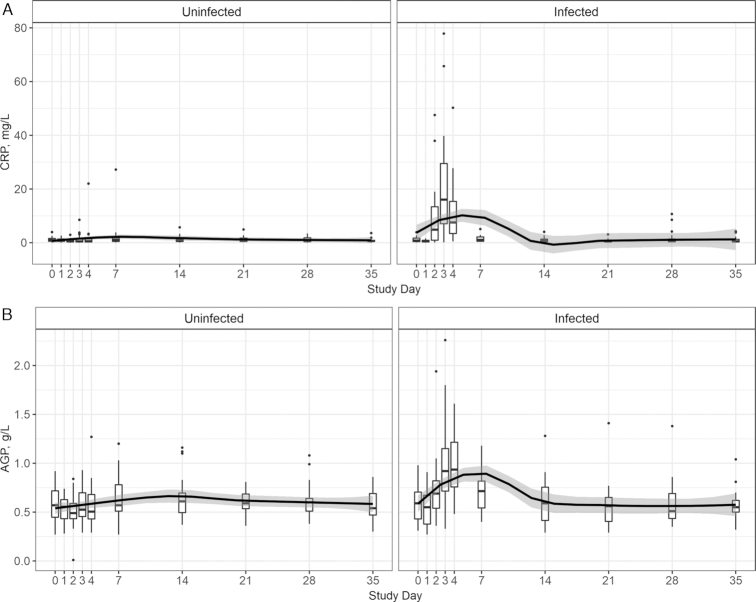
Objective: Within a norovirus human challenge study, we aimed to model the inflammatory response of C-reactive protein (CRP) and α-1-acid glycoprotein (AGP) by infection status, model kinetics of micronutrient biomarkers by inflammation status, and evaluate associations between inflammation and micronutrient biomarkers from 0 to 35 d post-norovirus exposure.
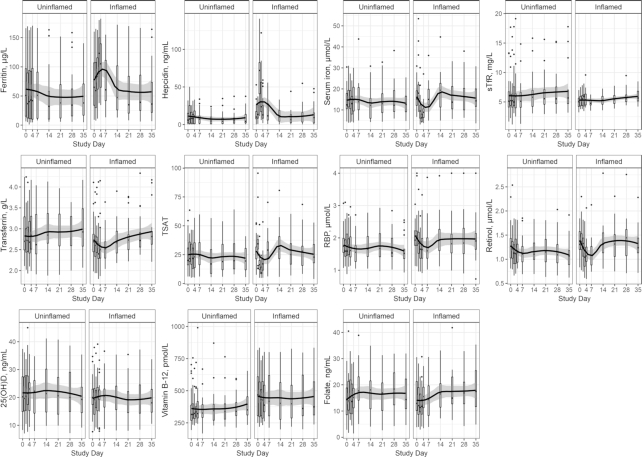
Methods: Fifty-two healthy adults were enrolled into challenge studies in a hospital setting and followed longitudinally; all were exposed to norovirus, half were infected. Post hoc analysis of inflammatory and nutritional biomarkers was performed. Subjects were stratified by inflammation resulting from norovirus exposure. Smoothed regression models analyzed the kinetics of CRP and AGP by infection status, and nutritional biomarkers by inflammation. Linear mixed-effects models were used to analyze the independent relations between CRP, AGP, and biomarkers for iron, vitamin A, vitamin D, vitamin B-12, and folate from 0 to 35 d post-norovirus exposure.
Results: Norovirus-infected subjects had median (IQR) peak concentrations for CRP [16.0 (7.9-29.5) mg/L] and AGP [0.9 (0.8-1.2) g/L] on day 3 and day 4 postexposure, respectively. Nutritional biomarkers that differed (P < 0.05) from baseline within the inflamed group were ferritin (elevated day 3), hepcidin (elevated days 2, 3), serum iron (depressed days 2-4), transferrin saturation (depressed days 2-4), and retinol (depressed days 3, 4, and 7). Nutritional biomarker concentrations did not differ over time within the uninflamed group. In mixed models, CRP was associated with ferritin (positive) and serum iron and retinol (negative, P < 0.05).
Conclusion: Using an experimental infectious challenge model in healthy adults, norovirus infection elicited a time-limited inflammatory response associated with altered serum concentrations of certain iron and vitamin A biomarkers, confirming the need to consider adjustments of these biomarkers to account for inflammation when assessing nutritional status. These trials were registered at clinicaltrials.gov as NCT00313404 and NCT00674336.
Keywords: acute-phase response; inflammation; kinetics; micronutrients; norovirus challenge.
Copyright © American Society for Nutrition 2019.
Figures
Similar articles
-
Within-individual differences in plasma ferritin, retinol-binding protein, and zinc concentrations in relation to inflammation observed during a short-term longitudinal study are similar to between-individual differences observed cross-sectionally.Am J Clin Nutr. 2019 May 1;109(5):1484-1492. doi: 10.1093/ajcn/nqz014. Am J Clin Nutr. 2019. PMID: 30976780
-
Asymptomatic malaria infection affects the interpretation of biomarkers of iron and vitamin A status, even after adjusting for systemic inflammation, but does not affect plasma zinc concentrations among young children in Burkina Faso.J Nutr. 2014 Dec;144(12):2050-8. doi: 10.3945/jn.114.200345. Epub 2014 Oct 1. J Nutr. 2014. PMID: 25411038
-
Iron, zinc, vitamin A and selenium status in a cohort of Indonesian infants after adjusting for inflammation using several different approaches.Br J Nutr. 2017 Nov;118(10):830-839. doi: 10.1017/S0007114517002860. Br J Nutr. 2017. PMID: 29189196
-
Factors associated with inflammation in preschool children and women of reproductive age: Biomarkers Reflecting Inflammation and Nutritional Determinants of Anemia (BRINDA) project.Am J Clin Nutr. 2017 Jul;106(Suppl 1):348S-358S. doi: 10.3945/ajcn.116.142315. Epub 2017 Jun 14. Am J Clin Nutr. 2017. PMID: 28615263 Free PMC article. Review.
-
Inflammation and biomarkers of micronutrient status.Curr Opin Clin Nutr Metab Care. 2016 Nov;19(6):458-463. doi: 10.1097/MCO.0000000000000323. Curr Opin Clin Nutr Metab Care. 2016. PMID: 27583708 Review.
Cited by
-
Micronutrient deficiencies and anaemia associated with body mass index in Australian adults: a cross-sectional study.BMJ Open. 2022 Dec 15;12(12):e061442. doi: 10.1136/bmjopen-2022-061442. BMJ Open. 2022. PMID: 36521896 Free PMC article.
-
The role of vitamin B12 in viral infections: a comprehensive review of its relationship with the muscle-gut-brain axis and implications for SARS-CoV-2 infection.Nutr Rev. 2022 Feb 10;80(3):561-578. doi: 10.1093/nutrit/nuab092. Nutr Rev. 2022. PMID: 34791425 Free PMC article. Review.
-
Impact of Intravenous Iron Substitution on Serum Phosphate Levels and Bone Turnover Markers-An Open-Label Pilot Study.Nutrients. 2023 Jun 9;15(12):2693. doi: 10.3390/nu15122693. Nutrients. 2023. PMID: 37375595 Free PMC article. Clinical Trial.
-
Plasma iron controls neutrophil production and function.Sci Adv. 2022 Oct 7;8(40):eabq5384. doi: 10.1126/sciadv.abq5384. Epub 2022 Oct 5. Sci Adv. 2022. PMID: 36197985 Free PMC article.
-
Hypothesis: Low Vitamin A and D Levels Worsen Clinical Outcomes When Children with Sickle Cell Disease Encounter Parvovirus B19.Nutrients. 2022 Aug 19;14(16):3415. doi: 10.3390/nu14163415. Nutrients. 2022. PMID: 36014920 Free PMC article.
References
-
- Brown KH, Lanata CF, Yuen ML, Peerson JM, Butron B, Lönnerdal B. Potential magnitude of the misclassification of a population's trace element status due to infection: example from a survey of young Peruvian children. Am J Clin Nutr. 1993;58(4):549–54. - PubMed
-
- Diana A, Haszard JJ, Purnamasari DM, Nurulazmi I, Luftimas DE, Rahmania S, Nugraha GI, Erhardt J, Gibson RS, Houghton L. Iron, zinc, vitamin A and selenium status in a cohort of Indonesian infants after adjusting for inflammation using several different approaches. Br J Nutr. 2017;118(10):830–9. - PubMed
-
- Larson LM, Namaste SM, Williams AM, Engle-Stone R, Addo OY, Suchdev PS, Wirth JP, Temple V, Serdula M, Northrop-Clewes CA. Adjusting retinol-binding protein concentrations for inflammation: Biomarkers Reflecting Inflammation and Nutritional Determinants of Anemia (BRINDA) project. Am J Clin Nutr. 2017;106(Suppl 1):390S–401S. - PMC - PubMed
Publication types
MeSH terms
Substances
Associated data
Grants and funding
LinkOut - more resources
Full Text Sources
Medical
Research Materials
Miscellaneous
