. 2019 Dec 31;188(12):2165-2174.
doi: 10.1093/aje/kwz177.

Hypertension Awareness, Treatment, and Control in US Adults: Trends in the Hypertension Control Cascade by Population Subgroup (National Health and Nutrition Examination Survey, 1999-2016)

Hypertension Awareness, Treatment, and Control in US Adults: Trends in the Hypertension Control Cascade by Population Subgroup (National Health and Nutrition Examination Survey, 1999-2016)

Kathryn Foti et al. Am J Epidemiol. .

Abstract

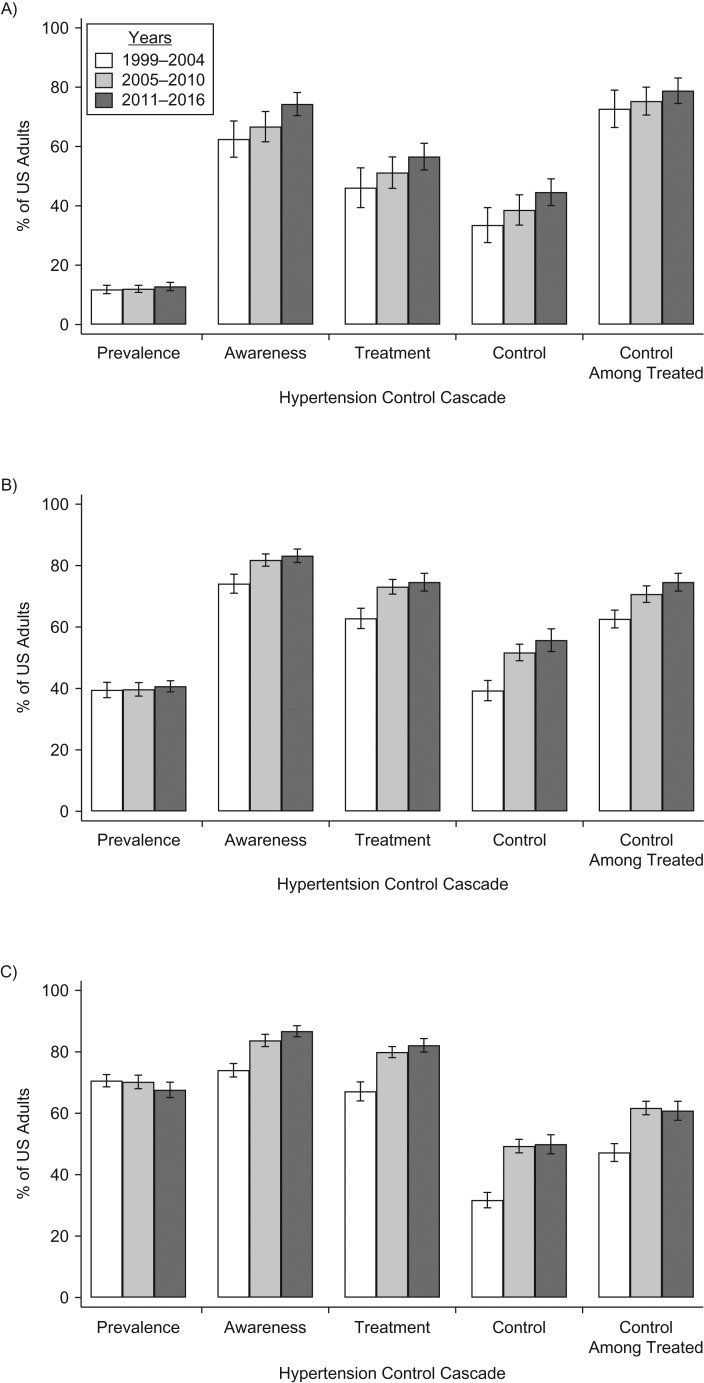
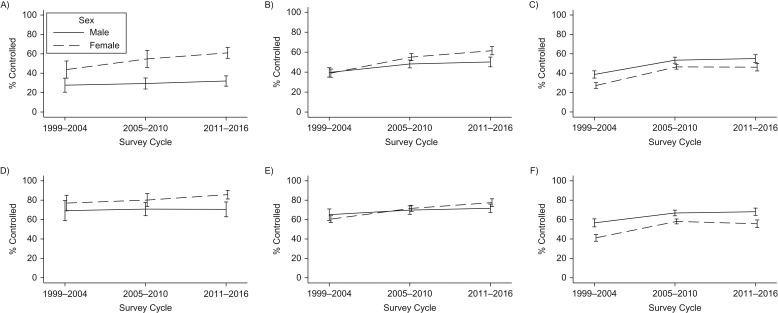
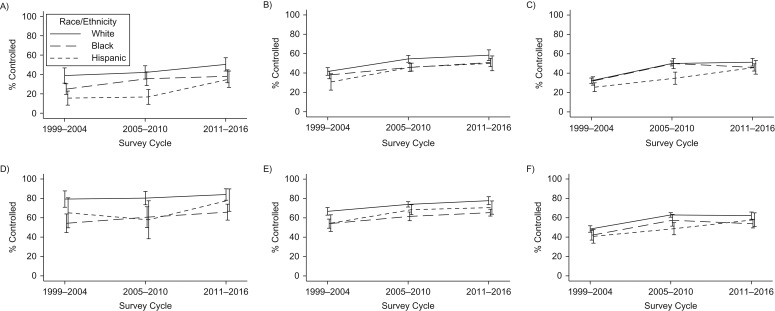
Examination of changes in hypertension awareness, treatment, and control (i.e., the hypertension control cascade) by population subgroup can inform targeted efforts to improve hypertension control and reduce disparities. We analyzed 1999-2016 data from the National Health and Nutrition Examination Survey and examined trends across 6-year periods in hypertension awareness, treatment, and control by age, sex, and race/ethnicity. We included 39,589 participants (16,141 with hypertension). Hypertension awareness, treatment, and control increased from 1999 to 2016 among all age groups. However, there were few changes after 2010. Across all time periods, awareness, treatment, and control were higher among younger women (ages 25-44 years) than among younger men, while control was higher among older men (ages ≥65 years) than among older women. Hypertension control was persistently lower for blacks than for whites of all ages, and awareness, treatment, and control were lower among younger Hispanics. There have been few changes in hypertension awareness, treatment, and control since 2010. Disparities in hypertension control by sex highlight the need for effective interventions among younger men and older women. Concerted efforts are also needed to reduce persistent racial/ethnic disparities, particularly to improve treatment control among blacks and to further address gaps at all stages among younger Hispanics.

Keywords: blood pressure; health disparities; hypertension; surveillance.


Figures

Figure 1.
Figure 1.
Hypertension prevalence, awareness, treatment, control, and control among those treated, by age group, in US adults aged ≥25 years, National Health and Nutrition Examination Survey, 1999–2016. A) Persons aged 25–44 years. Among those with hypertension, hypertension awareness was significantly higher (P < 0.05) in 2011–2016 than in 1999–2004 and 2005–2010. Hypertension treatment was significantly higher in 2011–2016 than in 2005–2010. Hypertension control was significantly higher in 2011–2016 than in 2005–2010. B) Persons aged 45–64 years. Among those with hypertension, hypertension awareness, treatment, control, and control among those treated were significantly higher in 2005–2010 and 2011–2016 than in 1999–2004. C) Persons aged ≥65 years. Among those with hypertension, hypertension awareness was significantly higher in 2005–2010 and 2011–2016 than in 1999–2004 and higher in 2011–2016 than in 2005–2010. Hypertension treatment, control, and control among those treated were significantly higher in 2005–2010 and 2011–2016 than in 1999–2004. Bars, 95% confidence intervals.
Figure 2.
Figure 2.
Hypertension control among all persons with hypertension (top row) and among persons treated for hypertension (bottom row), by age group and sex, in US adults aged ≥25 years, National Health and Nutrition Examination Survey, 1999–2016. A) Persons aged 25–44 years with hypertension. Among females, hypertension control was significantly higher (P < 0.05) in 2011–2016 than in 1999–2004. Hypertension control was significantly higher among females than among males in 1999–2004, 2005–2010, and 2011–2016. B) Persons aged 45–64 years with hypertension. Among females, hypertension control was significantly higher in 2005–2010 and 2011–2016 than in 1999–2004 and higher in 2011–2016 than in 2005–2010. Among males, hypertension control was significantly higher in 2005–2010 and 2011–2016 than in 1999–2004. Hypertension control was significantly higher among females than among males in 2005–2010 and 2011–2016. There was a larger difference in hypertension control by sex in 2011–2016 than in 1999–2004. C) Persons aged ≥65 years with hypertension. Among males, hypertension control was significantly higher in 2005–2010 and 2011–2016 than in 1999–2004. Among females, hypertension control was significantly higher in 2005–2010 and 2011–2016 than in 1999–2004. Hypertension control was significantly higher among males than among females in 1999–2004, 2005–2010, and 2011–2016. D) Persons aged 25–44 years with treated hypertension. There were no statistically significant changes. E) Persons aged 45–64 years with treated hypertension. Among females with treated hypertension, hypertension control was significantly higher in 2011–2016 than in 1999–2004 and 2005–2010. Among males with treated hypertension, hypertension control was significantly higher in 2011–2016 than in 1999–2004. Among those treated, hypertension control was significantly higher in females than in males in 2011–2016, and the sex difference in hypertension control was significantly different in 2011–2016 than in 1999–2004. F) Persons aged ≥65 years with treated hypertension. Among males and females with treated hypertension, hypertension control was significantly higher in 2005–2010 and 2011–2016 than in 1999–2004. Among those treated, hypertension control was significantly higher in males than in females in 2005–2010 and 2011–2016. The male-female sex difference in hypertension control among those treated was significantly smaller in 2005–2010 than in 1999–2004. Bars, 95% confidence intervals.
Figure 3.
Figure 3.
Hypertension control among all persons with hypertension (top row) and among persons treated for hypertension (bottom row), by age group and race/ethnicity, in US adults aged ≥25 years, National Health and Nutrition Examination Survey, 1999–2016. A) Persons aged 25–44 years with hypertension. Among whites, hypertension control was significantly higher (P < 0.05) in 2011–2016 than in 1999–2004. Among blacks, hypertension control was significantly higher in 2005–2010 and 2011–2016 than in 1999–2004. Among Hispanics, hypertension control was significantly higher in 2011–2016 than in 1999–2004 and 2005–2010. Hypertension control was significantly higher among whites than among blacks in 1999–2004 and 2011–2016. Hypertension control was significantly higher among whites than among Hispanics in 1999–2004, 2005–2010, and 2011–2016. B) Persons aged 45–64 years with hypertension. Among whites, blacks, and Hispanics, hypertension control was significantly higher in 2005–2010 and 2011–2016 than in 1999–2004. Hypertension control was significantly higher among whites than among blacks in 1999–2004, 2005–2010, and 2011–2016. Hypertension control was significantly higher among whites than among Hispanics in 1999–2004 and 2005–2010. C) Persons aged ≥65 years with hypertension. Among whites, blacks, and Hispanics, hypertension control was significantly higher in 2005–2010 and 2011–2016 than in 1999–2004; among Hispanics, hypertension control was also significantly higher in 2011–2016 than in 2005–2010. Hypertension control was significantly higher among whites than among blacks in 2011–2016. Hypertension control was significantly higher among whites than among Hispanics in 1999–2004 and 2005–2010, with a larger difference in 2005–2010 than in 1999–2004. D) Persons aged 25–44 years with treated hypertension. Among those with treated hypertension, hypertension control was significantly higher in whites than in blacks in 1999–2004, 2005–2010, and 2011–2016 and significantly higher in whites than in Hispanics in 1999–2004 and 2005–2010. E) Persons aged 45–64 years with treated hypertension. Among whites, blacks, and Hispanics with treated hypertension, hypertension control was significantly higher in 2005–2010 and 2011–2016 than in 1999–2004. Among those treated, hypertension control was significantly higher in whites than in blacks in 1999–2004, 2005–2010, and 2011–2016. Among those treated, hypertension control was significantly higher in whites than in Hispanics in 1999–2004. F) Persons aged ≥65 years with treated hypertension. Among whites, blacks, and Hispanics with treated hypertension, hypertension control was significantly higher in 2005–2010 and 2011–2016 than in 1999–2004. Among those treated, hypertension control was significantly higher in whites than in blacks in 1999–2004 and 2011–2016. Among those treated, hypertension control was significantly higher in whites than in Hispanics in 2005–2010. Bars, 95% confidence intervals.

References

    1. Benjamin EJ, Virani SS, Callaway CW, et al. Heart disease and stroke statistics—2018 update: a report from the American Heart Association. Circulation. 2018;137(12):e67–e492. - PubMed
    1. Van Dyke M, Greer S, Odom E, et al. Heart disease death rates among blacks and whites aged ≥35 years—United States, 1968–2015. MMWR Surveill Summ. 2018;67(5):1–11. - PMC - PubMed
    1. Wozniak G, Khan T, Gillespie C, et al. Hypertension control cascade: a framework to improve hypertension awareness, treatment, and control. J Clin Hypertens (Greenwich). 2016;18(3):232–239. - PMC - PubMed
    1. Egan BM, Zhao Y, Axon RN. US trends in prevalence, awareness, treatment, and control of hypertension, 1988–2008. JAMA. 2010;303(20):2043–2050. - PubMed
    1. Luepker RV, Steffen LM, Jacobs DR Jr, et al. Trends in blood pressure and hypertension detection, treatment, and control 1980 to 2009: the Minnesota Heart Survey. Circulation. 2012;126(15):1852–1857. - PMC - PubMed

Publication types