

Regulatory annotation of genomic intervals based on tissue-specific expression QTLs
- PMID: 31504167
- PMCID: PMC8215915
- DOI: 10.1093/bioinformatics/btz669
Regulatory annotation of genomic intervals based on tissue-specific expression QTLs
Abstract
Motivation: Annotating a given genomic locus or a set of genomic loci is an important yet challenging task. This is especially true for the non-coding part of the genome which is enormous yet poorly understood. Since gene set enrichment analyses have demonstrated to be effective approach to annotate a set of genes, the same idea can be extended to explore the enrichment of functional elements or features in a set of genomic intervals to reveal potential functional connections.
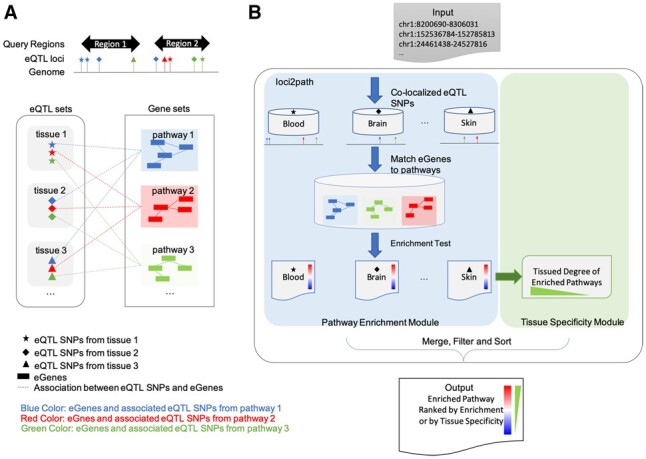
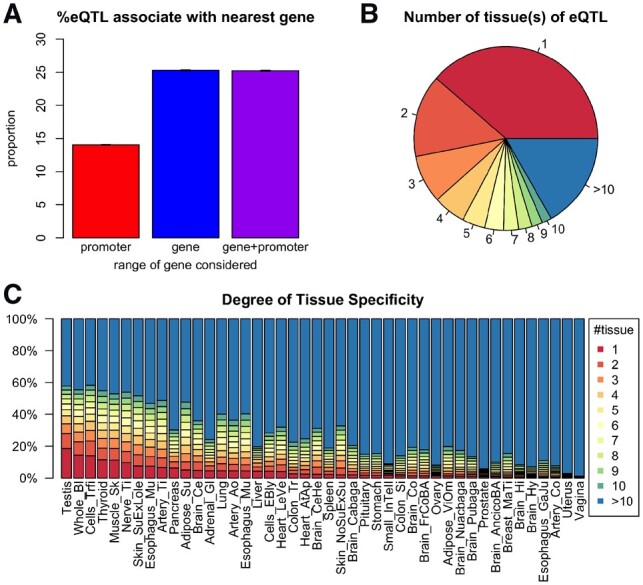
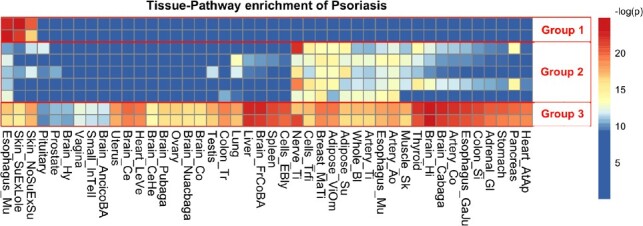
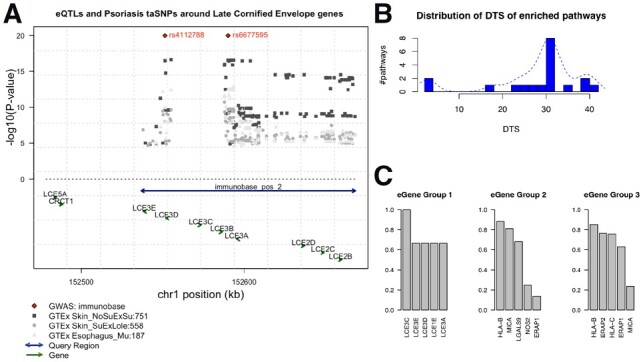
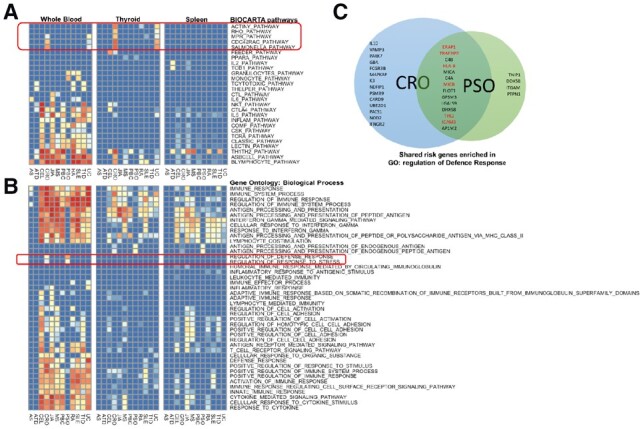
Results: In this study, we describe a novel computational strategy named loci2path that takes advantage of the newly emerged, genome-wide and tissue-specific expression quantitative trait loci (eQTL) information to help annotate a set of genomic intervals in terms of transcription regulation. By checking the presence or the absence of millions of eQTLs in a set of input genomic intervals, combined with grouping eQTLs by the pathways or gene sets that their target genes belong to, loci2path build a bridge connecting genomic intervals to functional pathways and pre-defined biological-meaningful gene sets, revealing potential for regulatory connection. Our method enjoys two key advantages over existing methods: first, we no longer rely on proximity to link a locus to a gene which has shown to be unreliable; second, eQTL allows us to provide the regulatory annotation under the context of specific tissue types. To demonstrate its utilities, we apply loci2path on sets of genomic intervals harboring disease-associated variants as query. Using 1 702 612 eQTLs discovered by the Genotype-Tissue Expression (GTEx) project across 44 tissues and 6320 pathways or gene sets cataloged in MSigDB as annotation resource, our method successfully identifies highly relevant biological pathways and revealed disease mechanisms for psoriasis and other immune-related diseases. Tissue specificity analysis of associated eQTLs provide additional evidence of the distinct roles of different tissues played in the disease mechanisms.
Availability and implementation: loci2path is published as an open source Bioconductor package, and it is available at http://bioconductor.org/packages/release/bioc/html/loci2path.html.
Supplementary information: Supplementary data are available at Bioinformatics online.
© The Author(s) 2019. Published by Oxford University Press. All rights reserved. For permissions, please e-mail: journals.permissions@oup.com.
Figures
Similar articles
-
Systematic Exploration in Tissue-Pathway Associations of Complex Traits Using Comprehensive eQTLs Catalog.Front Big Data. 2021 Nov 3;4:719737. doi: 10.3389/fdata.2021.719737. eCollection 2021. Front Big Data. 2021. PMID: 34805976 Free PMC article.
-
Characterizing the Relation Between Expression QTLs and Complex Traits: Exploring the Role of Tissue Specificity.Behav Genet. 2018 Sep;48(5):374-385. doi: 10.1007/s10519-018-9914-2. Epub 2018 Jul 20. Behav Genet. 2018. PMID: 30030655 Free PMC article.
-
Qtlizer: comprehensive QTL annotation of GWAS results.Sci Rep. 2020 Nov 24;10(1):20417. doi: 10.1038/s41598-020-75770-7. Sci Rep. 2020. PMID: 33235230 Free PMC article.
-
Expression Quantitative Trait Loci Information Improves Predictive Modeling of Disease Relevance of Non-Coding Genetic Variation.PLoS One. 2015 Oct 16;10(10):e0140758. doi: 10.1371/journal.pone.0140758. eCollection 2015. PLoS One. 2015. PMID: 26474488 Free PMC article. Review.
-
Annotating genetic variants to target genes using H-MAGMA.Nat Protoc. 2023 Jan;18(1):22-35. doi: 10.1038/s41596-022-00745-z. Epub 2022 Oct 26. Nat Protoc. 2023. PMID: 36289406 Free PMC article. Review.
Cited by
-
gsQTL: Associating genetic risk variants with gene sets by exploiting their shared variability.bioRxiv [Preprint]. 2024 Sep 16:2024.09.13.612853. doi: 10.1101/2024.09.13.612853. bioRxiv. 2024. PMID: 39345521 Free PMC article. Preprint.
-
Systematic Exploration in Tissue-Pathway Associations of Complex Traits Using Comprehensive eQTLs Catalog.Front Big Data. 2021 Nov 3;4:719737. doi: 10.3389/fdata.2021.719737. eCollection 2021. Front Big Data. 2021. PMID: 34805976 Free PMC article.
-
SC-VAR: a computational tool for interpreting polygenic disease risks using single-cell epigenomic data.Brief Bioinform. 2025 Mar 4;26(2):bbaf123. doi: 10.1093/bib/bbaf123. Brief Bioinform. 2025. PMID: 40127183 Free PMC article.
-
Testing Proximity of Genomic Regions to Transcription Start Sites and Enhancers Complements Gene Set Enrichment Testing.Front Genet. 2020 Mar 6;11:199. doi: 10.3389/fgene.2020.00199. eCollection 2020. Front Genet. 2020. PMID: 32211031 Free PMC article.
-
SysBiolPGWAS: simplifying post-GWAS analysis through the use of computational technologies and integration of diverse omics datasets.Bioinformatics. 2023 Jan 1;39(1):btac791. doi: 10.1093/bioinformatics/btac791. Bioinformatics. 2023. PMID: 36477976 Free PMC article.
References
-
- Barski A. et al. (2007) High-resolution profiling of histone methylations in the human genome. Cell, 129, 823–837. - PubMed
-
- Benjamini Y., Hochberg Y. (1995) Controlling the false discovery rate: a practical and powerful approach to multiple testing. J. R. Stat. Soc. B, 57, 289–300.
