

Semi-blind sparse affine spectral unmixing of autofluorescence-contaminated micrographs
- PMID: 31504202
- PMCID: PMC7523684
- DOI: 10.1093/bioinformatics/btz674
Semi-blind sparse affine spectral unmixing of autofluorescence-contaminated micrographs
Abstract
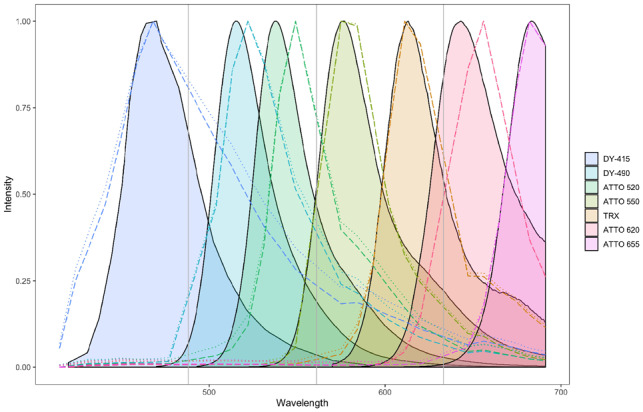
Motivation: Spectral unmixing methods attempt to determine the concentrations of different fluorophores present at each pixel location in an image by analyzing a set of measured emission spectra. Unmixing algorithms have shown great promise for applications where samples contain many fluorescent labels; however, existing methods perform poorly when confronted with autofluorescence-contaminated images.
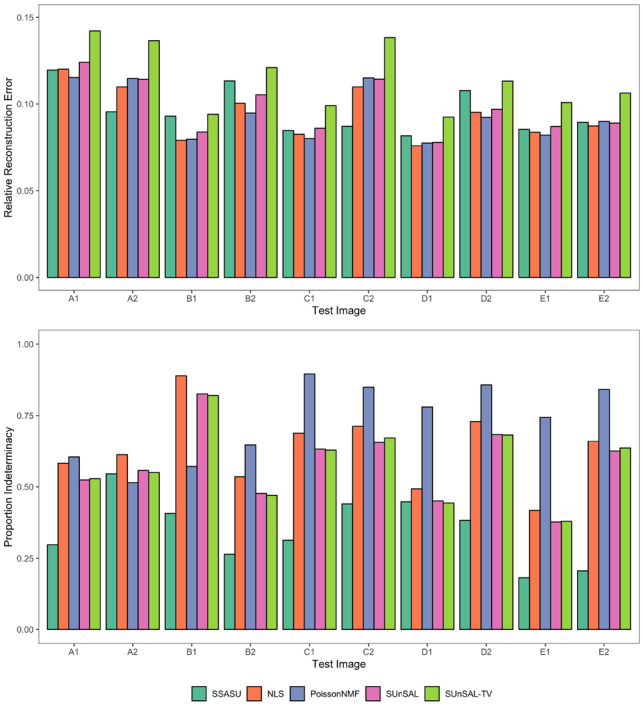
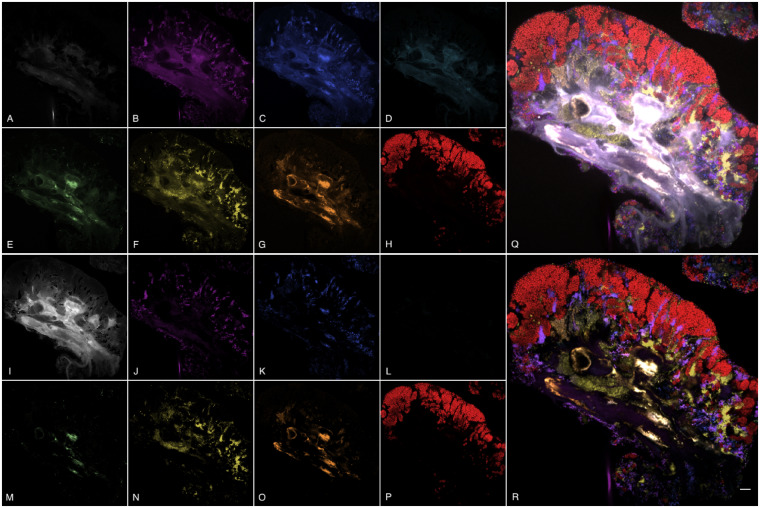
Results: We propose an unmixing algorithm designed to separate fluorophores with overlapping emission spectra from contamination by autofluorescence and background fluorescence. First, we formally define a generalization of the linear mixing model, called the affine mixture model (AMM), that specifically accounts for background fluorescence. Second, we use the AMM to derive an affine nonnegative matrix factorization method for estimating fluorophore endmember spectra from reference images. Lastly, we propose a semi-blind sparse affine spectral unmixing (SSASU) algorithm that uses knowledge of the estimated endmembers to learn the autofluorescence and background fluorescence spectra on a per-image basis. When unmixing real-world spectral images contaminated by autofluorescence, SSASU greatly improved proportion indeterminacy as compared to existing methods for a given relative reconstruction error.
Availability and implementation: The source code used for this paper was written in Julia and is available with the test data at https://github.com/brossetti/ssasu.
© The Author(s) 2019. Published by Oxford University Press. All rights reserved. For permissions, please e-mail: journals.permissions@oup.com.
Figures

Similar articles
-
BINGO: a blind unmixing algorithm for ultra-multiplexing fluorescence images.Bioinformatics. 2024 Feb 1;40(2):btae052. doi: 10.1093/bioinformatics/btae052. Bioinformatics. 2024. PMID: 38291952 Free PMC article.
-
Unmixing biological fluorescence image data with sparse and low-rank Poisson regression.Bioinformatics. 2023 Apr 3;39(4):btad159. doi: 10.1093/bioinformatics/btad159. Bioinformatics. 2023. PMID: 36964716 Free PMC article.
-
Robust blind spectral unmixing for fluorescence microscopy using unsupervised learning.PLoS One. 2019 Dec 2;14(12):e0225410. doi: 10.1371/journal.pone.0225410. eCollection 2019. PLoS One. 2019. PMID: 31790435 Free PMC article.
-
Spectral Unmixing Methods and Tools for the Detection and Quantitation of Collagen and Other Macromolecules in Tissue Specimens.Methods Mol Biol. 2017;1627:491-509. doi: 10.1007/978-1-4939-7113-8_30. Methods Mol Biol. 2017. PMID: 28836220 Review.
-
Deep data analysis via physically constrained linear unmixing: universal framework, domain examples, and a community-wide platform.Adv Struct Chem Imaging. 2018;4(1):6. doi: 10.1186/s40679-018-0055-8. Epub 2018 Apr 30. Adv Struct Chem Imaging. 2018. PMID: 29755927 Free PMC article. Review.
Cited by
-
BINGO: a blind unmixing algorithm for ultra-multiplexing fluorescence images.Bioinformatics. 2024 Feb 1;40(2):btae052. doi: 10.1093/bioinformatics/btae052. Bioinformatics. 2024. PMID: 38291952 Free PMC article.
-
Unmixing Biological Fluorescence Image Data with Sparse and Low-Rank Poisson Regression.bioRxiv [Preprint]. 2023 Jan 18:2023.01.06.523044. doi: 10.1101/2023.01.06.523044. bioRxiv. 2023. Update in: Bioinformatics. 2023 Apr 3;39(4):btad159. doi: 10.1093/bioinformatics/btad159. PMID: 36711559 Free PMC article. Updated. Preprint.
-
Unmixing biological fluorescence image data with sparse and low-rank Poisson regression.Bioinformatics. 2023 Apr 3;39(4):btad159. doi: 10.1093/bioinformatics/btad159. Bioinformatics. 2023. PMID: 36964716 Free PMC article.
-
Comparing Performance of Spectral Image Analysis Approaches for Detection of Cellular Signals in Time-Lapse Hyperspectral Imaging Fluorescence Excitation-Scanning Microscopy.Bioengineering (Basel). 2023 May 25;10(6):642. doi: 10.3390/bioengineering10060642. Bioengineering (Basel). 2023. PMID: 37370573 Free PMC article.
-
A Framework of Multi-View Machine Learning for Biological Spectral Unmixing of Fluorophores with Overlapping Excitation and Emission Spectra.bioRxiv [Preprint]. 2024 Aug 9:2024.08.07.607102. doi: 10.1101/2024.08.07.607102. bioRxiv. 2024. Update in: Brief Bioinform. 2024 Nov 22;26(1):bbaf005. doi: 10.1093/bib/bbaf005. PMID: 39149334 Free PMC article. Updated. Preprint.
References
-
- Arena E.T. et al. (2017) Quantitating the cell: turning images into numbers with Imagej. Wiley Interdiscipl. Rev. Dev. Biol., 6, e260. - PubMed
-
- Bioucas-Dias J.M., Figueiredo M.A. (2010) Alternating direction algorithms for constrained sparse regression: application to hyperspectral unmixing In: 2010 2nd Workshop on Hyperspectral Image and Signal Processing: Evolution in Remote Sensing. IEEE, pp. 1–4.
-
- Bioucas-Dias J.M. et al. (2012) Hyperspectral unmixing overview: geometrical, statistical, and sparse regression-based approaches. IEEE J. Select. Top. Appl. Earth Observ. Remote Sensing, 5, 354–379.
-
- Cichocki A. et al. (2009) Nonnegative Matrix and Tensor Factorizations: Applications to Exploratory Multi-Way Data Analysis and Blind Source Separation. John Wiley & Sons, Hoboken, NJ.
