. 2020 Feb 14;102(2):388-398.
doi: 10.1093/biolre/ioz175.

Consequences of negative energy balance on follicular development and oocyte quality in primiparous sows†

Affiliations

Consequences of negative energy balance on follicular development and oocyte quality in primiparous sows†

N G J Costermans et al. Biol Reprod. .

Abstract

Metabolic demands of modern hybrid sows have increased over the years, which increases the chance that sows enter a substantial negative energy balance (NEB) during lactation. This NEB can influence the development of follicles and oocytes that will give rise to the next litter. To study effects of a lactational NEB on follicular development, we used 36 primiparous sows of which 18 were subjected to feed restriction (3.25 kg/day) and 18 were full-fed (6.5 kg/day) during the last 2 weeks of a 24.1 ± 0.3 day lactation. Feed restriction resulted in a 70% larger lactational body weight loss and 76% higher longissimus dorsi depth loss, but similar amounts of backfat loss compared to the full fed sows. These changes were accompanied by lower plasma insulin-like growth factor 1 (IGF1) and higher plasma creatinine levels in the restricted sows from the last week of lactation onward. Ovaries were collected 48 h after weaning. Restricted sows had a lower average size of the 15 largest follicles (-26%) and cumulus-oocyte complexes showed less expansion after 22 h in vitro maturation (-26%). Less zygotes of restricted sows reached the metaphase stage 24 h after in vitro fertilization and showed a higher incidence of polyspermy (+89%). This shows that feed restriction had severe consequences on oocyte developmental competence. Follicular fluid of restricted sows had lower IGF1 (-56%) and steroid levels (e.g., β-estradiol, progestins, and androgens), which indicated that follicles of restricted sows were less competent to produce steroids and growth factors needed for oocytes to obtain full developmental competence.

Keywords: estradiol; follicle; follicular development; gonadal steroids; in vitro fertilization (IVF); in vitro maturation (IVM); insulin-like growth factor; lactation; metabolism; porcine; zygote.


Figures

Figure 1
Figure 1
Average daily feed intake (kg/day) of full-fed (FF) and restricted-fed (RES) primiparous sows. All sows received a similar gradually increasing level of a standard lactation diet up to 6 kg/day at day 10 of lactation. From day 10 until weaning at day 24, sows either received 6.5 or 3.25 kg/day, respectively. After weaning, all sows received 4 kg/day of the lactation diet.
Figure 2
Figure 2
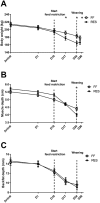
(A) Average body weight (kg), (B) longissimus dorsi muscle depth (mm), and (C) backfat depth (mm) for full-fed (FF) and restricted-fed (RES) primiparous sows, which received either 6.5 or 3.25 kg/day for the last 2 weeks of lactation. Body weight, loin muscle, and backfat depth were measured at arrival, the first day of lactation (D1), at the start of the feed restriction period (FR) (D10), 1 week after start of FR (D17) and at weaning (D24). Body weight was additionally measured at slaughter (D26). *P-value <0.05, + P-value >0.05 and <0.10. Parameters were always significantly different between days within treatment (P < 0.05), except for muscle depth at arrival and D1 for the FF sows.
Figure 3
Figure 3
Fasted plasma (A) creatinine, (B) IGF1, (C) basal insulin, (D) leptin, and (E) serum NEFA levels of full-fed (FF), and restricted-fed (RES) primiparous sows, which received either 6.5 or 3.25 kg/day for the last 2 weeks of lactation. Measurements were done at the first day of lactation (D1), 1 week after start of the feed restriction period (D17), at weaning (D24) and at slaughter (D26). *P-value < 0.05. The effect of measurement day for each parameter are depicted above the figures. Different letters indicate a significant difference between days within a treatment (abc for FF and xyz for RES).
Figure 4
Figure 4
(A) Total number of visible antral follicles in different size categories of both the left and right ovary. (B) Average follicle size of the 15 largest follicles of both the left and right ovary 48 h after weaning and (C) percentage healthy cumulus–oocyte complexes (COCs), average COC size at 0 h, percentage COC expansion at 22 h and fertilization rate of the successfully isolated COCs of the 15 largest follicles of the left ovary, and polyspermy (%) of the fertilized oocytes for full-fed and restricted-fed sows which received either 6.5 or 3.25 kg/day for the last 2 weeks of lactation. COCs were collected 48 h after weaning. *P-value <0.05, +P-value ≥0.05 and <0.10.
Figure 5
Figure 5
Developmental stage of the presumptive zygotes 24 h after IVF, for full-fed (FF) and restricted-fed (RES) sows, which received either 6.5 or 3.25 kg/day for the last 2 weeks of lactation. Cumulus–oocyte complexes were collected 48 h after weaning. PN0 = pronuclear stage 0, PN1–5 = pronuclear stage 1–5, G2 = 2-cell stage as an average percentage of the total number of zygotes of each animal (total number of zygotes = 6.8 ± 0.6 vs. 4.0 ± 0.6 for FF and RES, respectively). *P-value <0.05.
Figure 6
Figure 6
Follicular fluid steroid profile measured 48 h after weaning, of full-fed (FF) and restricted-fed (RES) sows that received either 6.5 or 3.25 kg/day for the last 2 weeks of lactation. *P-value <0.05 +P-value ≥0.05 and <0.10.
Figure 7
Figure 7
(A) Follicular fluid levels of insulin-like growth factor 1 (IGF1) of full-fed (FF) and restricted-fed (RES) sows that received either 6.5 or 3.25 kg/day for the last 2 weeks of lactation and relation between follicular fluid IGF1 levels (ng/ml) and (B) plasma IGF1 levels at slaughter (48 h after weaning) (C) average follicle size of the 15 largest follicles of both the left and right ovary or (D) COC expansion (%) 22 h after start of IVM of the 15 largest follicles of the left ovary. Ovaries were obtained 48 h after weaning. Relations were corrected for treatment. Interactions with treatment were never significant. *P-value <0.05.
Figure 8
Figure 8
Relations between average follicle size (mm) of the 15 largest follicles of both left and right ovary as measured 48 h after weaning and (A) muscle depth loss (mm) during lactation (B) backfat depth loss (mm) during lactation (C) plasma creatinine (mg/dL) at weaning and (D) plasma leptin (ng/mL) at weaning. Relations were corrected for treatment. **P-value <0.01,*P-value <0.05, +P-value ≥0.05 and <0.10.

Similar articles

Cited by

References

    1. Bergsma R, Kanis E, Verstegen M, van der Peet–Schwering C, Knol E. Lactation efficiency as a result of body composition dynamics and feed intake in sows. Livest Sci 2009; 125(2):208–222.
    1. Strathe AV, Bruun TS, Hansen CF.. Sows with high milk production had both a high feed intake and high body mobilization. Animal 2017; 11(11):1913–1921. - PubMed
    1. Thaker MYC, Bilkei G.. Lactation weight loss influences subsequent reproductive performance of sows. Anim Reprod Sci 2005; 88(3–4):309–318. - PubMed
    1. Hoving L, Soede N, Graat E, Feitsma H, Kemp B.. Effect of live weight development and reproduction in first parity on reproductive performance of second parity sows. Anim Reprod Sci 2010; 122(1–2):82–89. - PubMed
    1. Schenkel A, Bernardi M, Bortolozzo F, Wentz I.. Body reserve mobilization during lactation in first parity sows and its effect on second litter size. Livest Sci 2010; 132(1–3):165–172.

Publication types