

Enrichment of ovine gonadotropes via adenovirus gene targeting enhances assessment of transcriptional changes in response to estradiol-17 beta†
- PMID: 31504222
- PMCID: PMC7443347
- DOI: 10.1093/biolre/ioz166
Enrichment of ovine gonadotropes via adenovirus gene targeting enhances assessment of transcriptional changes in response to estradiol-17 beta†
Abstract
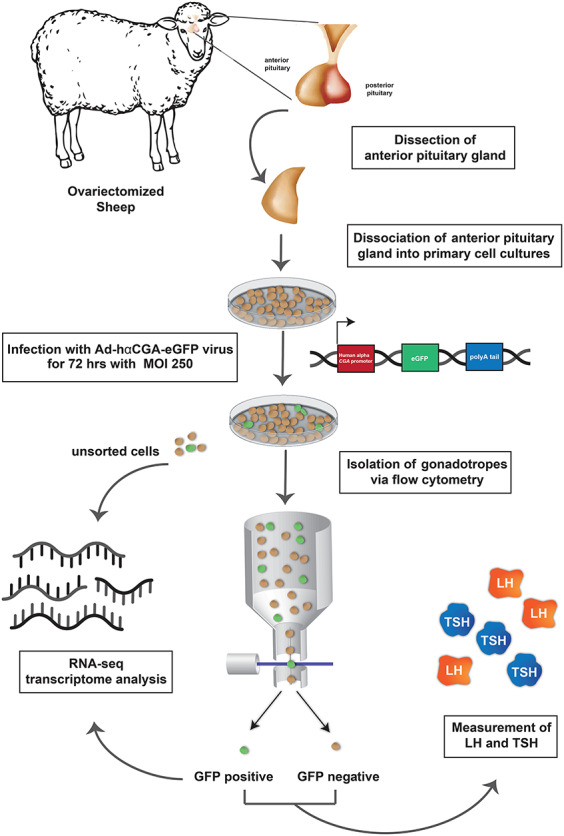
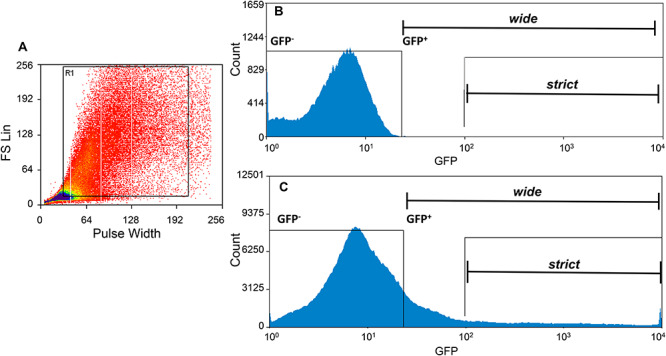
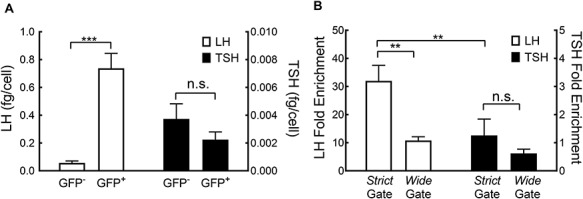
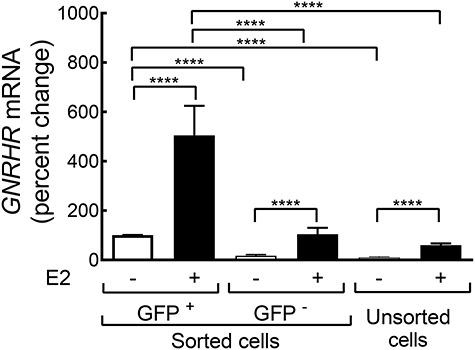
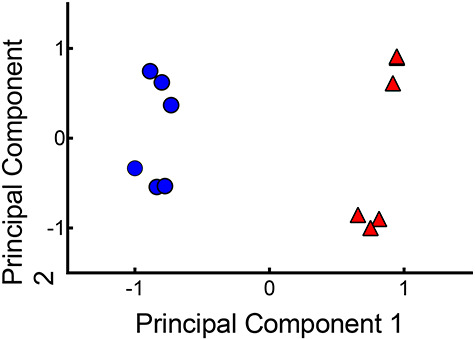
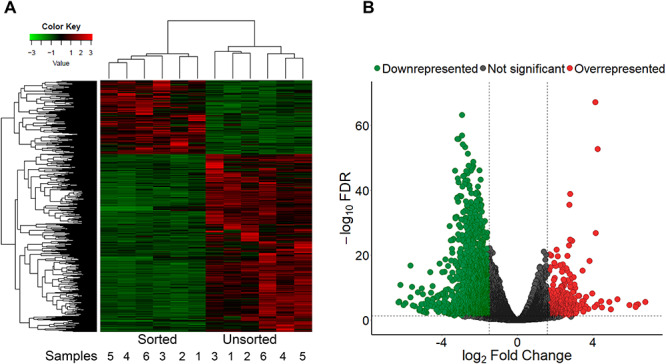
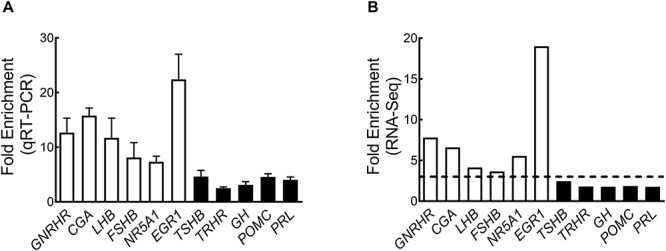
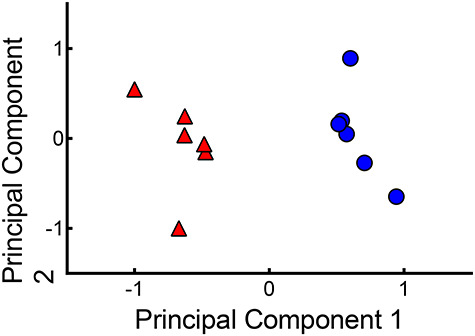
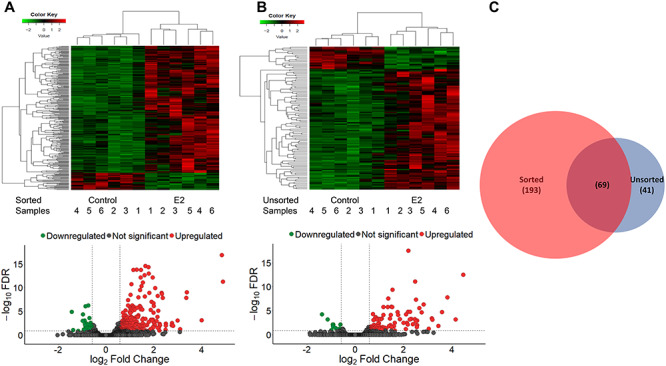
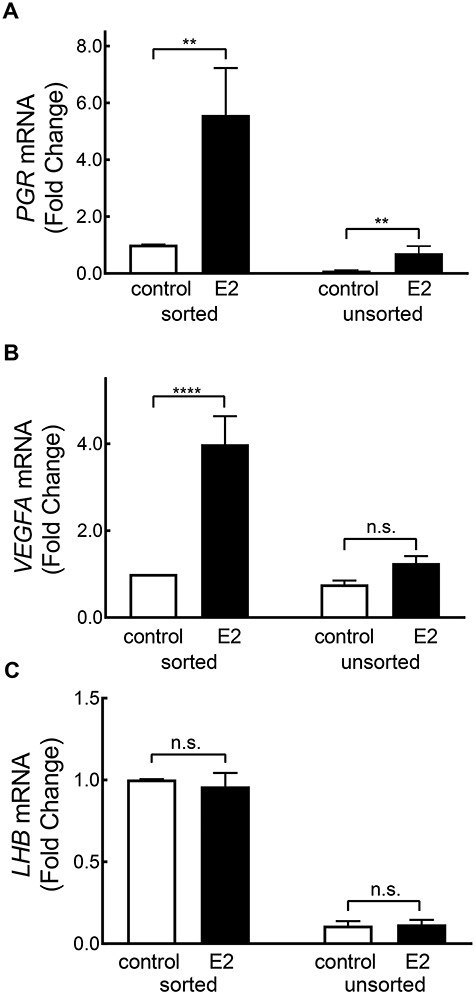
Gonadotropes represent approximately 5-15% of the total endocrine cell population in the mammalian anterior pituitary. Therefore, assessing the effects of experimental manipulation on virtually any parameter of gonadotrope biology is difficult to detect and parse from background noise. In non-rodent species, applying techniques such as high-throughput ribonucleic acid (RNA) sequencing is problematic due to difficulty in isolating and analyzing individual endocrine cell populations. Herein, we exploited cell-specific properties inherent to the proximal promoter of the human glycoprotein hormone alpha subunit gene (CGA) to genetically target the expression of a fluorescent reporter (green fluorescent protein [GFP]) selectively to ovine gonadotropes. Dissociated ovine pituitary cells were cultured and infected with an adenoviral reporter vector (Ad-hαCGA-eGFP). We established efficient gene targeting by successfully enriching dispersed GFP-positive cells with flow cytometry. Confirming enrichment of gonadotropes specifically, we detected elevated levels of luteinizing hormone (LH) but not thyrotropin-stimulating hormone (TSH) in GFP-positive cell populations compared to GFP-negative populations. Subsequently, we used next-generation sequencing to obtain the transcriptional profile of GFP-positive ovine gonadotropes in the presence or absence of estradiol 17-beta (E2), a key modulator of gonadotrope function. Compared to non-sorted cells, enriched GFP-positive cells revealed a distinct transcriptional profile consistent with established patterns of gonadotrope gene expression. Importantly, we also detected nearly 200 E2-responsive genes in enriched gonadotropes, which were not apparent in parallel experiments on non-enriched cell populations. From these data, we conclude that CGA-targeted adenoviral gene transfer is an effective means for selectively labeling and enriching ovine gonadotropes suitable for investigation by numerous experimental approaches.
Keywords: anterior pituitary; gonadotropin-releasing hormone (GnRH/GnRH receptor): ovine/sheep; transcription.
© The Author(s) 2019. Published by Oxford University Press on behalf of Society for the Study of Reproduction. All rights reserved. For permissions, please e-mail: journals.permissions@oup.com.
Figures
Similar articles
-
Plasticity of Anterior Pituitary Gonadotrope Cells Facilitates the Pre-Ovulatory LH Surge.Front Endocrinol (Lausanne). 2021 Feb 4;11:616053. doi: 10.3389/fendo.2020.616053. eCollection 2020. Front Endocrinol (Lausanne). 2021. PMID: 33613451 Free PMC article. Review.
-
Gonadotrope-specific expression and regulation of ovine follicle stimulating hormone Beta: transgenic and adenoviral approaches using primary murine gonadotropes.PLoS One. 2013 Jul 18;8(7):e66852. doi: 10.1371/journal.pone.0066852. Print 2013. PLoS One. 2013. PMID: 23874399 Free PMC article.
-
Cell-specific transcriptional regulation of follicle-stimulating hormone-beta by activin and gonadotropin-releasing hormone in the LbetaT2 pituitary gonadotrope cell model.Endocrinology. 2001 Jun;142(6):2284-95. doi: 10.1210/endo.142.6.8185. Endocrinology. 2001. PMID: 11356674
-
Effects of diethylstilbestrol on luteinizing hormone-producing cells in the mouse anterior pituitary.Exp Biol Med (Maywood). 2014 Mar;239(3):311-9. doi: 10.1177/1535370213519722. Epub 2014 Feb 12. Exp Biol Med (Maywood). 2014. PMID: 24521563
-
Embryonic development of gonadotrope cells and gonadotropic hormones--lessons from model fish.Mol Cell Endocrinol. 2014 Mar 25;385(1-2):18-27. doi: 10.1016/j.mce.2013.10.016. Epub 2013 Oct 18. Mol Cell Endocrinol. 2014. PMID: 24145126 Review.
Cited by
-
Plasticity of Anterior Pituitary Gonadotrope Cells Facilitates the Pre-Ovulatory LH Surge.Front Endocrinol (Lausanne). 2021 Feb 4;11:616053. doi: 10.3389/fendo.2020.616053. eCollection 2020. Front Endocrinol (Lausanne). 2021. PMID: 33613451 Free PMC article. Review.
-
Evidence for divergent endocrine regulation of the murine and ovine GnRH receptor gene promoters.Front Endocrinol (Lausanne). 2025 Jul 29;16:1597028. doi: 10.3389/fendo.2025.1597028. eCollection 2025. Front Endocrinol (Lausanne). 2025. PMID: 40801031 Free PMC article.
References
-
- Berga S, Naftolin F. Neuroendocrine control of ovulation. Gynecol Endocrinol 2012; 28 (Suppl 1):9–13. - PubMed
-
- Turzillo AM, Nett TM. Regulation of GnRH receptor gene expression in sheep and cattle. J Reprod Fertil Suppl 1999; 54:75–86. - PubMed
-
- Duval DL. Responsiveness of the ovine gonadotropin-releasing hormone receptor gene to estradiol and gonadotropin-releasing hormone is not detectable in vitro but is revealed in transgenic mice. Endocrinology 2000; 141:1001–1010. - PubMed
-
- Ordög T, Goldsmith JR, Chen MD, Connaughton MA, Hotchkiss J, Knobil E. On the mechanism of the positive feedback action of estradiol on luteinizing hormone secretion in the rhesus monkey. J Clin Endocrinol Metab 1998; 83:4047–4053. - PubMed
-
- Wildt L, Hausler A, Hutchsion JS, Marshall G, Knobil E. Estradiol as a gonadotropin releasing hormone in the rhesus monkey. Endocrinology 1981; 108:2011–2013. - PubMed
MeSH terms
Substances
Grants and funding
LinkOut - more resources
Full Text Sources
Molecular Biology Databases
Research Materials
