

Multidirectional wall shear stress promotes advanced coronary plaque development: comparing five shear stress metrics
- PMID: 31504238
- PMCID: PMC7177495
- DOI: 10.1093/cvr/cvz212
Multidirectional wall shear stress promotes advanced coronary plaque development: comparing five shear stress metrics
Abstract
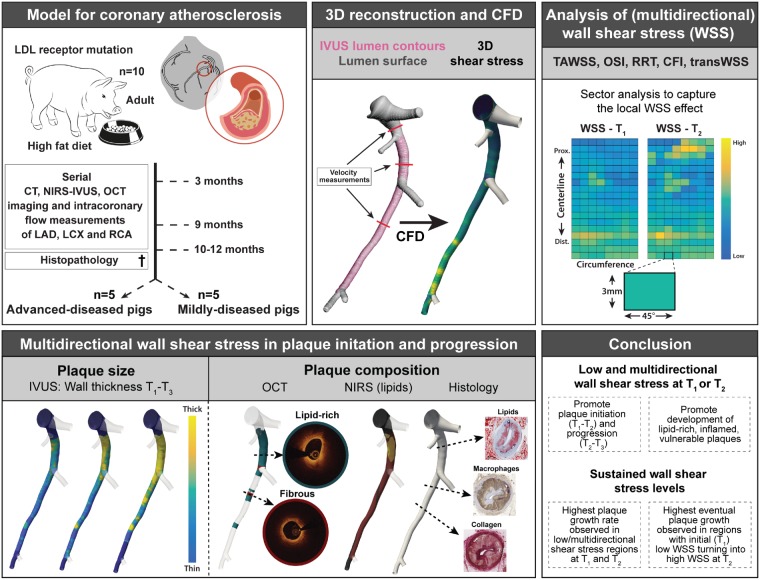
Aims: Atherosclerotic plaque development has been associated with wall shear stress (WSS). However, the multidirectionality of blood flow, and thus of WSS, is rarely taken into account. The purpose of this study was to comprehensively compare five metrics that describe (multidirectional) WSS behaviour and assess how WSS multidirectionality affects coronary plaque initiation and progression.
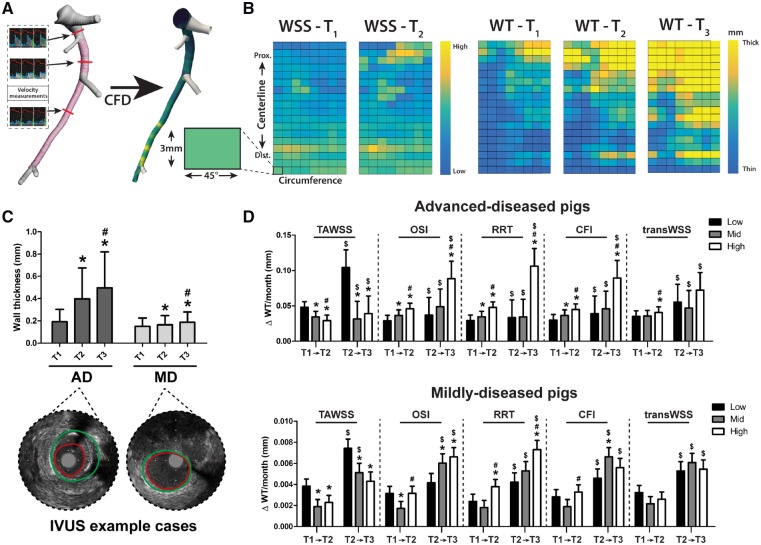
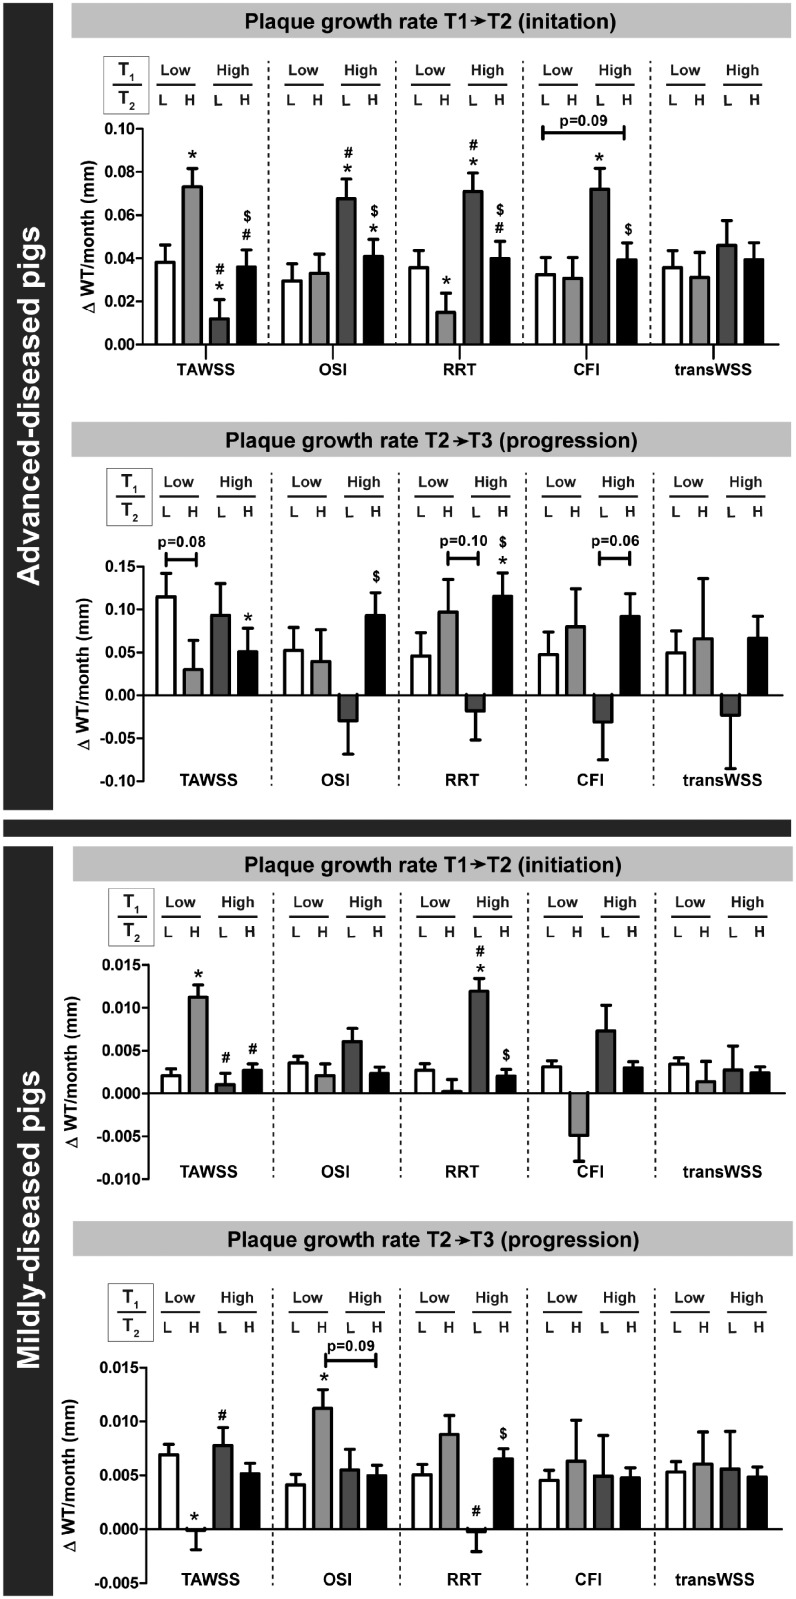
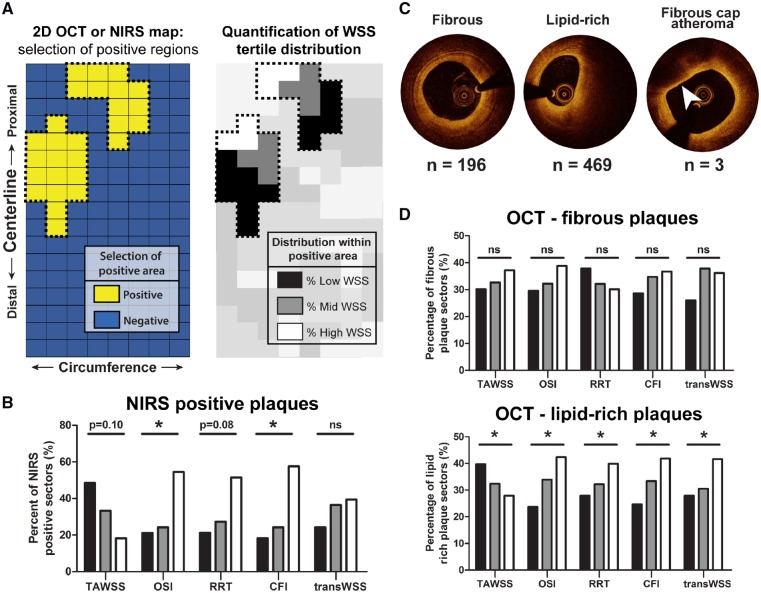
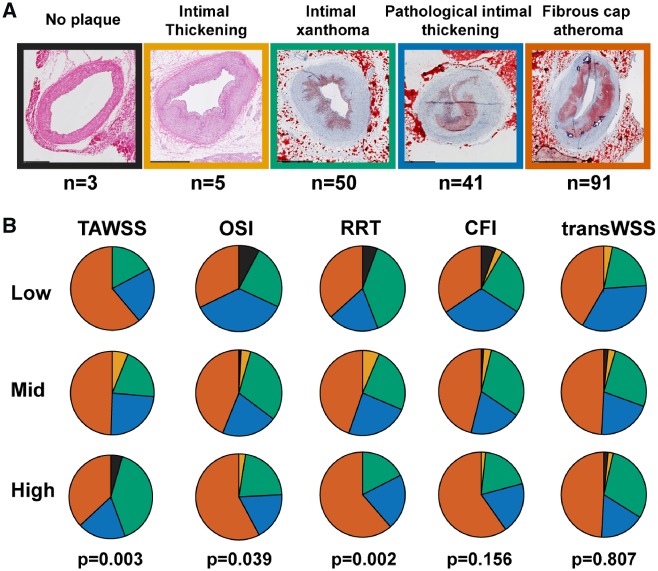
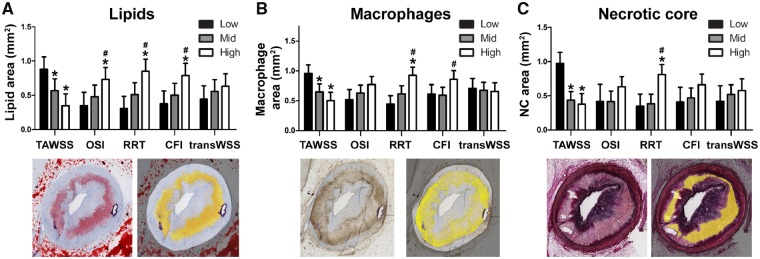
Methods and results: Adult familial hypercholesterolaemic pigs (n = 10) that were fed a high-fat diet, underwent imaging of the three main coronary arteries at three-time points [3 (T1), 9 (T2), and 10-12 (T3) months]. Three-dimensional geometry of the arterial lumen, in combination with local flow velocity measurements, was used to calculate WSS at T1 and T2. For analysis, arteries were divided into 3 mm/45° sectors (n = 3648). Changes in wall thickness and final plaque composition were assessed with near-infrared spectroscopy-intravascular ultrasound, optical coherence tomography imaging, and histology. Both in pigs with advanced and mild disease, the highest plaque progression rate was exclusively found at low time-averaged WSS (TAWSS) or high multidirectional WSS regions at both T1 and T2. However, the eventually largest plaque growth was located in regions with initial low TAWSS or high multidirectional WSS that, over time, became exposed to high TAWSS or low multidirectional WSS at T2. Besides plaque size, also the presence of vulnerable plaque components at the last time point was related to low and multidirectional WSS. Almost all WSS metrics had good predictive values for the development of plaque (47-50%) and advanced fibrous cap atheroma (FCA) development (59-61%).
Conclusion: This study demonstrates that low and multidirectional WSS promote both initiation and progression of coronary atherosclerotic plaques. The high-predictive values of the multidirectional WSS metrics for FCA development indicate their potential as an additional clinical marker for the vulnerable disease.
Keywords: Atherosclerosis; Coronary artery disease; Histopathology; Invasive imaging; Wall shear stress.
© The Author(s) 2019. Published by Oxford University Press on behalf of the European Society of Cardiology.
Figures
Similar articles
-
The influence of multidirectional shear stress on plaque progression and composition changes in human coronary arteries.EuroIntervention. 2019 Oct 20;15(8):692-699. doi: 10.4244/EIJ-D-18-00529. EuroIntervention. 2019. PMID: 30860071
-
The impact of helical flow on coronary atherosclerotic plaque development.Atherosclerosis. 2020 May;300:39-46. doi: 10.1016/j.atherosclerosis.2020.01.027. Epub 2020 Feb 7. Atherosclerosis. 2020. PMID: 32085872
-
Wall shear stress-related plaque growth of lipid-rich plaques in human coronary arteries: an near-infrared spectroscopy and optical coherence tomography study.Cardiovasc Res. 2023 May 2;119(4):1021-1029. doi: 10.1093/cvr/cvac178. Cardiovasc Res. 2023. PMID: 36575921 Free PMC article.
-
High Coronary Wall Shear Stress Worsens Plaque Vulnerability: A Systematic Review and Meta-Analysis.Angiology. 2021 Sep;72(8):706-714. doi: 10.1177/0003319721991722. Epub 2021 Feb 4. Angiology. 2021. PMID: 33535802 Free PMC article.
-
Risk stratification of coronary plaques using physiologic characteristics by CCTA: Focus on shear stress.J Cardiovasc Comput Tomogr. 2020 Sep-Oct;14(5):386-393. doi: 10.1016/j.jcct.2019.11.012. Epub 2019 Dec 4. J Cardiovasc Comput Tomogr. 2020. PMID: 31870744 Free PMC article. Review.
Cited by
-
A new understanding of coronary curvature and haemodynamic impact on the course of plaque onset and progression.R Soc Open Sci. 2024 Sep 11;11(9):241267. doi: 10.1098/rsos.241267. eCollection 2024 Sep. R Soc Open Sci. 2024. PMID: 39309260 Free PMC article.
-
Comprehensive biomechanical and anatomical atherosclerotic plaque metrics predict major adverse cardiovascular events: A new tool for clinical decision making.Atherosclerosis. 2024 Mar;390:117449. doi: 10.1016/j.atherosclerosis.2024.117449. Epub 2024 Jan 11. Atherosclerosis. 2024. PMID: 38262275 Free PMC article.
-
Predicting Lipid-Rich Plaque Progression in Coronary Arteries Using Multimodal Imaging and Wall Shear Stress Signatures.Arterioscler Thromb Vasc Biol. 2024 Apr;44(4):976-986. doi: 10.1161/ATVBAHA.123.320337. Epub 2024 Feb 8. Arterioscler Thromb Vasc Biol. 2024. PMID: 38328935 Free PMC article.
-
Rapid prediction of wall shear stress in stenosed coronary arteries based on deep learning.Front Bioeng Biotechnol. 2024 Aug 12;12:1360330. doi: 10.3389/fbioe.2024.1360330. eCollection 2024. Front Bioeng Biotechnol. 2024. PMID: 39188371 Free PMC article.
-
Medical Image-Based Computational Fluid Dynamics and Fluid-Structure Interaction Analysis in Vascular Diseases.Front Bioeng Biotechnol. 2022 Apr 27;10:855791. doi: 10.3389/fbioe.2022.855791. eCollection 2022. Front Bioeng Biotechnol. 2022. PMID: 35573253 Free PMC article. Review.
References
-
- Chatzizisis YS, Jonas M, Coskun AU, Beigel R, Stone BV, Maynard C, Gerrity RG, Daley W, Rogers C, Edelman ER, Feldman CL, Stone PH.. Prediction of the localization of high-risk coronary atherosclerotic plaques on the basis of low endothelial shear stress-an intravascular ultrasound and histopathology natural history study. Circulation 2008;117:993–1002. - PubMed
-
- Koskinas KC, Chatzizisis YS, Papafaklis MI, Coskun AU, Baker AB, Jarolim P, Antoniadis A, Edelman ER, Stone PH, Feldman CL.. Synergistic effect of local endothelial shear stress and systemic hypercholesterolemia on coronary atherosclerotic plaque progression and composition in pigs. Int J Cardiol 2013;169:394–401. - PMC - PubMed
-
- Stone PH, Saito S, Takahashi S, Makita Y, Nakamura S, Kawasaki T, Takahashi A, Katsuki T, Nakamura S, Namiki A, Hirohata A, Matsumura T, Yamazaki S, Yokoi H, Tanaka S, Otsuji S, Yoshimachi F, Honye J, Harwood D, Reitman M, Coskun AU, Papafaklis MI, Feldman CL; PREDICTION Investigators. Prediction of progression of coronary artery disease and clinical outcomes using vascular profiling of endothelial shear stress and arterial plaque characteristics: the PREDICTION Study. Circulation 2012;126:172–181. - PubMed
Publication types
MeSH terms
LinkOut - more resources
Full Text Sources
Other Literature Sources
Medical
Research Materials
Miscellaneous
