

Overexpression of p53 due to excess protein O-GlcNAcylation is associated with coronary microvascular disease in type 2 diabetes
- PMID: 31504245
- PMCID: PMC7177511
- DOI: 10.1093/cvr/cvz216
Overexpression of p53 due to excess protein O-GlcNAcylation is associated with coronary microvascular disease in type 2 diabetes
Abstract
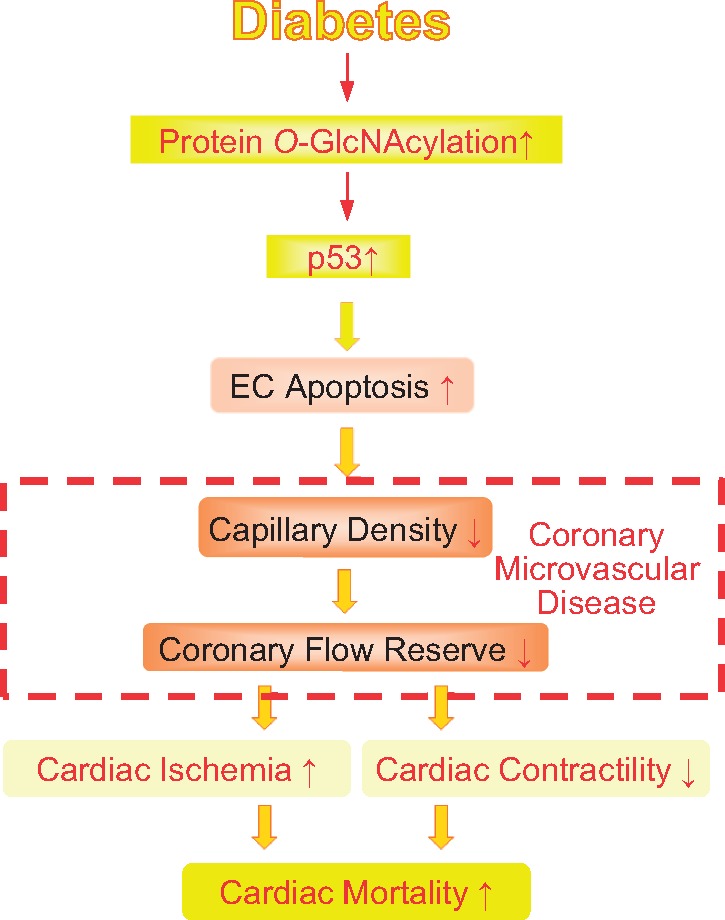
Aims: We previously reported that increased protein O-GlcNAcylation in diabetic mice led to vascular rarefaction in the heart. In this study, we aimed to investigate whether and how coronary endothelial cell (EC) apoptosis is enhanced by protein O-GlcNAcylation and thus induces coronary microvascular disease (CMD) and subsequent cardiac dysfunction in diabetes. We hypothesize that excessive protein O-GlcNAcylation increases p53 that leads to CMD and reduced cardiac contractility.
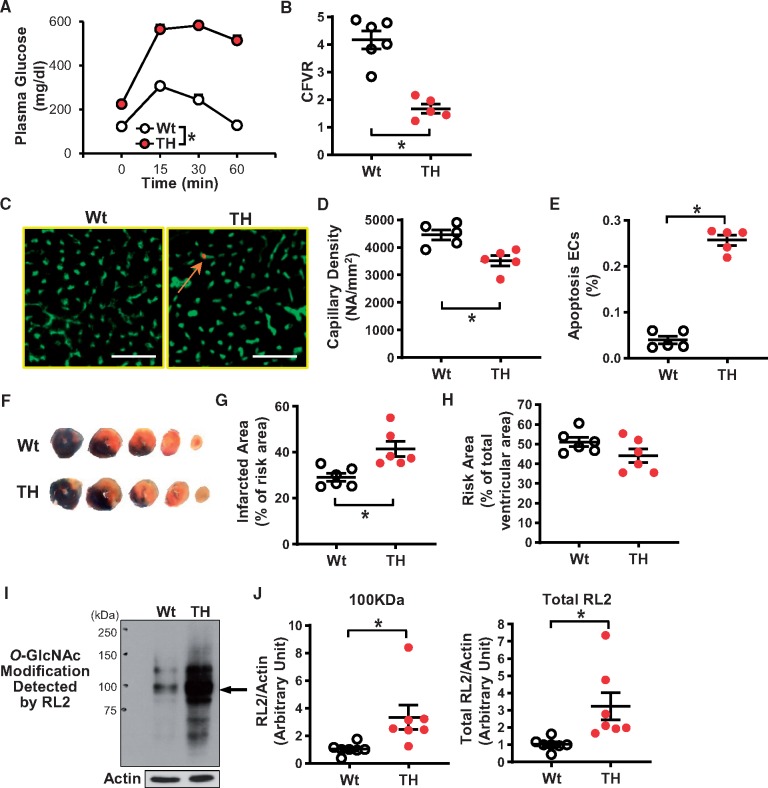
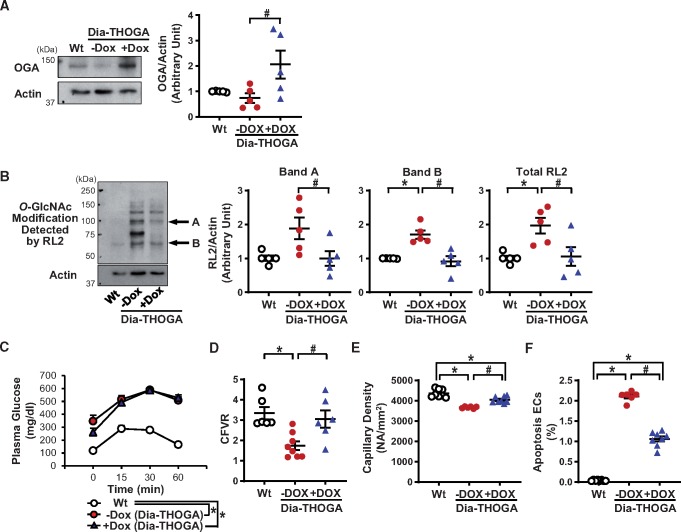
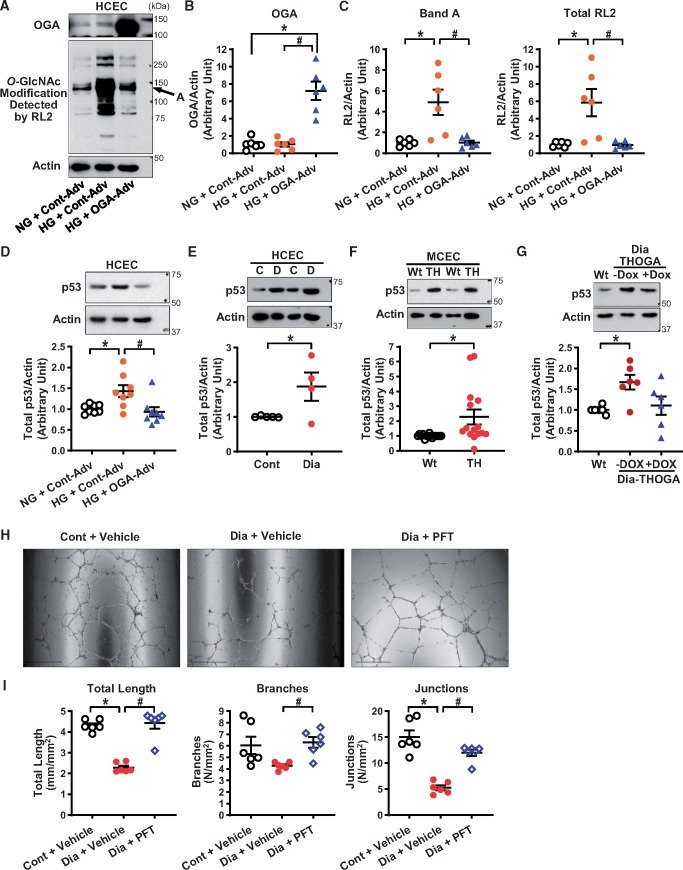
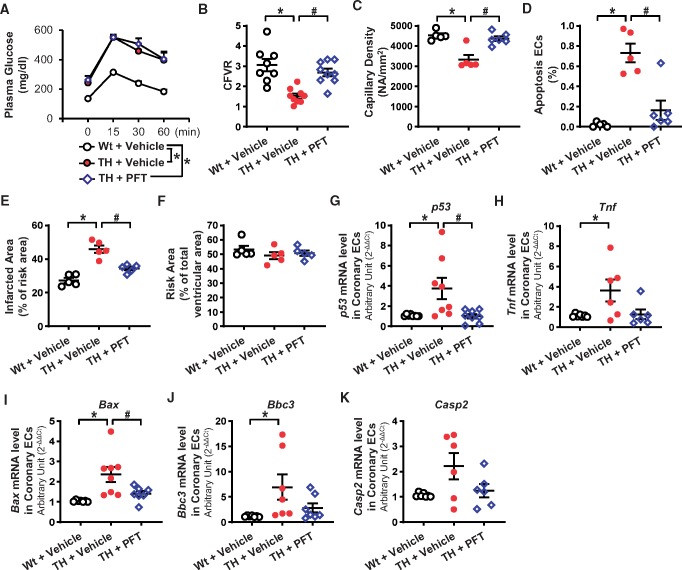
Methods and results: We conducted in vivo functional experiments in control mice, TALLYHO/Jng (TH) mice, a polygenic type 2 diabetic (T2D) model, and EC-specific O-GlcNAcase (OGA, an enzyme that catalyzes the removal of O-GlcNAc from proteins)-overexpressing TH mice, as well as in vitro experiments in isolated ECs from these mice. TH mice exhibited a significant increase in coronary EC apoptosis and reduction of coronary flow velocity reserve (CFVR), an assessment of coronary microvascular function, in comparison to wild-type mice. The decreased CFVR, due at least partially to EC apoptosis, was associated with decreased cardiac contractility in TH mice. Western blot experiments showed that p53 protein level was significantly higher in coronary ECs from TH mice and T2D patients than in control ECs. High glucose treatment also increased p53 protein level in control ECs. Furthermore, overexpression of OGA decreased protein O-GlcNAcylation and down-regulated p53 in coronary ECs, and conferred a protective effect on cardiac function in TH mice. Inhibition of p53 with pifithrin-α attenuated coronary EC apoptosis and restored CFVR and cardiac contractility in TH mice.
Conclusions: The data from this study indicate that inhibition of p53 or down-regulation of p53 by OGA overexpression attenuates coronary EC apoptosis and improves CFVR and cardiac function in diabetes. Lowering coronary endothelial p53 levels via OGA overexpression could be a potential therapeutic approach for CMD in diabetes.
Keywords: Apoptosis; Capillaries; Cardiovascular disease; Coronary blood flow; Coronary microcirculation.
Published on behalf of the European Society of Cardiology. All rights reserved. © The Author(s) 2019. For permissions, please email: journals.permissions@oup.com.
Figures
Similar articles
-
Restoration of coronary microvascular function by OGA overexpression in a high-fat diet with low-dose streptozotocin-induced type 2 diabetic mice.Diab Vasc Dis Res. 2023 May-Jun;20(3):14791641231173630. doi: 10.1177/14791641231173630. Diab Vasc Dis Res. 2023. PMID: 37186669 Free PMC article.
-
O-GlcNAcase overexpression reverses coronary endothelial cell dysfunction in type 1 diabetic mice.Am J Physiol Cell Physiol. 2015 Nov 1;309(9):C593-9. doi: 10.1152/ajpcell.00069.2015. Epub 2015 Aug 12. Am J Physiol Cell Physiol. 2015. PMID: 26269457 Free PMC article.
-
AGEs exacerbates coronary microvascular dysfunction in NoCAD by activating endoplasmic reticulum stress-mediated PERK signaling pathway.Metabolism. 2021 Apr;117:154710. doi: 10.1016/j.metabol.2021.154710. Epub 2021 Jan 22. Metabolism. 2021. PMID: 33485865
-
Revascularisation of type 2 diabetics with coronary artery disease: Insights and therapeutic targeting of O-GlcNAcylation.Nutr Metab Cardiovasc Dis. 2021 May 6;31(5):1349-1356. doi: 10.1016/j.numecd.2021.01.017. Epub 2021 Feb 2. Nutr Metab Cardiovasc Dis. 2021. PMID: 33812732 Review.
-
Experimental animal models of coronary microvascular dysfunction.Cardiovasc Res. 2020 Mar 1;116(4):756-770. doi: 10.1093/cvr/cvaa002. Cardiovasc Res. 2020. PMID: 31926020 Free PMC article. Review.
Cited by
-
The dual role of the hexosamine biosynthetic pathway in cardiac physiology and pathophysiology.Front Endocrinol (Lausanne). 2022 Oct 24;13:984342. doi: 10.3389/fendo.2022.984342. eCollection 2022. Front Endocrinol (Lausanne). 2022. PMID: 36353238 Free PMC article. Review.
-
Restoration of coronary microvascular function by OGA overexpression in a high-fat diet with low-dose streptozotocin-induced type 2 diabetic mice.Diab Vasc Dis Res. 2023 May-Jun;20(3):14791641231173630. doi: 10.1177/14791641231173630. Diab Vasc Dis Res. 2023. PMID: 37186669 Free PMC article.
-
Research Progress of N6-Methyladenosine in the Cardiovascular System.Med Sci Monit. 2020 Apr 30;26:e921742. doi: 10.12659/MSM.921742. Med Sci Monit. 2020. PMID: 32350237 Free PMC article. Review.
-
Enhanced lung endothelial glycolysis is implicated in the development of severe pulmonary hypertension in type 2 diabetes.Am J Physiol Lung Cell Mol Physiol. 2025 Mar 1;328(3):L430-L442. doi: 10.1152/ajplung.00305.2023. Epub 2024 Oct 22. Am J Physiol Lung Cell Mol Physiol. 2025. PMID: 39437763 Free PMC article.
-
The Molecular Mechanisms of Cuproptosis and Small-Molecule Drug Design in Diabetes Mellitus.Molecules. 2024 Jun 15;29(12):2852. doi: 10.3390/molecules29122852. Molecules. 2024. PMID: 38930917 Free PMC article. Review.
References
-
- Erdogan D, Yucel H, Uysal BA, Ersoy IH, Icli A, Akcay S, Arslan A, Aksoy F, Ozaydin M, Tamer MN.. Effects of prediabetes and diabetes on left ventricular and coronary microvascular functions. Metabolism 2013;62:1123–1130. - PubMed
-
- Camici PG, d'Amati G, Rimoldi O.. Coronary microvascular dysfunction: mechanisms and functional assessment. Nat Rev Cardiol 2015;12:48–62. - PubMed
-
- Dean J, Cruz SD, Mehta PK, Merz CN.. Coronary microvascular dysfunction: sex-specific risk, diagnosis, and therapy. Nat Rev Cardiol 2015;12:406–414. - PubMed
Publication types
MeSH terms
Substances
Grants and funding
LinkOut - more resources
Full Text Sources
Medical
Molecular Biology Databases
Research Materials
Miscellaneous
