. 2020 Jan 10;30(1):391-405.
doi: 10.1093/cercor/bhz139.

Direct Electrical Stimulation of Premotor Areas: Different Effects on Hand Muscle Activity during Object Manipulation

Affiliations

Direct Electrical Stimulation of Premotor Areas: Different Effects on Hand Muscle Activity during Object Manipulation

Luca Fornia et al. Cereb Cortex. .

Abstract

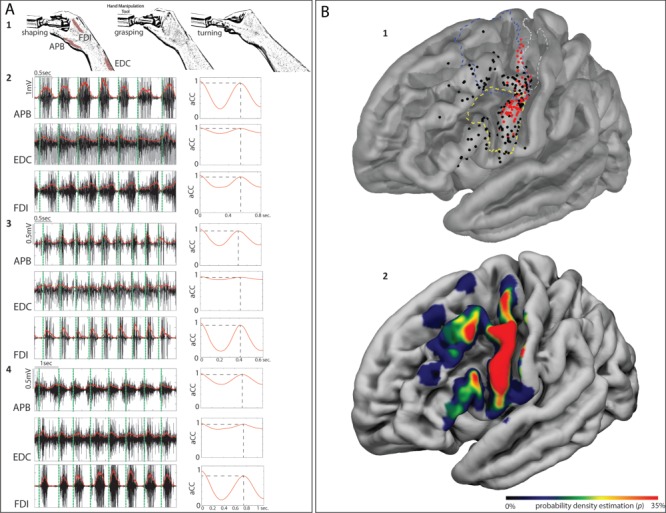
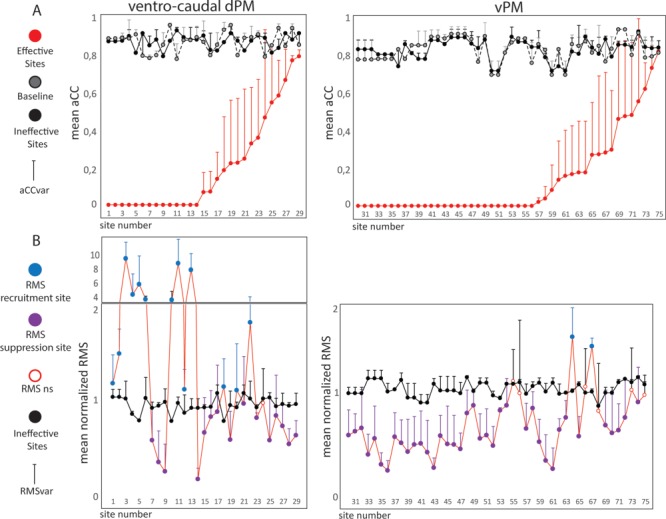
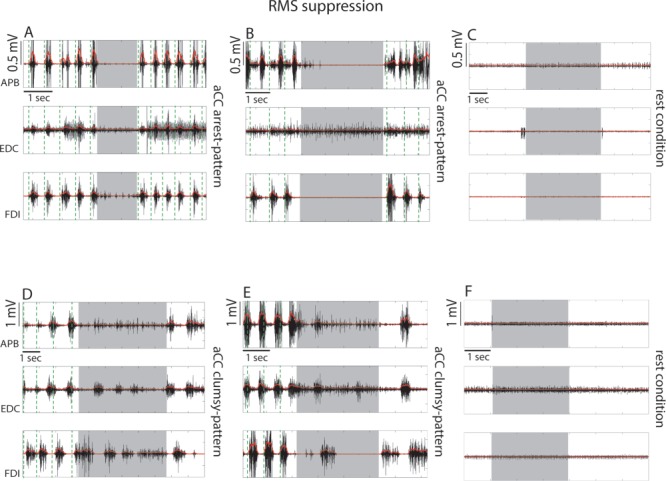
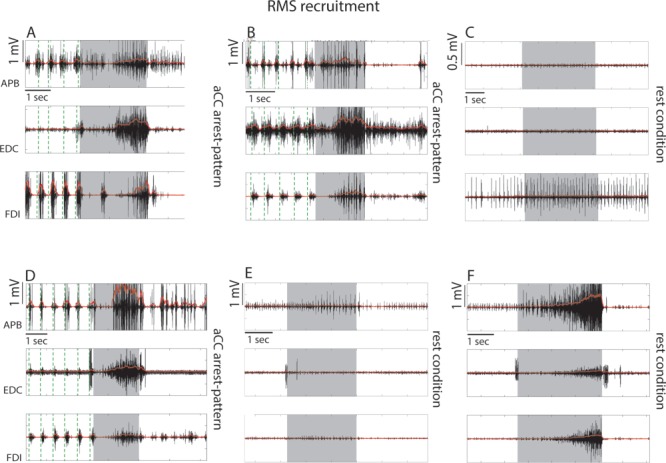
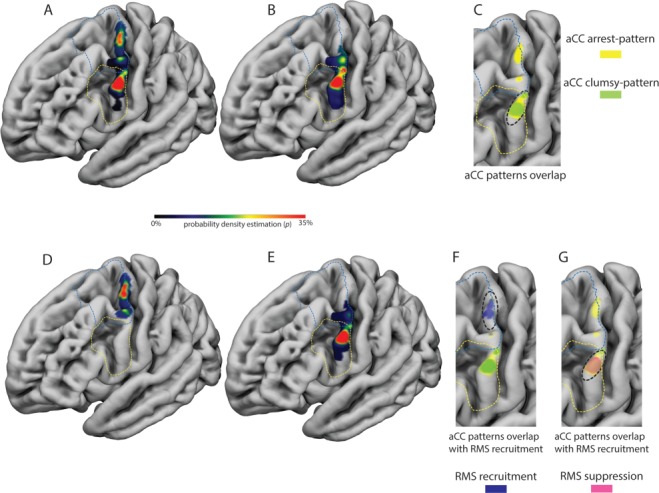
Dorsal and ventral premotor (dPM and vPM) areas are crucial in control of hand muscles during object manipulation, although their respective role in humans is still debated. In patients undergoing awake surgery for brain tumors, we studied the effect of direct electrical stimulation (DES) of the premotor cortex on the execution of a hand manipulation task (HMt). A quantitative analysis of the activity of extrinsic and intrinsic hand muscles recorded during and in absence of DES was performed. Results showed that DES applied to premotor areas significantly impaired HMt execution, affecting task-related muscle activity with specific features related to the stimulated area. Stimulation of dorsal vPM induced both a complete task arrest and clumsy task execution, characterized by general muscle suppression. Stimulation of ventrocaudal dPM evoked a complete task arrest mainly due to a dysfunctional recruitment of hand muscles engaged in task execution. These results suggest that vPM and dPM contribute differently to the control of hand muscles during object manipulation. Stimulation of both areas showed a significant impact on motor output, although the different effects suggest a stronger relationship of dPM with the corticomotoneuronal circuit promoting muscle recruitment and a role for vPM in supporting sensorimotor integration.

Keywords: EMG; hand manipulation; hand motor control; intraoperative brain mapping; premotor cortex.


Figures

Figure 1
Figure 1
(A) 1: schematic representation of HMt execution. 2, 3 and 4: examples of EMG activity from the muscles recorded during HMt execution (APB; FDI; EDC) in 3 different patients. On the right side of each muscle, activity is shown by the level of autocorrelation of the fundamental frequency extracted by the EMG envelope. On the EMG activity of each muscle, the vertical green dashed line indicates the time in which the patient approached the object (shaping). The time between green vertical dashed lines indicates the time required by each patient to shape the fingers immediately before the contact with the object, to grasp it, to rotate it and turning back to the initial shaping phase. (B) 1: Cortical distribution of the effective (red) and ineffective (black) sites on the 3D FSAverage template overlapped with functional subdivision of the motor (BA4 upper limb (BA4ul) in dashed gray line, Fan et al. 2016) and dPM (in dashed blue line, Mayka et al. 2006) and vPM (in dashed yellow line, Mayka et al. 2006). 2: The same template shows the sampling density of stimulated sites within the investigated areas.
Figure 2
Figure 2
(A) For each effective site the following is represented: the mean aCC value among muscles (red line and dot), the corresponding mean aCC value during baseline performance (gray dashed line and dot) and the mean aCC value during stimulation of the ineffective sites (black line and dot). The result is presented divided by different premotor areas, and the effective sites are ranked according to the aCC value from lowest to highest. For each dot the whisker indicates the aCCvar value. (B) Each dot represents the mean normalized RMS value among muscles for each effective site (red line) and the mean normalized RMS value among muscles for the corresponding ineffective sites (black line and dot). The effective sites are ranked according to Fig. 2A in order. effective sites are represented with a color code indicating the results of the comparison: blue dots represent the effective sites in which stimulation evoked a muscle recruitment (RMS recruitment sites); purple dots represent the effective sites in which stimulation inhibited the muscle recruitment (RMS suppression sites); white dots represent the effective sites in which no statistical differences were reported (RMS ns). For each dot the whisker indicates the RMSvar value.
Figure 3
Figure 3
Examples of single effective stimulations in 4 different patients resulting in RMS suppression responses when the dorsal sector of vPM was stimulated. The EMG activity of the APB, EDC, and FDI are shown as raw (black) and rectified signal (red). (A, B) Stimulation evoked a complete and sharp arrest of task execution concomitantly to a muscle suppression observed in all muscles. Effective sites characterized by this response belong to the “aCC-arrest pattern”. Stimulation of the same effective site showing response B, where stimulation of the hand at rest did not evoke significant muscle activity (C). (D, E) Stimulation evoked an arrest of task execution with a general muscle suppression although this was not homogeneously distributed in the different muscles. Effective sites characterized by this response belong to the “aCC-clumsy” pattern. Stimulation of the same effective site showing response E, with the hand at rest did not evoke significant muscle activity (F). Gray shadows in each graph indicate the time window of DES stimulation, while the green vertical dashed lines indicate the beginning of each task cycle behaviorally defined (see Fig. 1A).
Figure 4
Figure 4
Examples of single effective stimulations in 3 different patients resulting in RMS recruitment responses when ventrocaudal sector of dPM was stimulated. The EMG activity of the APB, EDC, and FDI are shown as raw signal (black) and rectified signal (red). (A, B, D). Stimulation evoked an involuntary hand–forearm movement interfering with task execution concomitantly to general muscle recruitment occurring in all muscles. The significant muscle recruitment obtained in each trial was preceded with a variable delay by a brief suppression-like effect. Effective site characterized by these responses belong to the “aCC-arrest” pattern. Stimulation of the same effective sites showing response B and D when the hand was at rest did not evoke significant muscle activity (C, E). (F) An example of stimulation in the rest condition of a site close to central sulcus (caudal hand-knob) in the same patient showing response D and E. In this case a significant muscle activation was evoked. Gray shadows in each graph indicate the time window of DES stimulation, while the green vertical dashed lines indicate the beginning of each task cycle behaviorally defined (see Fig. 1A).
Figure 5
Figure 5
(A) The distribution of the probability density estimation of the “aCC-arrest” pattern, characterized by fully compromised muscle performance is reported on the 3D FSAverage template. The aCC-arrest pattern was clustered in the dorsal sector of vPM and in the most dorsal investigated sector of dPM. (B) The distribution of the probability density estimation of the “aCC-clumsy pattern”, characterized by higher variability among muscle performance, is reported on the 3D FSAverage template. The aCC-clumsy pattern was clustered mainly in the dorsal sector of vPM and at the transition between vPM and dPM. (C) The two patterns completely overlap only in the dorsal sector of vPM (see black dashed line). (D) The distribution of the probability density estimation of the “RMS recruitment sites”, characterized by an involuntary movement and a general unspecific increase of muscles activity, is reported on the 3D FSAverage template. These sites were mainly localized in the most dorsal investigated sector of dPM. (E) The distribution of the probability density estimation of the “RMS suppression sites”, characterized by hand movement arrest and a general decrease of muscle activity, is reported on the 3D FSAverage template. These sites were mainly localized in the dorsal sector of vPM. (F) the RMS recruitment sites overlap with the dorsal spot hosting sites showing the aCC-arrest pattern (see black dashed line), while in (G) the RMS suppression sites overlap with both the most ventral sector of the aCC-arrest and clumsy patterns (see black dashed line).

Similar articles

Cited by

References

    1. Ashburner J, Friston KJ. 2005. Unified segmentation. Neuroimage. 26(3):839–851. - PubMed
    1. Bello L, Acerbi F, Giussani C, Baratta P, Taccone P, Songa V. 2006. Intraoperative language localization in multilingual patients with gliomas. Neurosurgery. 59:115–125. - PubMed
    1. Bello L, Riva M, Fava E, Ferpozzi V, Castellano A, Raneri F, Pessina F, Bizzi A, Falini A, Cerri G. 2014. Tailoring neurophysiological strategies with clinical context enhances resection and safety and expands indications in gliomas involving motor pathways. Neuro Oncol. 16:1110–1128. - PMC - PubMed
    1. Binkofski F, Buccino G, Posse S, Seitz RJ, Rizzolatti G, Freund H. 1999. A fronto-parietal circuit for object manipulation in man: evidence from an fMRI-study. Eur J Neurosci. 11:3276–3286. - PubMed
    1. Borra E, Gerbella M, Rozzi S, Luppino G. 2017. The macaque lateral grasping network: a neural substrate for generating purposeful hand actions. Neurosci Biobehav Rev. 75:65–90. - PubMed

Publication types