. 2020 May 1;116(6):1147-1160.
doi: 10.1093/cvr/cvz217.

Human iPSC modelling of a familial form of atrial fibrillation reveals a gain of function of If and ICaL in patient-derived cardiomyocytes

Affiliations

Human iPSC modelling of a familial form of atrial fibrillation reveals a gain of function of If and ICaL in patient-derived cardiomyocytes

Patrizia Benzoni et al. Cardiovasc Res. .

Abstract

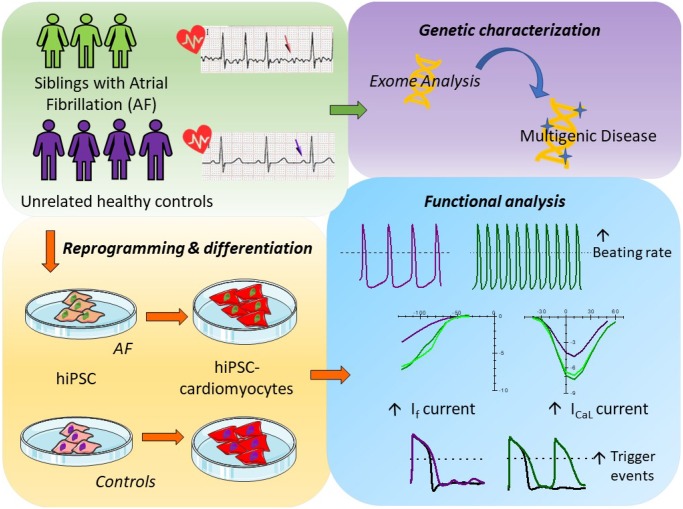
Aims: Atrial fibrillation (AF) is the most common type of cardiac arrhythmias, whose incidence is likely to increase with the aging of the population. It is considered a progressive condition, frequently observed as a complication of other cardiovascular disorders. However, recent genetic studies revealed the presence of several mutations and variants linked to AF, findings that define AF as a multifactorial disease. Due to the complex genetics and paucity of models, molecular mechanisms underlying the initiation of AF are still poorly understood. Here we investigate the pathophysiological mechanisms of a familial form of AF, with particular attention to the identification of putative triggering cellular mechanisms, using patient's derived cardiomyocytes (CMs) differentiated from induced pluripotent stem cells (iPSCs).

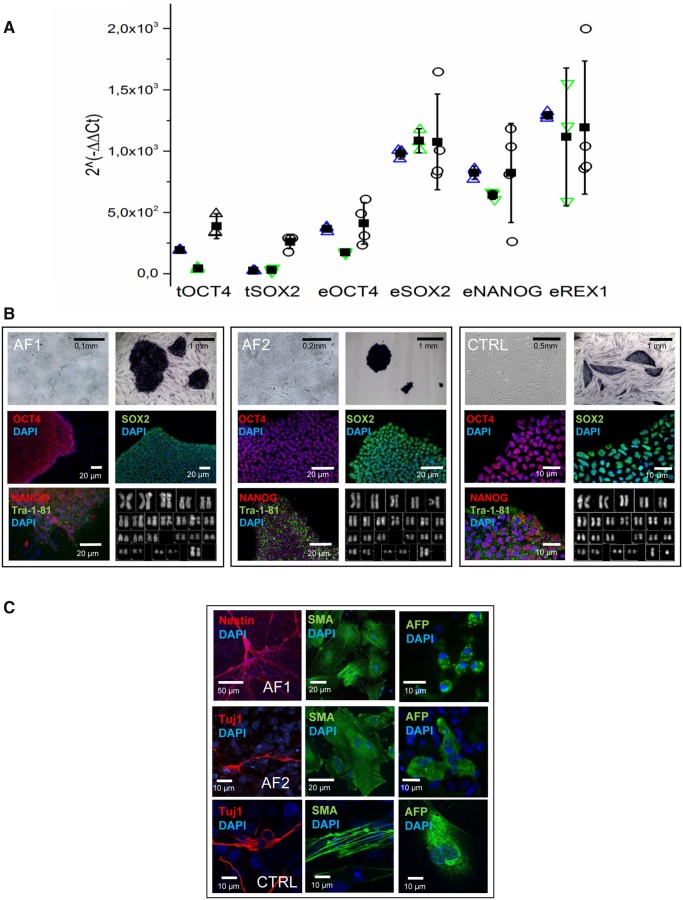
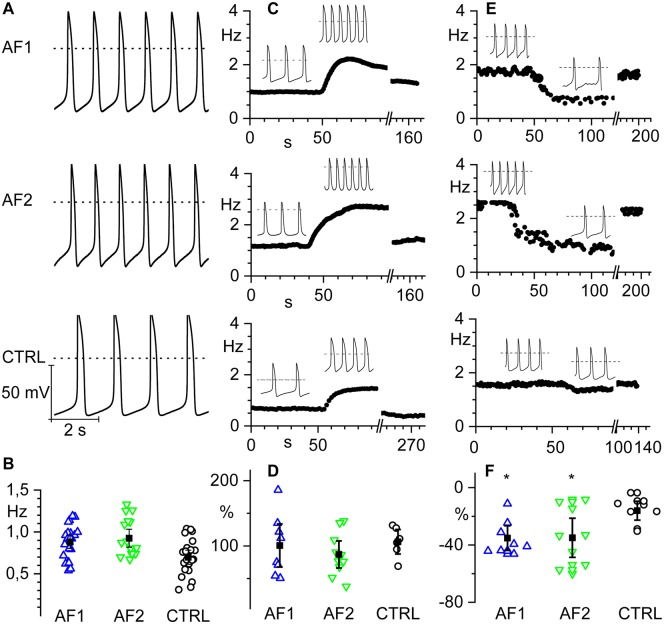
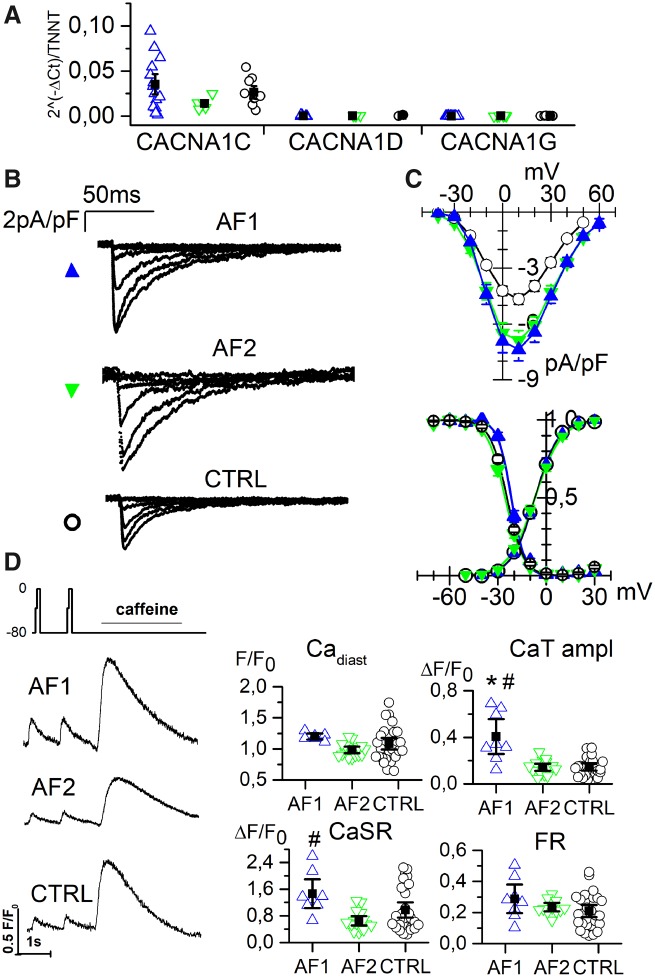
Methods and results: Here we report the clinical case of three siblings with untreatable persistent AF whose whole-exome sequence analysis revealed several mutated genes. To understand the pathophysiology of this multifactorial form of AF we generated three iPSC clones from two of these patients and differentiated these cells towards the cardiac lineage. Electrophysiological characterization of patient-derived CMs (AF-CMs) revealed that they have higher beating rates compared to control (CTRL)-CMs. The analysis showed an increased contribution of the If and ICaL currents. No differences were observed in the repolarizing current IKr and in the sarcoplasmic reticulum calcium handling. Paced AF-CMs presented significantly prolonged action potentials and, under stressful conditions, generated both delayed after-depolarizations of bigger amplitude and more ectopic beats than CTRL cells.

Conclusions: Our results demonstrate that the common genetic background of the patients induces functional alterations of If and ICaL currents leading to a cardiac substrate more prone to develop arrhythmias under demanding conditions. To our knowledge this is the first report that, using patient-derived CMs differentiated from iPSC, suggests a plausible cellular mechanism underlying this complex familial form of AF.

Keywords: Arrhythmias; Atrial fibrillation; Ion channels; Precision medicine; iPSC-derived cardiomyocytes.


Figures

Graphical Abstract
Graphical Abstract
Figure 1
Figure 1
Pluripotency characterization. (A) qPCR analysis of pluripotency gene expression in hiPSC using dermal fibroblasts as reference control equal to 1. tOCT4 and tSOX2 indicate the specific expression of transgenes, while eOCT4 and eSOX2 refer to expression of endogenous genes. Differences in gene expression levels were compared using one-way ANOVA followed by Fisher’s T-test. (B) Summary panels for AF1, AF2, and CTRL hiPSC lines, as indicated (from left to right): bright-field images of primary fibroblasts, alkaline phosphatase activity in hiPSC-colonies, immunostaining of hiPSC for pluripotency markers and karyotype. (C) Immunostaining of differentiated hiPSCs with antibodies recognizing ectodermal, mesodermal, and endodermal markers as indicated.
Figure 2
Figure 2
hiPSC-derived cardiomyocyte differentiation. (A) qPCR analysis of cardiac troponin T (TNNT2) and sarcolipin (SLN) expression at day 30 of differentiation for AF1-, AF2-, and CTRL-CMs, as indicated. Undifferentiated hiPSC were used as negative control. (B) Quantification of cardiac troponin I (µg) on total protein content (TP, mg) of AF1 (2.9 ± 0.46; n = 3), AF2 (2.4 ± 1.37; n = 3), CTRL (2.36 ± 1.08; n = 6), and hiPSCs (0.002 ± 0.01; n = 2) (left). Representative flow cytometry analysis on hiPSC-differentiated cells using an anti-cardiac troponin T antibody: AF1 (45.1 ± 11 n = 3), AF2 (55.2 ± 19 n = 3), CTRL (52 ± 12 n = 6) (right). (C) Representative images of isolated AF1-CM and AF1-differentiated monolayers stained for cardiac troponin T (cTNT), sarcomeric actin (α-SARC), atrial (MLC2a), and ventricular (MLC2v) myosin light chains; nuclei were counterstained with DAPI. (D) Ratios between the qPCR expression levels of heavy (left) and light (right) chain isoforms of myosin. Human atria (hA) and ventricles (hV) were used as positive and negative controls, respectively. Differences in gene expression and protein quantification were assessed by one-way ANOVA followed by Fisher’s T-test.
Figure 3
Figure 3
hiPSC-CMs from AF patients show increased spontaneous firing rate and similar response to β-adrenergic stimulation compared to controls. (A) Representative voltage traces of spontaneous firing recorded from hiPSC-CM clusters from AF1 and AF2 patients and CTRL as indicated. (B) Scatter plot of the firing rate (open circles) and mean values (filled squares) of AF1 (0.88 ± 0.04 Hz, n/exp = 24/6), AF2 (0.99 ± 0.07 Hz, n/exp = 19/8), and CTRL (0.72 ± 0.05 Hz, n/exp = 25/9) hiPSC-CMs. (C) Time course of the firing rate of representative hiPSC-CM clusters from AF1, AF2, and CTRL from top to bottom, respectively; the black line indicates the time of isoproterenol perfusion. Insets show representative voltage traces before and during isoproterenol stimulation. (D) Dot plot graph of the percentage increase in firing rate after isoproterenol stimulation. (AF1 100.6 ± 16.5%; n/exp = 8/3, AF2 87.0 ± 10.4%; n/exp = 10/6, and CTRL 106.4 ± 9.4%; n/exp = 6/5). (E) Time course of the firing rate of representative hiPSC-CM clusters from AF1, AF2, and CTRL before, during, and after ivabradine superfusion. Insets show representative voltage traces before and during ivabradine stimulation. (F) Dot plot of the percentage decrease in firing rate after ivabradine superfusion (AF1 −35.2 ± 4.3%; n/exp = 8/3; AF2 −34.9 ± 6.8%; n/exp = 9/3; CTRL −16 ± 3.3%; n/exp = 8/3). Data were compared using nested one-way ANOVA *P < 0.05.
Figure 4
Figure 4
I f current is increased in AF-CMs. (A) qPCR analysis of HCN isoforms normalized to troponin T expression at day 30 of differentiation. (B) Representative images of isolated AF1-, AF2-, and CTRL-CMs stained for HCN4 and cardiac troponin T (calibration bar = 10µm). (C) Representative traces of If current density recorded at −35, −75, and −105 mV followed by a step at −125 mV from AF1-, AF2-, and CTRL-CMs. (D Top) Plot of mean If current density voltage relation from AF1-CMs (blue triangles), AF2-CMs (green inverted triangles), and CTRL-CMs (white circles); Peak current density (at −125mV): AF1 = −7.17 ± 1.1*pA/pF, n/exp = 14/8; AF2 = −6.75 ± 0.72*pA/pF, n/exp = 13/3; CTRL = −3.45 ± 0.43 pA/pF, n/exp = 28/9. (Bottom) Mean activation curves of If current from AF1-CMs, AF2-CMs, and CTRL-CMs (symbols as in top panel). V1/2 values: AF1 = −71.2 ± 1.6* mV, n/exp = 21/6; AF2 = −72.7 ± 1.3* mV, n/exp = 15/4; CTRL = −81.5 ± 1.4 mV, n/exp = 28/9. Inverse slope factor values: AF1 = 8.4 ± 0.25, n = 21; AF2 = 7.5 ± 0.5, n = 15; CTRL = 9.5 ± 0.5, n = 28. *P < 0.005. Data were compared using nested one-way ANOVA *P < 00.5.
Figure 5
Figure 5
L-type calcium current is increased in AF-CMs. (A) qPCR analysis of L-type calcium channel isoforms (1C, 1D) and T-type isoform (1G) expression normalized to troponin level at day 30 of differentiation. (B) Representative traces of ICaL current density recorded by 10 mV steps to the range of −40/+10 mV from AF1-, AF2-, and CTRL-CMs. (C Top) Plot of mean ICaL current density voltage relation from AF1-CMs (blue triangles), AF2-CMs (green inverted triangles), and CTRL-CMs (white circles). Peak current density (at 10 mV): AF1 = −7.4 ± 0.6*pA/pF, n/exp = 34/6; AF2 = −6.9 ± 0.5*pA/pF, n/exp = 30/8; CTRL = −4.7 ± 0.3 pA/pF, n/exp = 52/11. (Bottom) Mean activation and inactivation curves of ICaL current from AF1-CMs, AF2-CMs, and CTRL-CMs (symbols as in top panel) V1/2 values of activation: AF1 = −6.6 ± 1.2 mV, n/exp = 29/6; AF2 = −6.8 ± 1.0 mV, n/exp = 31/8; CTRL = −7.4 ± 0.5 mV, n/exp = 51/11. V1/2 values of inactivation: AF1 = −21.8 ± 0.7 mV, n/exp = 16/6; AF2 = −25.4 ± 0.8 mV, n/exp = 25/8; CTRL = −24.5 ± 0.5 mV, n/exp = 36/11. (D) Left, examples of calcium transients recorded from AF1-, AF2-, and CTRL-CMs applying the protocol shown. Right, dot blot graphs of the Ca diast, CaT amplitude, CaSR, and FR data in the three groups, as indicated. For values see Supplementary material online, Table S5. Data were compared using nested one-way ANOVA *P < 0.05 vs. CTRL; #P < 0.05 vs. AF2.
Figure 6
Figure 6
Action potential duration is longer in AF-CMs compared to CTRL-CMs. (A) Histograms of the distribution of the APD90 in AF1, AF2, and CTRL cells, as indicated. Bin size = 40 ms. (B) Representative action potentials with the shortest (left), average (centre), and longest (right) APD90 recorded at 1 Hz stimulation in AF1 (top), AF2 (middle), and CTRL (bottom) CMs. Dashed lines indicate the 0 mV level.
Figure 7
Figure 7
AF-CMs are more arrhythmogenic. (A) Representative action potentials in Tyrode (black line) and during perfusion of 100 nM isoproterenol + 300 nM E4031 (red line) showing no events (top), DADs (middle), and ectopic beats (bottom) recorded from AF2-CMs paced at 0.5 Hz; dashed lines indicate the 0 mV level. (B) Plot of the percentage of cells showing ectopic beats (AF1 7 out of 9/3 cells/exp, 78.8%*; AF2 7 out of 10/3 cells/exp, 70.0%*; CTRL 7 out of 36/6 cell/exp, 19.5%), DADs (AF1 2 out of 9, 22.2%; AF2 2 out of 10, 20.0%; CTRL 11 out of 36, 30.5%), and no events (AF1 0 out of 9, 0%; AF2 1 out of 10, 10.0%; CTRL 18 out of 36, 50%). (C) Plot of DADs amplitude in AF1-CMs (blue triangles), AF2-CMs (green inverted triangles), and CTRL-CMs (white circles). Values are AF1 = 6.95 ± 0.62* mV, n/exp = 60/3; AF2 = 6.73 ± 0.26* mV, n/exp = 66/3; CTRL = 5.66 ± 0.16 mV, n/exp = 70/6. Percentage data were compared using Fisher’s exact test, adjusting the P-value with Bonferroni correction. Amplitude data were compared using nested one-way ANOVA *P < 0.05.

Comment in

Similar articles

Cited by

References

    1. Tucker NR, Ellinor PT.. Emerging directions in the genetics of atrial fibrillation. Circ Res 2014;114:1469–1482. - PMC - PubMed
    1. Mahida S, Lubitz SA, Rienstra M, Milan DJ, Ellinor PT.. Monogenic atrial fibrillation as pathophysiological paradigms. Cardiovasc Res 2011;89:692–700. - PMC - PubMed
    1. Iwasaki YK, Nishida K, Kato T, Nattel S.. Atrial fibrillation pathophysiology: implications for management. Circulation 2011;124:2264–2274. - PubMed
    1. Nattel S, Dobrev D.. Electrophysiological and molecular mechanisms of paroxysmal atrial fibrillation. Nat Rev Cardiol 2016;13:575–590. - PubMed
    1. Dell'Era P, Benzoni P, Crescini E, Valle M, Xia E, Consiglio A, Memo M.. Cardiac disease modeling using induced pluripotent stem cell-derived human cardiomyocytes. World J Stem Cells 2015;7:329–342. - PMC - PubMed

Publication types

MeSH terms

Substances