

Breakdown of Whole-brain Dynamics in Preterm-born Children
- PMID: 31504269
- PMCID: PMC7132942
- DOI: 10.1093/cercor/bhz156
Breakdown of Whole-brain Dynamics in Preterm-born Children
Abstract
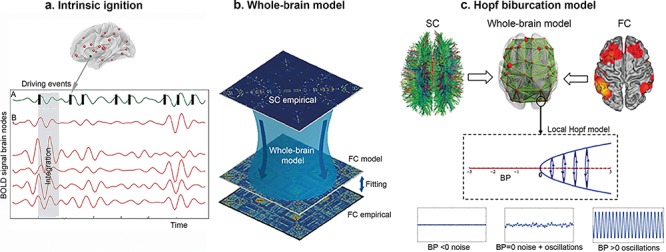
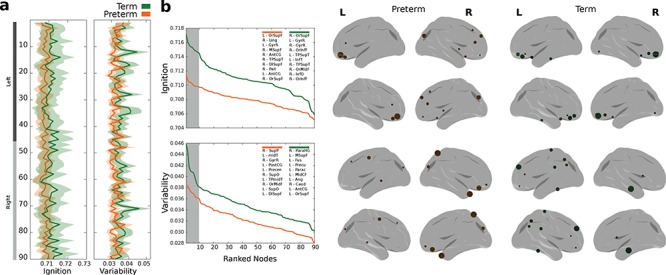
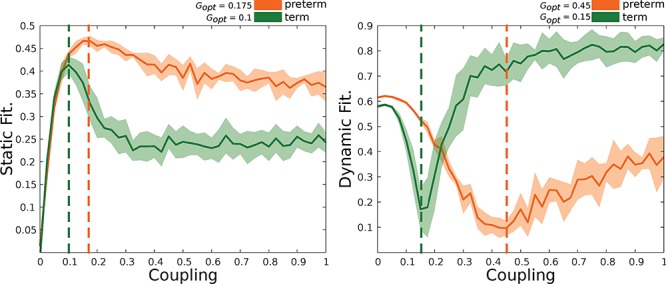
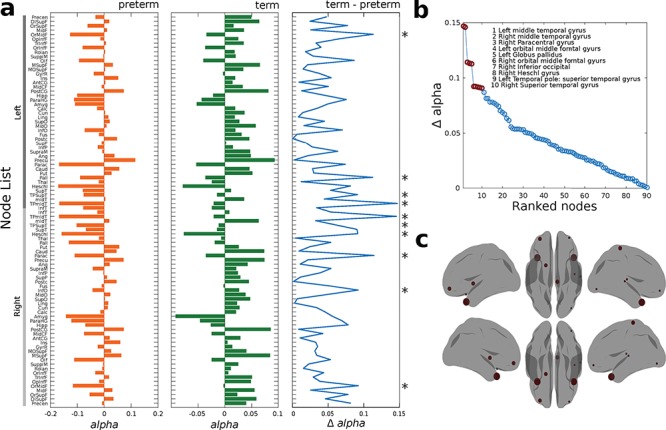
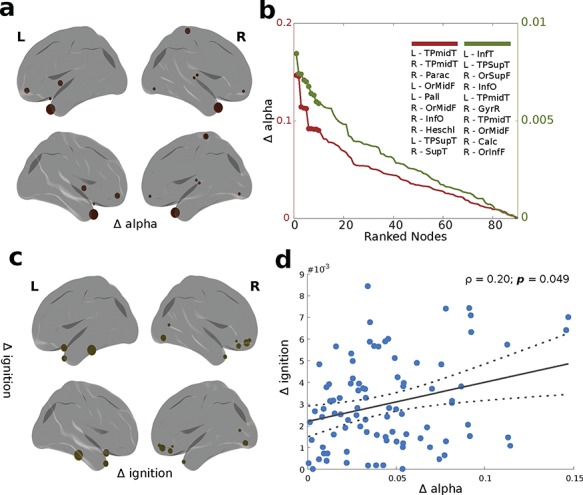
The brain operates at a critical point that is balanced between order and disorder. Even during rest, unstable periods of random behavior are interspersed with stable periods of balanced activity patterns that support optimal information processing. Being born preterm may cause deviations from this normal pattern of development. We compared 33 extremely preterm (EPT) children born at < 27 weeks of gestation and 28 full-term controls. Two approaches were adopted in both groups, when they were 10 years of age, using structural and functional brain magnetic resonance imaging data. The first was using a novel intrinsic ignition analysis to study the ability of the areas of the brain to propagate neural activity. The second was a whole-brain Hopf model, to define the level of stability, desynchronization, or criticality of the brain. EPT-born children exhibited fewer intrinsic ignition events than controls; nodes were related to less sophisticated aspects of cognitive control, and there was a different hierarchy pattern in the propagation of information and suboptimal synchronicity and criticality. The largest differences were found in brain nodes belonging to the rich-club architecture. These results provide important insights into the neural substrates underlying brain reorganization and neurodevelopmental impairments related to prematurity.
Keywords: brain development; brain dynamics; functional connectivity; neurodevelopment; prematurity.
© The Author(s) 2019. Published by Oxford University Press. All rights reserved. For permissions, please e-mail: journals.permission@oup.com.
Figures
Similar articles
-
Altered functional network connectivity relates to motor development in children born very preterm.Neuroimage. 2018 Dec;183:574-583. doi: 10.1016/j.neuroimage.2018.08.051. Epub 2018 Aug 23. Neuroimage. 2018. PMID: 30144569 Free PMC article.
-
Reduced structural brain asymmetry during neonatal life is potentially related to autism spectrum disorders in children born extremely preterm.Autism Res. 2019 Sep;12(9):1334-1343. doi: 10.1002/aur.2169. Epub 2019 Jul 9. Autism Res. 2019. PMID: 31287626
-
Extremely preterm children exhibit increased interhemispheric connectivity for language: findings from fMRI-constrained MEG analysis.Dev Sci. 2018 Nov;21(6):e12669. doi: 10.1111/desc.12669. Epub 2018 Apr 16. Dev Sci. 2018. PMID: 29659125 Free PMC article.
-
Functional and structural connectivity of the brain in very preterm babies: relationship with gestational age and body and brain growth.Pediatr Radiol. 2019 Jul;49(8):1078-1084. doi: 10.1007/s00247-019-04412-6. Epub 2019 May 3. Pediatr Radiol. 2019. PMID: 31053875
-
Functional magnetic resonance connectivity studies in infants born preterm: suggestions of proximate and long-lasting changes in language organization.Dev Med Child Neurol. 2016 Mar;58 Suppl 4(Suppl 4):28-34. doi: 10.1111/dmcn.13043. Dev Med Child Neurol. 2016. PMID: 27027605 Free PMC article. Review.
Cited by
-
Criticality is Associated with Future Psychotherapy Response in Patients with Post-Traumatic Stress Disorder-A Pilot Study.Chronic Stress (Thousand Oaks). 2025 Jan 12;9:24705470241311285. doi: 10.1177/24705470241311285. eCollection 2025 Jan-Dec. Chronic Stress (Thousand Oaks). 2025. PMID: 39811461 Free PMC article.
-
Why Brain Criticality Is Clinically Relevant: A Scoping Review.Front Neural Circuits. 2020 Aug 26;14:54. doi: 10.3389/fncir.2020.00054. eCollection 2020. Front Neural Circuits. 2020. PMID: 32982698 Free PMC article.
-
Neonatal brain dynamic functional connectivity in term and preterm infants and its association with early childhood neurodevelopment.Nat Commun. 2024 Feb 8;15(1):16. doi: 10.1038/s41467-023-44050-z. Nat Commun. 2024. PMID: 38331941 Free PMC article.
-
Loss of consciousness reduces the stability of brain hubs and the heterogeneity of brain dynamics.Commun Biol. 2021 Sep 6;4(1):1037. doi: 10.1038/s42003-021-02537-9. Commun Biol. 2021. PMID: 34489535 Free PMC article.
-
Brain volumes and cortical thickness and associations with cognition in children born extremely preterm.Pediatr Res. 2025 Feb;97(2):655-663. doi: 10.1038/s41390-024-03480-1. Epub 2024 Aug 21. Pediatr Res. 2025. PMID: 39169225 Free PMC article.
References
Publication types
MeSH terms
LinkOut - more resources
Full Text Sources
