. 2019 Nov 1;160(11):2630-2645.
doi: 10.1210/en.2019-00418.

Reduced Stability and pH-Dependent Activity of a Common Obesity-Linked PCSK1 Polymorphism, N221D

Affiliations

Reduced Stability and pH-Dependent Activity of a Common Obesity-Linked PCSK1 Polymorphism, N221D

Timothy S Jarvela et al. Endocrinology. .

Abstract

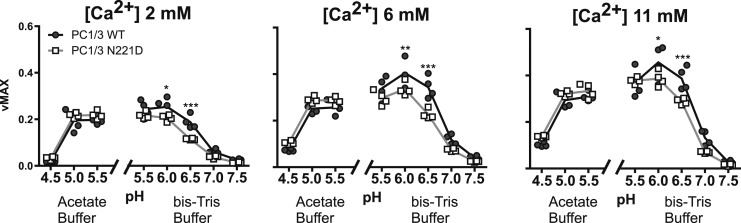
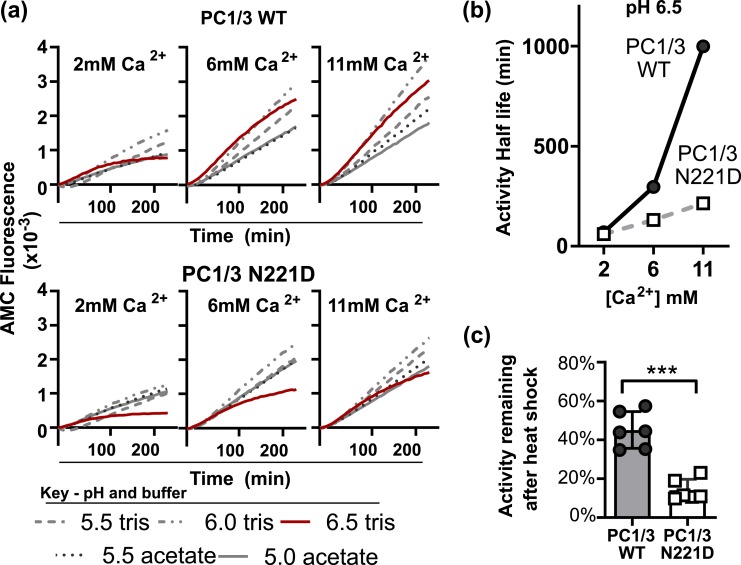
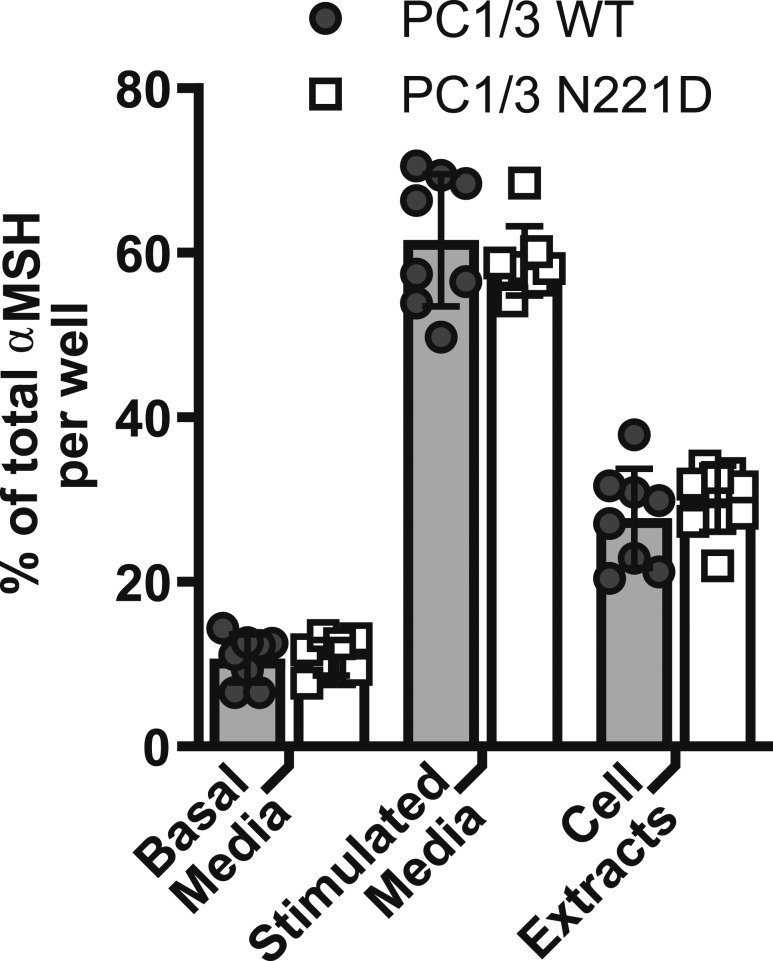
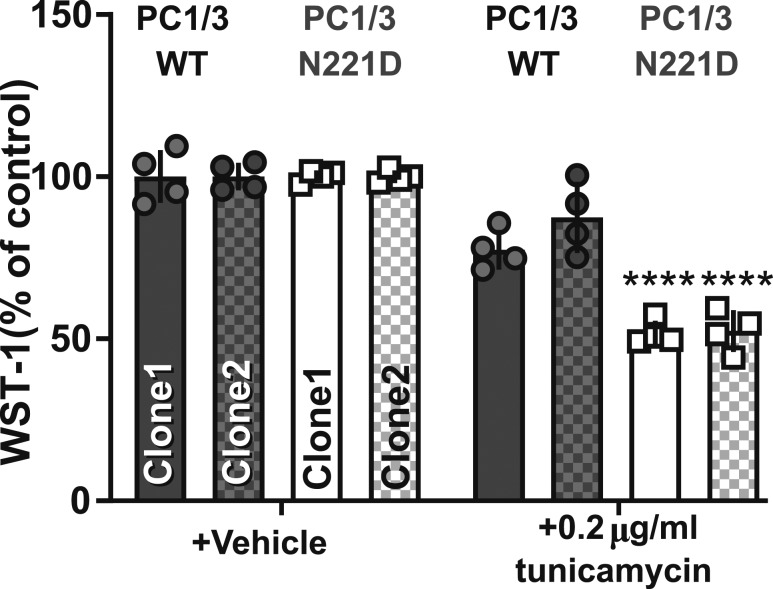
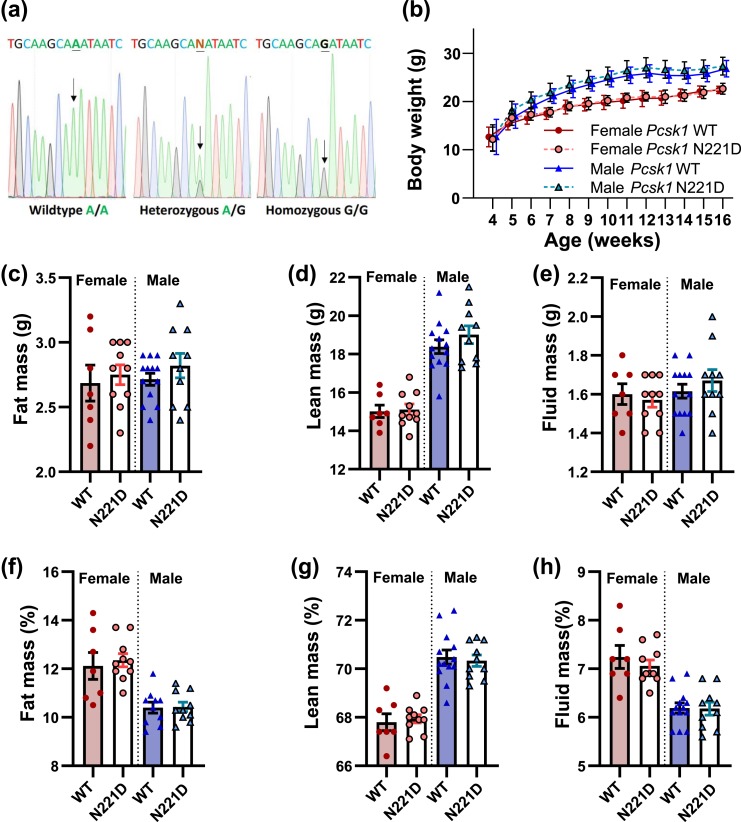
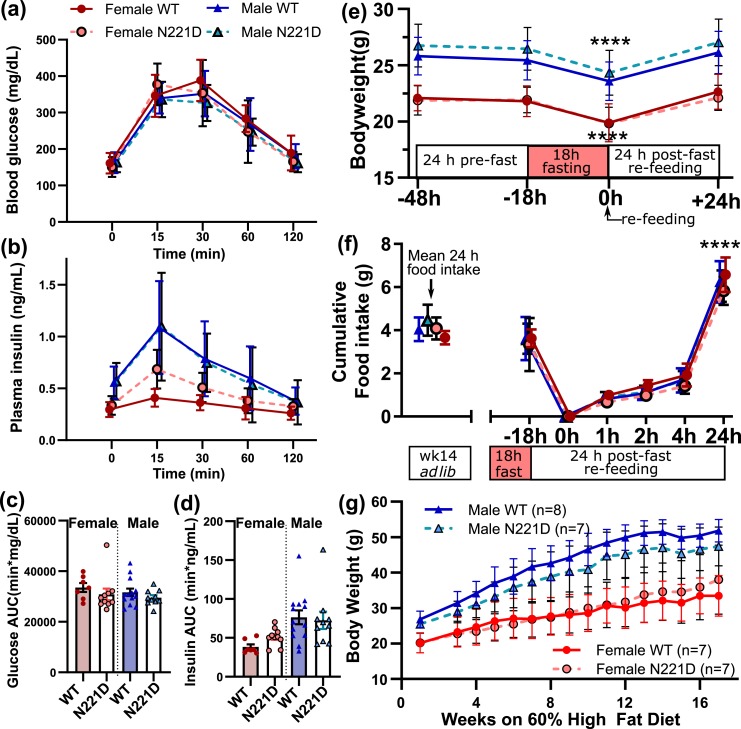
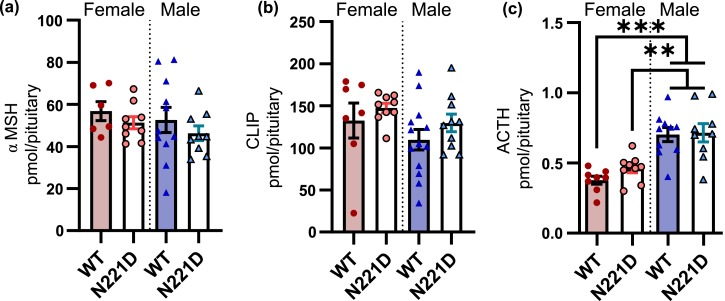
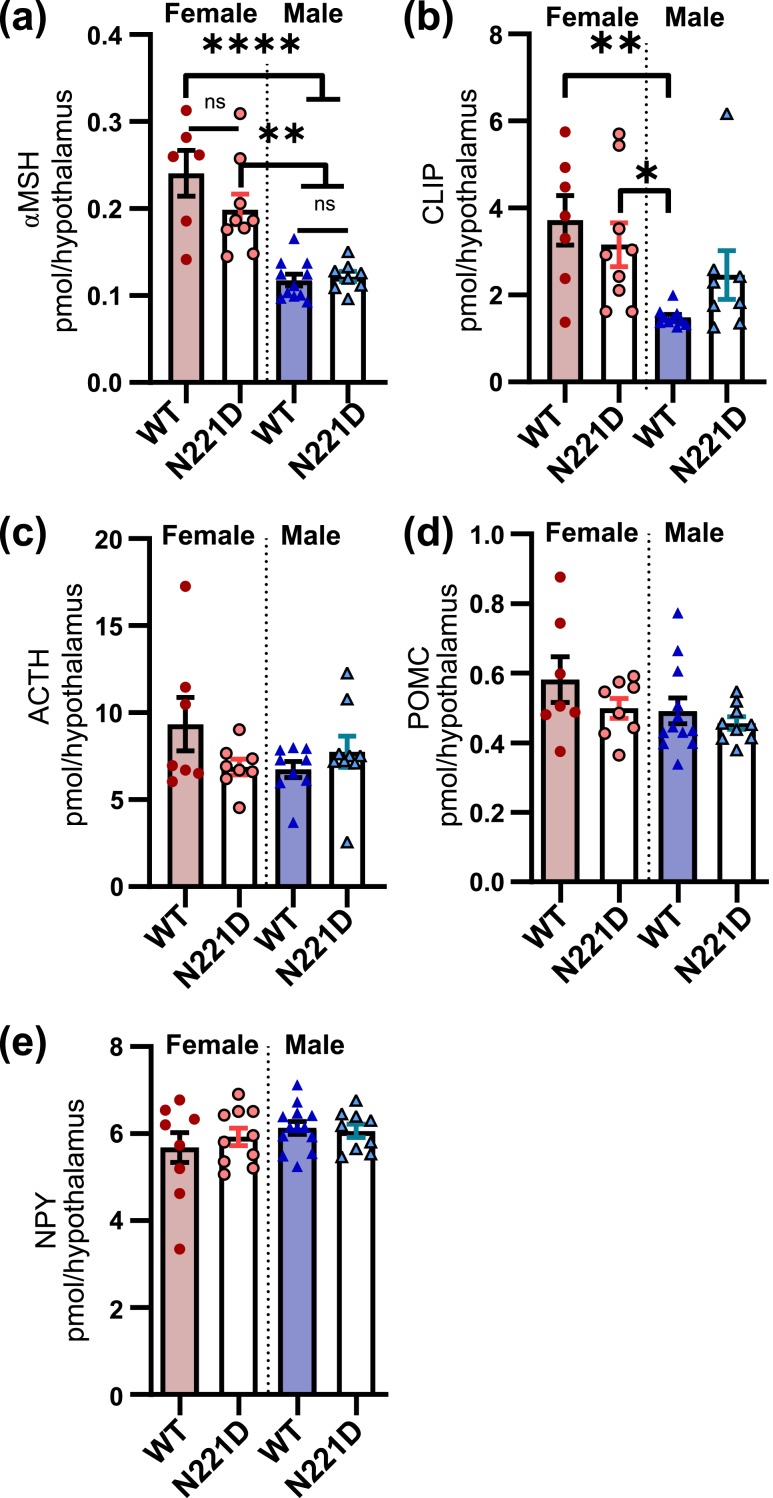
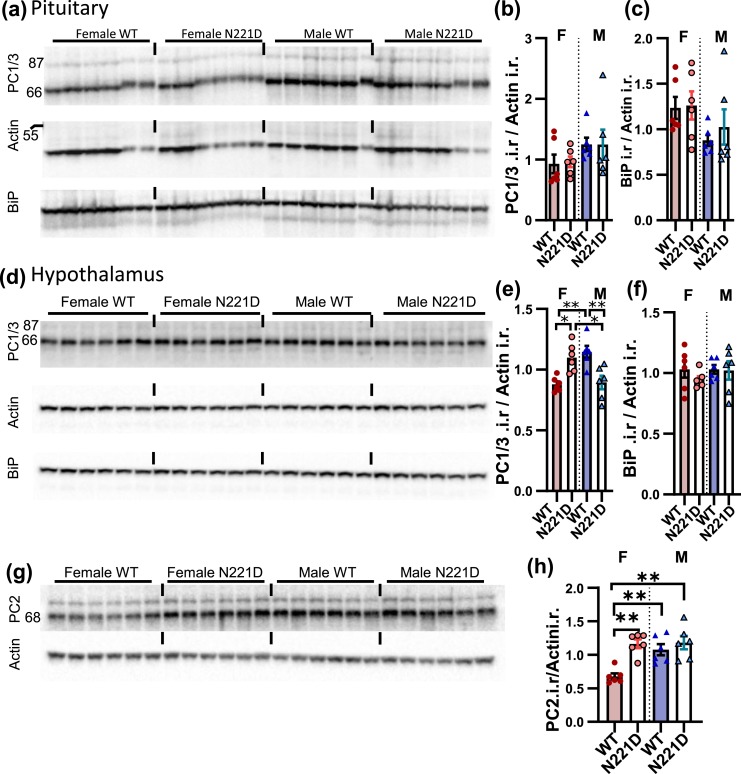
Common mutations in the human prohormone convertase (PC)1/3 gene (PCKSI) are linked to increased risk of obesity. Previous work has shown that the rs6232 single-nucleotide polymorphism (N221D) results in slightly decreased activity, although whether this decrease underlies obesity risk is not clear. We observed significantly decreased activity of the N221D PC1/3 enzyme at the pH of the trans-Golgi network; at this pH, the mutant enzyme was less stable than wild-type enzyme. Recombinant N221D PC1/3 also showed enhanced susceptibility to heat stress. Enhanced susceptibility to tunicamycin-induced endoplasmic reticulum stress was observed in AtT-20/PC2 cell clones in which murine PC1/3 was replaced by human N221D PC1/3, as compared with wild-type human PC1/3. However, N221D PC1/3-expressing AtT-20/PC2 clones processed proopiomelanocortin to α-MSH similarly to wild-type PC1/3. We also generated a CRISPR-edited mouse line expressing the N221D mutation in the PCKSI gene. When homozygous N221D mice were fed either a standard or a high-fat diet, we found no increase in body weight compared with their wild-type sibling controls. Sexual dimorphism was observed in pituitary ACTH for both genotypes, with females exhibiting lower levels of pituitary ACTH. In contrast, hypothalamic α-MSH content for both genotypes was higher in females compared with males. Hypothalamic corticotropin-like intermediate peptide content was higher in wild-type females compared with wild-type, but not N221D, males. Taken together, these data suggest that the increased obesity risk linked to the N221D allele in humans may be due in part to PC1/3-induced loss of resilience to stressors rather than strictly to decreased enzymatic activity on peptide precursors.


Figures

Figure 1.
Figure 1.
PC1/3 N221D exhibits altered sensitivity to pH and calcium. Maximal activity of PC1/3 secreted from CHOK1 cells, assayed using the pERTKR-AMC fluorogenic substrate, at varying calcium concentrations and pHs. Line plots show the maximal activity for each construct at each pH and calcium condition. Scatter plot points show the average of duplicates, assayed from separately transfected wells. Statistical analyses were performed using two-way ANOVA. *P < 0.05, **P < 0.01, ***P < 0.001, for differences between PC1-WT and PC1-N221D. vMAX, maximum velocity.
Figure 2.
Figure 2.
High pH preferentially reduces the activity half-life of PC1-N221D and decreases thermal stability. (a) Enzymatic assay shows the average trace (n = 4 separate transfections, assayed in duplicate) of AMC release over time at each pH and calcium concentration. (b) A one-phase decay nonlinear regression curve was fit to pH 6.5 samples assayed at each calcium concentration. The half-life of enzyme activity for PC1-WT vs PC1-N221D at pH 6.5 across calcium conditions is shown. Each curve had R2 values >0.997. (c) Percentage activity remaining after a 5-min heat inactivation when compared with samples kept on ice. Samples were assayed at pH 6.5 and with 6 mM calcium. Each data point represents the mean of technical replicates from three independent experiments. The bar represents mean ± SD. ***P < 0.001, by two-tailed, unpaired t test.
Figure 3.
Figure 3.
The PC1/3 N221D SNP does not impact α-MSH production or secretion from AtT-20/PC2 cells. Conditioned media and cell extracts from AtT-20/PC2 cells expressing either PC1-WT or PC1-N221D were assayed for α-MSH by RIA. Data points depict the assay averages of eight individual wells, each assayed in triplicate, from two independently performed experiments. Each data point presented is the percentage of α-MSH compared with the sum of α-MSH (basal media + stimulated media + cellular extracts) for each replicate. Total α-MSH per well was ∼3 pmol. No significant difference was observed between α-MSH levels in cells expressing WT vs N221D PC1/3 using a two-way ANOVA and Bonferonni posttest. Similar results were obtained with two other clones expressing each genotype.
Figure 4.
Figure 4.
PC1/3 N221D-expressing AtT-20/PC2 cells are more susceptible to tunicamycin-induced ER stress. Two clones for each construct, WT and N221D, were treated with 0.2 μg/mL tunicamycin or equivalent volume of vehicle for 48 h. Cell viability is shown for four replicate wells of each clone. Cell viability is shown as percentage of metabolic activity in treated vs control groups, as determined by cleavage of the WST-1 tetrazolium salt to formazan. Expression of PC1-N221D significantly increased the sensitivity of AtT-20 cells to tunicamycin (individual replicates; the bar represents mean ± SD). This experiment was repeated with two additional clones for both PC1-WT and PC1-N221D, with similar results. ****P < 0.0001, two-way ANOVA with a Tukey posttest.
Figure 5.
Figure 5.
PC1/3 N221D mice do not show increased body weight or alterations in fat, lean, and fluid mass. (a) DNA sequencing chromatograms showing the successful A661G nucleotide substitution. DNA from a WT mouse (left panel) has a single A peak at position 661, whereas a heterozygous mouse (center panel) has a peak for both the A and G alleles, and a homozygous mouse (right panel) has a single G peak. The position of the edited residue is underlined in the sequence and marked by an arrow in the sequence chromatogram. (b) Body weight. There was no significant change in body weight between WT and N221D mutant mice during 16 wk. Data are presented as the mean ± SD (n = 7 to 13). Means are shown offset by 5% from each other on the x-axis to provide visual clarity. (c) Total fat mass and (d) lean mass. (e) Fluid mass, as analyzed by NMR. (f–h) Body mass measurements shown as a percentage of total body mass. There were no significant differences between genotypes for any of the parameters. Bar graphs represent the average of 7 to 13 different mice ± SD. Individual mouse values are represented by symbols; data were analyzed using a two-way ANOVA with a Tukey posttest.
Figure 6.
Figure 6.
N221D PC1/3 mice show no differences in resting glucose or insulin levels, nor alterations in response to oral glucose (GTT) nor in food intake. (a) Blood glucose levels over time; (b) plasma insulin levels over time; (c) calculated glucose; (d) insulin area under the curve (AUC), all at age 16 wk. Line graphs represent average of n = 7 to 13 mice ± SD. Bar graphs represent averages of n = 7 to 13 different mice ± SD; individual mouse values are represented by symbols. (e) Fasting-refeeding experiment showing that N221D Pcsk1 mice exhibit no significant genotype differences in body weight or food intake after fasting-refeeding. Body weight was measured at age 15 wk, 48 h and 18 h before fasting and 18 h and 24 h after refeeding. Data are presented as the mean ± SD (n = 7 to 13 per group). Data were analyzed separately for each sex by one-way repeated measures ANOVAs followed by Tukey post hoc tests. ****P < 0.0001, compared with all other time points within sex. (f) Cumulative food intake. Total food intake was measured at age 14 wk for 1 wk and divided by 7 to calculate mean daily food intake and then measured again at age 15 wk before and after an 18-h fast, and then 1, 2, 4, and 24 h after refeeding. Data are presented as the mean ± SD (n = 7 to 13 per group). Data points were shifted slightly horizontally at each time point for clarity. Data were analyzed by a two-way repeated means ANOVA followed by Tukey post hoc tests. ****P < 0.0001, compared with all other time points for both sexes and genotypes. (g) Body weight on a 60% high-fat diet. Mice were started on a high-fat diet between 9 and 15 wk of age and were weighed weekly for the subsequent 16 wk. There were no significant differences in weights between genotypes at any time point, as assessed by two-way repeated ANOVAs and Sidak pairwise post hoc tests. Data are presented as the mean ± SD; n = 7 to 8 mice per group. Triangles indicate males; circles indicate females; black outline shows the N221D genotype.
Figure 7.
Figure 7.
Pituitary peptide levels are unchanged by the N221D polymorphism; all female mice show reduced pituitary ACTH content as compared with males. Assays were performed as described in “Methods.” (a) α-MSH. (b) CLIP. (c) ACTH. Bar graphs represent averages of 7 to 13 different mice ± SD; individual mouse values are represented by symbols; **P < 0.01, ***P < 0.001, analyzed with one-way ANOVA and Tukey posttest.
Figure 8.
Figure 8.
Hypothalamic POMC processing to α-MSH is sexually dimorphic. Assays were performed as described in “Methods.” (a) α-MSH. (b) CLIP. (c) ACTH. (d) POMC. Bar graphs represent averages of n = 7 to 13 different mice ± SD; the values from individual mice are depicted. (e) Hypothalamic NPY levels are unaltered in N221D Pcsk1 mice. Hypothalamic NPY levels were measured as described in “Methods.” Individual mouse values are represented by symbols; no significant differences were found using a one-way ANOVA and Tukey post hoc test. *P < 0.05, **P < 0.01, ****P < 0.0001, analyzed using one-way ANOVA and Tukey posttest. ns, not significant.
Figure 9.
Figure 9.
Hypothalamic, but not pituitary, PC1/3 and PC2 protein levels vary by sex and genotype. (a–c) Pituitary and (d–h) hypothalamic pellets obtained from acid extracts were Western blotted for PC1/3 protein, followed by blotting for actin and BiP. (a) Pituitary PC1/3-ir, reprobed for actin and BiP. (b) PC1/3-ir quantitation, normalized to actin. (c) BiP-ir, normalized to actin. (d) Hypothalamic PC1/3, reprobed for actin and BiP. (e) PC1/3-ir, normalized to actin. (F) BiP-ir, normalized to actin. (g) Hypothalamic PC2-ir and actin [from the same samples used in (d)–(h)]. The ratio of PC2 to actin is quantified in (h). Numbers to the left of the y-axis in (a), (d), and (g) refer to kDa, obtained by reference to molecular mass standards. Bar graphs represent the averages of six different mice ± SD; individual mouse values are represented by symbols. *P < 0.05, **P < 0.01, one-way ANOVA with a Tukey post hoc test. i.r., immunoreactivity.

Similar articles

Cited by

References

    1. Seidah NG. The proprotein convertases, 20 years later. Methods Mol Biol. 2011;768:23–57. - PubMed
    1. Benjannet S, Rondeau N, Day R, Chrétien M, Seidah NG. PC1 and PC2 are proprotein convertases capable of cleaving proopiomelanocortin at distinct pairs of basic residues. Proc Natl Acad Sci USA. 1991;88(9):3564–3568. - PMC - PubMed
    1. Thomas L, Leduc R, Thorne BA, Smeekens SP, Steiner DF, Thomas G. Kex2-like endoproteases PC2 and PC3 accurately cleave a model prohormone in mammalian cells: evidence for a common core of neuroendocrine processing enzymes. Proc Natl Acad Sci USA. 1991;88(12):5297–5301. - PMC - PubMed
    1. Bloomquist BT, Eipper BA, Mains RE. Prohormone-converting enzymes: regulation and evaluation of function using antisense RNA. Mol Endocrinol. 1991;5(12):2014–2024. - PubMed
    1. Ramos-Molina B, Martin MG, Lindberg I. PCSK1 variants and human obesity. Prog Mol Biol Transl Sci. 2016;140:47–74. - PMC - PubMed

Publication types