. 2019 Nov 14;40(43):3529-3543.
doi: 10.1093/eurheartj/ehz592.

A novel machine learning-derived radiotranscriptomic signature of perivascular fat improves cardiac risk prediction using coronary CT angiography

Affiliations

A novel machine learning-derived radiotranscriptomic signature of perivascular fat improves cardiac risk prediction using coronary CT angiography

Evangelos K Oikonomou et al. Eur Heart J. .

Abstract

Background: Coronary inflammation induces dynamic changes in the balance between water and lipid content in perivascular adipose tissue (PVAT), as captured by perivascular Fat Attenuation Index (FAI) in standard coronary CT angiography (CCTA). However, inflammation is not the only process involved in atherogenesis and we hypothesized that additional radiomic signatures of adverse fibrotic and microvascular PVAT remodelling, may further improve cardiac risk prediction.

Methods and results: We present a new artificial intelligence-powered method to predict cardiac risk by analysing the radiomic profile of coronary PVAT, developed and validated in patient cohorts acquired in three different studies. In Study 1, adipose tissue biopsies were obtained from 167 patients undergoing cardiac surgery, and the expression of genes representing inflammation, fibrosis and vascularity was linked with the radiomic features extracted from tissue CT images. Adipose tissue wavelet-transformed mean attenuation (captured by FAI) was the most sensitive radiomic feature in describing tissue inflammation (TNFA expression), while features of radiomic texture were related to adipose tissue fibrosis (COL1A1 expression) and vascularity (CD31 expression). In Study 2, we analysed 1391 coronary PVAT radiomic features in 101 patients who experienced major adverse cardiac events (MACE) within 5 years of having a CCTA and 101 matched controls, training and validating a machine learning (random forest) algorithm (fat radiomic profile, FRP) to discriminate cases from controls (C-statistic 0.77 [95%CI: 0.62-0.93] in the external validation set). The coronary FRP signature was then tested in 1575 consecutive eligible participants in the SCOT-HEART trial, where it significantly improved MACE prediction beyond traditional risk stratification that included risk factors, coronary calcium score, coronary stenosis, and high-risk plaque features on CCTA (Δ[C-statistic] = 0.126, P < 0.001). In Study 3, FRP was significantly higher in 44 patients presenting with acute myocardial infarction compared with 44 matched controls, but unlike FAI, remained unchanged 6 months after the index event, confirming that FRP detects persistent PVAT changes not captured by FAI.

Conclusion: The CCTA-based radiomic profiling of coronary artery PVAT detects perivascular structural remodelling associated with coronary artery disease, beyond inflammation. A new artificial intelligence (AI)-powered imaging biomarker (FRP) leads to a striking improvement of cardiac risk prediction over and above the current state-of-the-art.

Keywords: Adipose tissue; Computed tomography; Coronary artery disease; Machine learning; Radiomics; Risk stratification.


Figures

Figure 1
Figure 1
Workflow diagram. Study 1 included 167 adipose tissue biopsies from cardiac surgery patients in order to evaluate the correlation between fat biology and radiomic features. Study 2 utilized a pool of 5487 patients with coronary CT angiography who participated either in the Cardiovascular RISk Prediction using CT study or the SCOT-HEART trial, so as to develop and validate FRP, and finally to test its cohort-wide performance against the standard of care. Finally, in Study 3, we performed further external biological validation of FRP as follows: 88 patients from the Ox-IMPACT and ORFAN studies were included to test FRP’s ability to identify acute myocardial infarction-related perivascular changes and compare its ability to track longitudinal perivascular changes over a period of 6 months with that of Fat Attenuation Index. AMI, acute myocardial infarction; CAD, coronary artery disease; CRISP-CT, Cardiovascular RISk Prediction using CT study; FRP, fat radiomic profile; ORFAN, Oxford Risk Factors and Non-invasive Imaging study; Ox-IMPACT, Oxford Imaging of Perivascular Adipose tissue using Computed Tomography study; SCOT-HEART, Scottish COmputed Tomography of the HEART study.
Figure 2
Figure 2
Radiomic phenotyping to detect biological hallmarks of dysfunctional adipose tissue. (A–C) Manhattan plots presenting the strength of association [−log10(P-value) of Spearman’s rho] between adipose tissue radiomic features and the relative gene expression of TNFA (inflammation), COL1A1 (fibrosis), and CD31 (endothelial marker, vascularity)*. Radiomic features were split into two groups, consisting of first-order statistics (green colour, derived from simple attenuation histogram analysis) or higher-order statistics (red colour, reflecting the radiomic texture and spatial interrelation of voxels). The dotted line represents the Bonferroni-adjusted significance level (α = 0.00068). (D) Component plot of the three principal components of the adipose tissue radiome. (E) Comparison of nested linear regression models with relative gene expression as the dependent variable and (i) clinical risk factors alone (Model 1: age, sex, hypertension, hypercholesterolaemia, diabetes mellitus, body mass index); (ii) Model 1 + Mean Attenuation (Model 2); and (iii) Model 2 + PVAT radiome (first three principal components) as the independent predictors. The F statistic at each step is presented and compared with the previous step using the F-test. Imc, informational measure of correlation 2; L/H, low/high wavelet transformation; SALGLE, small area low grey level emphasis; SDLGLE, small dependence low grey level emphasis; SRHGLE, Short Run Low Grey Level Emphasis. *Relative gene expression was calculated using cyclophilin A (PPIA) as the housekeeping gene.
Figure 3
Figure 3
Radiomic phenotyping of coronary perivascular adipose tissue. (A) The perivascular adipose tissue of the right and left coronary arteries (left main and proximal to mid left anterior descending artery) was segmented and used to calculate a number of shape-, attenuation-, and texture-related statistics. (B) Correlation plot of all 1391 stable radiomic features in the SCOT-HEART population (n = 1575 patients), with hierarchical clustering revealing distinct clusters of radiomic variance. (C) Heatmap of scaled radiomic features in the SCOT-HEART population revealing between-patient variance across the cohort. LCA, left coronary artery; PVAT, perivascular adipose tissue; RCA, right coronary artery.
Figure 4
Figure 4
Identifying the high-risk pericoronary fat radiomic profile (Study 2). Cases of individuals that suffered a major adverse cardiac events (cardiac death or non-fatal myocardial infarction) within 5 years of their coronary CT angiography scan (n = 101) and matched controls (n = 101) were selected from a pool of 5487 individual coronary CT angiography scans with follow-up for outcomes. These were randomly split into a training and internal validation set (80% of observations and events, using repeated five-fold cross-validation) and an external validation set (the remaining 20%) to train and test a random forest model to discriminate MACE from non-MACE cases. The product of the random forest model was defined as the fat radiomic profile. The FRP was subsequently measured in 1575 consecutive eligible cases from the SCOT-HEART study to assess its cohort-wide performance in predicting the residual cardiac risk among individuals undergoing clinically indicated coronary CT angiography. CCTA, coronary computed tomography angiography; FRP, fat radiomic profile; MACE, major adverse cardiac events.
Figure 5
Figure 5
The pericoronary fat radiomic profile. (A) A forest plot of the discriminatory value of each radiomic feature in univariable analysis. (B) Validation of the final model in the validation set (20% of the initial sample). (C) Variable importance of the top 20 radiomic features of the final random forest model and corresponding strength of association with adipose tissue inflammation, fibrosis and vascularity, as assessed in Study 1 (++++P < 0.0001; +++P < 0.001. ++P < 0.01, +P < 0.05, and P ≥ 0.05). AUC, area under the curve; CI, confidence interval; CCTA, coronary computed tomography angiography; FRP, fat radiomic profile; H, high filter; Imc2, informational measure of correlation 2; Idmn, inverse difference moment normalized; L, low filter; LCA, left coronary artery; MACE, major adverse cardiac events; MI, myocardial infarction; RCA, right coronary artery.
Figure 6
Figure 6
Prognostic value of the pericoronary fat radiomic profile. (A, B) Kaplan–Meier curves and adjusted hazard ratios for major adverse cardiac events across strata of fat radiomic profile [≥0.63 (FRP+) vs. 0.63 (FRP−)] and high-risk plaque features. (C) Time-dependent receiver operating characteristic curves (t = 5 years post-coronary CT angiography) for two nested prediction models consisting of age, sex, systolic blood pressure, diabetes mellitus, body mass index, smoking status, presence of coronary artery disease (≥50% stenosis), total cholesterol, high-density lipoprotein levels, scanner type, presence of high-risk plaque, as well as Agatston coronary calcium scoring [log(CCS + 1)] with (AUC: 0.880) or without (AUC: 0.754) FRP. (D) Kaplan–Meier curves and adjusted hazard ratios for non-cardiac mortality, as well as a composite endpoint of major adverse cardiac events and/or late revascularization (E, F) across strata of FRP and high-risk plaque features. AUC, area under the curve; CI, confidence interval; CCS, coronary calcium score; CCTA, coronary computed tomography angiography; FRP, fat radiomic profile; HR, hazard ratio; HRP, high-risk plaque feature; MACE, major adverse cardiac events.
Figure 7
Figure 7
Pericoronary fat radiomic profile in acute myocardial infarction. (A) Tukey box-plot of FRP values in patients scanned within 96 h of acute myocardial infarction and matched controls undergoing clinical coronary CT angiography for suspected stable coronary artery disease (n = 44 per group). (B) FRP and perivascular Fat Attenuation Index in acute myocardial infarction patients scanned within 96 hours of admission and 6 months later (n = 16 per group). (C) In a subgroup of patients with ST-elevation myocardial infarction (STEMI) at baseline, Fat Attenuation Index changes were particularly pronounced in the region directly adjacent to the culprit lesion (n = 10). (D) Change in Fat Attenuation Index-associated inflammatory burden, defined as the area under the curve of Fat Attenuation Index measured along a given culprit lesion within 96 h of an acute ST-segment elevation myocardial infarction (STEMI) and 6 months later. AMI, acute myocardial infarction; AU, arbitrary units; CAD, coronary artery disease; FAI, Fat Attenuation Index; HU, Hounsfield Units; STEMI, ST-segment elevation myocardial infarction. P-values derived from Mann–Whitney U test (A), Wilcoxon-signed rank test (B, D) and two-way repeated measures analysis of variance with timepoint/distance interaction (C).
Take home figure
Take home figure
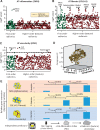
Fat radiomic profile as a marker of adverse perivascular adipose tissue remodelling. Coronary inflammation is associated with phenotypic changes in perivascular adipose tissue, characterized by decreased adipocyte size and intracellular lipid accumulation. This phenotypic shift forms the basis of the CT-derived Fat Attenuation Index that characterizes attenuation changes in perivascular adipose tissue. However, chronic vascular inflammation and atherosclerotic disease are associated with further, irreversible changes in perivascular adipose tissue composition, such as increased extracellular fibrosis and microvascular remodelling. Those changes can now be detected by analysing the radiomic phenotype of perivascular adipose tissue on coronary CT angiography imaging. A comprehensive analysis of volumetric, attenuation-based and texture-based metrics of coronary perivascular adipose tissue on coronary CT angiography imaging carries incremental prognostic value in cardiac risk prediction and highlights the critical role of perivascular adipose tissue in human atherosclerotic cardiovascular disease. CCTA, coronary computed tomography angiography; FAI, Fat Attenuation Index; FRP, fat radiomic profile; PVAT, perivascular adipose tissue.
None

Comment in

Similar articles

Cited by

References

    1. Timmis A, Townsend N, Gale C, Grobbee R, Maniadakis N, Flather M, Wilkins E, Wright L, Vos R, Bax J, Blum M, Pinto F, Vardas P; ESC Scientific Document Group. European Society of Cardiology: cardiovascular disease statistics 2017. Eur Heart J 2018;39:508–579. - PubMed
    1. National Institute for Health and Care Excellence (NICE). Chest pain of recent onset: assessment and diagnosis. Clinical guideline [CG95]. https://www.nice.org.uk/guidance/cg95? unlid=28903932120171912336 (27 July 2019). - PubMed
    1. Fihn SD, Gardin JM, Abrams J, Berra K, Blankenship JC, Dallas AP, Douglas PS, Foody JM, Gerber TC, Hinderliter AL, King SB 3rd, Kligfield PD, Krumholz HM, Kwong RY, Lim MJ, Linderbaum JA, Mack MJ, Munger MA, Prager RL, Sabik JF, Shaw LJ, Sikkema JD, Smith CR Jr, Smith SC Jr, Spertus JA, Williams SV.. 2012 ACCF/AHA/ACP/AATS/PCNA/SCAI/STS guideline for the diagnosis and management of patients with stable ischemic heart disease: executive summary: a report of the American College of Cardiology Foundation/American Heart Association Task Force on Practice Guidelines, and the American College of Physicians, American Association for Thoracic Surgery, Preventive Cardiovascular Nurses Association, Society for Cardiovascular Angiography and Interventions, and Society of Thoracic Surgeons. J Am Coll Cardiol 2012;60:2564–2603. - PubMed
    1. Montalescot G, Sechtem U, Achenbach S, Andreotti F, Arden C, Budaj A, Bugiardini R, Crea F, Cuisset T, Di Mario C, Ferreira JR, Gersh BJ, Gitt AK, Hulot J-S, Marx N, Opie LH, Pfisterer M, Prescott E, Ruschitzka F, Sabaté M, Senior R, Taggart DP, van der Wall EE, Vrints CJM, Zamorano JL, Achenbach S, Baumgartner H, Bax JJ, Bueno H, Dean V, Deaton C, Erol C, Fagard R, Ferrari R, Hasdai D, Hoes AW, Kirchhof P, Knuuti J, Kolh P, Lancellotti P, Linhart A, Nihoyannopoulos P, Piepoli MF, Ponikowski P, Sirnes PA, Tamargo JL, Tendera M, Torbicki A, Wijns W, Windecker S, Knuuti J, Valgimigli M, Bueno H, Claeys MJ, Donner-Banzhoff N, Erol C, Frank H, Funck-Brentano C, Gaemperli O, Gonzalez-Juanatey JR, Hamilos M, Hasdai D, Husted S, James SK, Kervinen K, Kolh P, Kristensen SD, Lancellotti P, Maggioni AP, Piepoli MF, Pries AR, Romeo F, Rydén L, Simoons ML, Sirnes PA, Steg PG, Timmis A, Wijns W, Windecker S, Yildirir A, Zamorano JL.. 2013 ESC guidelines on the management of stable coronary artery disease: the Task Force on the management of stable coronary artery disease of the European Society of Cardiology. Eur Heart J 2013;34:2949–3003. - PubMed
    1. Greenland P, LaBree L, Azen SP, Doherty TM, Detrano RC.. Coronary artery calcium score combined with Framingham score for risk prediction in asymptomatic individuals. JAMA 2004;291:210–215. - PubMed

Publication types

MeSH terms

Substances