. 2019 Oct 1;11(10):2856-2874.
doi: 10.1093/gbe/evz185.

The Genomic Substrate for Adaptive Radiation: Copy Number Variation across 12 Tribes of African Cichlid Species

Affiliations

The Genomic Substrate for Adaptive Radiation: Copy Number Variation across 12 Tribes of African Cichlid Species

Joshua J Faber-Hammond et al. Genome Biol Evol. .

Abstract

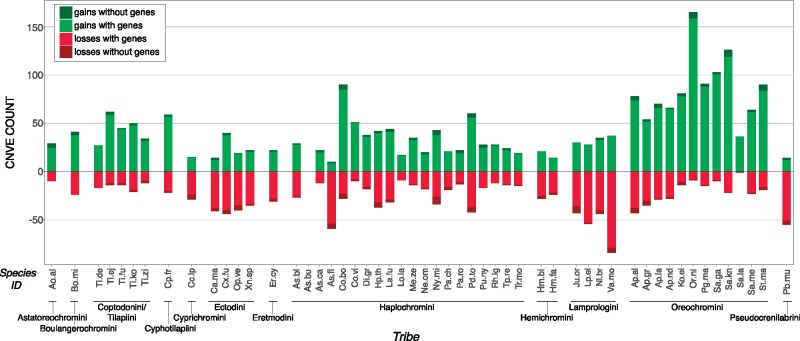
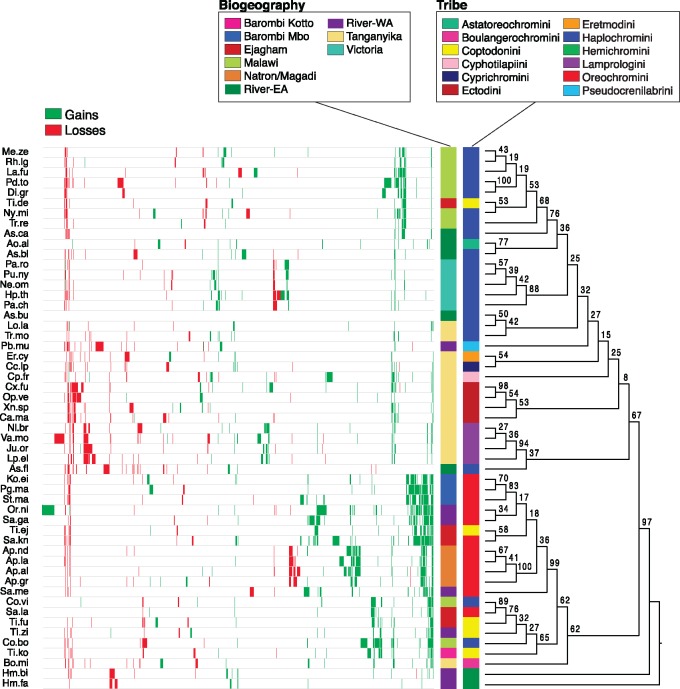
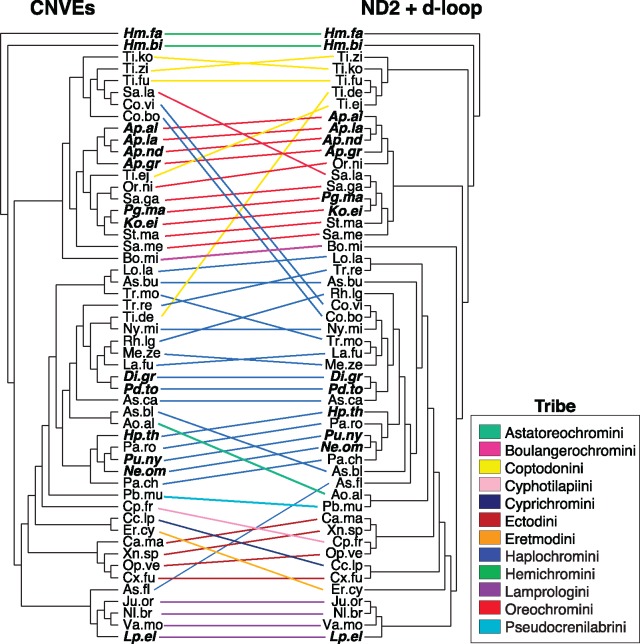
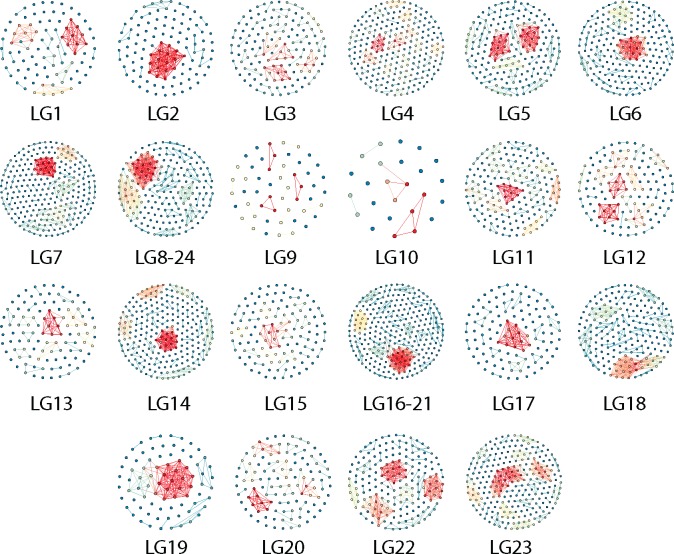
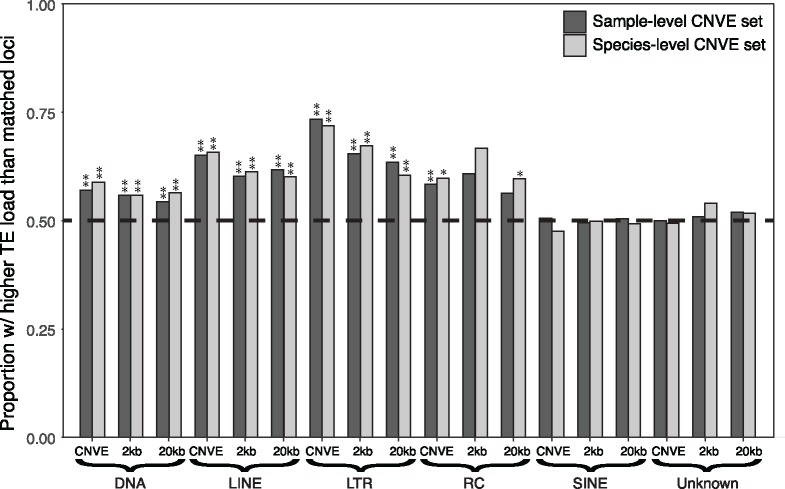
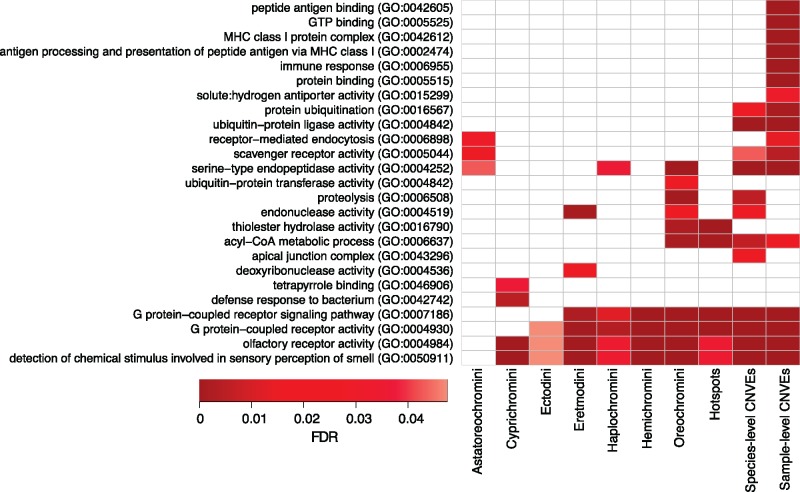
The initial sequencing of five cichlid genomes revealed an accumulation of genetic variation, including extensive copy number variation in cichlid lineages particularly those that have undergone dramatic evolutionary radiation. Gene duplication has the potential to generate substantial molecular substrate for the origin of evolutionary novelty. We use array-based comparative heterologous genomic hybridization to identify copy number variation events (CNVEs) for 168 samples representing 53 cichlid species including the 5 species for which full genome sequence is available. We identify an average of 50-100 CNVEs per individual. For those species represented by multiple samples, we identify 150-200 total CNVEs suggesting a substantial amount of intraspecific variation. For these species, only ∼10% of the detected CNVEs are fixed. Hierarchical clustering of species according to CNVE data recapitulates phylogenetic relationships fairly well at both the tribe and radiation level. Although CNVEs are detected on all linkage groups, they tend to cluster in "hotspots" and are likely to contain and be flanked by transposable elements. Furthermore, we show that CNVEs impact functional categories of genes with potential roles in adaptive phenotypes that could reasonably promote divergence and speciation in the cichlid clade. These data contribute to a more complete understanding of the molecular basis for adaptive natural selection, speciation, and evolutionary radiation.

Keywords: adaptive radiation; cichlid; copy number variation; gene duplication; genomic architecture.


Figures

<sc>Fig</sc>. 1.
Fig. 1.
—Relationship of gene log 2 ratios produced by aCGH and NGS read-depth. Each point represents the relative copy number for a single gene from the BROAD annotation. The methods share a positive correlation, confirming that they identify many of the same genomic regions as either gains or losses. The relationship is made more positive and the correlation is stronger when filtering out near-neutral CNVs, suggesting that both methods more precisely detect CNVEs with more extreme copy number ratios.
<sc>Fig</sc>. 2.
Fig. 2.
—Histogram of LAR indices for probe set within observed species-level CNVEs and 1,000 iterations of randomly selected probe sets. The LAR index is defined as the ratio of counts of probes that map to more loci in the long-read PacBio assembly compared with those that map to more loci in the short-read Illumina assembly for Or.ni. Loci counts for each probe are perfect BlastN hits for probes sequences within each genome. Random probe sets were selected to have identical numbers of both exonic and noncoding probes as our observed set.
<sc>Fig</sc>. 3.
Fig. 3.
—Heatmaps showing intraspecific variation in Cichlids. Six arrays were run for each of the three species shown (Metriaclima zebra, Neolamprologus brichardi, and Pundamilia nyererei), and heatmaps are sorted based on CNVE representation in different fractions of the six samples. The log 2 ratios highlight some clusters of CNVEs that were missed in some samples as a result of our CNV-calling thresholds of >0.8 and <−0.8, although the majority of CNVE calls appear as true individual variation based on aCGH data.
<sc>Fig</sc>. 4.
Fig. 4.
—Histogram showing size distribution of CNVEs among the 53 species. Bin size in main histogram is 20 kb, whereas inset representing the smallest overall bin shows bin sizes of 500 bp.
<sc>Fig</sc>. 5.
Fig. 5.
—CNVE count per species, sorted by tribe. The majority of CNVE gains and losses in all species contain coding elements.
<sc>Fig</sc>. 6.
Fig. 6.
—Heatmap showing RAxML clustering of CNVEs in all cichlid species using the model BINGAMMA. Hemichromis fasciatus (Hm.fa) was set as the outgroup, and bootstrap values are labeled at nodes. Despite low branch support at a majority of nodes, maximum likelihood tree corresponds well to tribe and radiation designations.
<sc>Fig</sc>. 7.
Fig. 7.
—Comparison of RAxML trees using CNVE gain and loss data versus ND2 and d-loop mitochondrial sequence data from 52/53 species examined in this study. RAxML models used were BINGAMMA and GTRGAMMA, respectively, for the two different data types. Sarotherodon knauerae (Sa.kn) was omitted for this comparison due to lack of quality sequence data for either of the two mitochondrial amplicons. Dendrograms are ordered for best alignment between data sets. Taxa highlighted in bold and italics are those that agree in exact placement between topologies as detected by TOPD.
<sc>Fig</sc>. 8.
Fig. 8.
—CNV hotspot map produced by HD-CNV. Input CNVs were concatenated outputs from DNAcopy segmentations from all individuals in study. Exact duplicate CNV coordinates were collapsed so all intervals were nonredundant, therefore this map is not biased toward recurrent called CNVs from As.bu reference samples. Nodes with warmer colors represent CNVs with higher numbers of unique overlapping CNVs and cool colors represent CNVs with fewer overlaps. HD-CNV parameters required 50% reciprocal overlap for CNV merges and 99% overlap for CNV families. Figure does not include any unplaced scaffolds.
<sc>Fig</sc>. 9.
Fig. 9.
—Enrichment of six classes of repetitive elements in sample-level and species-level CNVEs and 5′/3′ flanking regions as determined by binomial tests. CNVE 2- and 20-kb flanking regions were tested to capture actual region boundaries, accounting for underestimate of actual CNVE length due to array probe spacing in Or.ni genome. Results are presented as the proportion of observed CNVEs that contain more TEs of each class than randomly selected genomic intervals matched for approximate length, probe number, and sequence of probe types (exonic vs. noncoding). *P < Bonferroni corrected 0.05. **P < Bonferroni corrected 0.01.
<sc>Fig</sc>. 10.
Fig. 10.
—FDR heatmap for enriched GO categories of genes within subsets of observed CNVEs. Subsets include sample-level CNVEs, species-level CNVEs, CNVE hotspots, and CNVEs represented within each tribe. Tribes not listed in figure had no enriched GO categories. Each enrichment test set contains genes overlapping CNVEs and the reference set is the entire set of genes in the annotated Or.ni genome. Blank cells are not significant at FDR < 0.05.

Similar articles

  • The genomic substrate for adaptive radiation in African cichlid fish.
    Brawand D, Wagner CE, Li YI, Malinsky M, Keller I, Fan S, Simakov O, Ng AY, Lim ZW, Bezault E, Turner-Maier J, Johnson J, Alcazar R, Noh HJ, Russell P, Aken B, Alföldi J, Amemiya C, Azzouzi N, Baroiller JF, Barloy-Hubler F, Berlin A, Bloomquist R, Carleton KL, Conte MA, D'Cotta H, Eshel O, Gaffney L, Galibert F, Gante HF, Gnerre S, Greuter L, Guyon R, Haddad NS, Haerty W, Harris RM, Hofmann HA, Hourlier T, Hulata G, Jaffe DB, Lara M, Lee AP, MacCallum I, Mwaiko S, Nikaido M, Nishihara H, Ozouf-Costaz C, Penman DJ, Przybylski D, Rakotomanga M, Renn SCP, Ribeiro FJ, Ron M, Salzburger W, Sanchez-Pulido L, Santos ME, Searle S, Sharpe T, Swofford R, Tan FJ, Williams L, Young S, Yin S, Okada N, Kocher TD, Miska EA, Lander ES, Venkatesh B, Fernald RD, Meyer A, Ponting CP, Streelman JT, Lindblad-Toh K, Seehausen O, Di Palma F. Brawand D, et al. Nature. 2014 Sep 18;513(7518):375-381. doi: 10.1038/nature13726. Epub 2014 Sep 3. Nature. 2014. PMID: 25186727 Free PMC article.
  • Gene duplication in an African cichlid adaptive radiation.
    Machado HE, Jui G, Joyce DA, Reilly CR 3rd, Lunt DH, Renn SC. Machado HE, et al. BMC Genomics. 2014 Feb 26;15:161. doi: 10.1186/1471-2164-15-161. BMC Genomics. 2014. PMID: 24571567 Free PMC article.
  • African cichlid fish: a model system in adaptive radiation research.
    Seehausen O. Seehausen O. Proc Biol Sci. 2006 Aug 22;273(1597):1987-98. doi: 10.1098/rspb.2006.3539. Proc Biol Sci. 2006. PMID: 16846905 Free PMC article. Review.
  • Genome-wide RAD sequence data provide unprecedented resolution of species boundaries and relationships in the Lake Victoria cichlid adaptive radiation.
    Wagner CE, Keller I, Wittwer S, Selz OM, Mwaiko S, Greuter L, Sivasundar A, Seehausen O. Wagner CE, et al. Mol Ecol. 2013 Feb;22(3):787-98. doi: 10.1111/mec.12023. Epub 2012 Oct 12. Mol Ecol. 2013. PMID: 23057853
  • Genetic Variation and Hybridization in Evolutionary Radiations of Cichlid Fishes.
    Svardal H, Salzburger W, Malinsky M. Svardal H, et al. Annu Rev Anim Biosci. 2021 Feb 16;9:55-79. doi: 10.1146/annurev-animal-061220-023129. Epub 2020 Nov 16. Annu Rev Anim Biosci. 2021. PMID: 33197206 Review.

Cited by

References

    1. Altschul SF, et al. 1990. Basic local alignment search tool. J Mol Biol. 215(3):403–410. - PubMed
    1. Anseeuw D, et al. 2012. Extensive introgression among ancestral mtDNA lineages: phylogenetic relationships of the Utaka within the Lake Malawi cichlid flock. Int J Evol Biol. 2012:865603. - PMC - PubMed
    1. Azzouzi N, et al. 2015. Identification and characterization of cichlid TAAR genes and comparison with other teleost TAAR repertoires. BMC Genomics. 16(1):335.. - PMC - PubMed
    1. Bailey JA, et al. 2001. Segmental duplications: organization and impact within the current human genome project assembly. Genome Res. 11(6):1005–1017. - PMC - PubMed
    1. Baldwin BG, Sanderson MJ.. 1998. Age and rate of diversification of the Hawaiian Silversword alliance (Compositae). Proc Natl Acad Sci U S A. 95(16):9402–9406. - PMC - PubMed

Publication types