

Optimal lysine in diets for high-yielding lactating sows1
- PMID: 31504612
- PMCID: PMC6776283
- DOI: 10.1093/jas/skz286
Optimal lysine in diets for high-yielding lactating sows1
Abstract
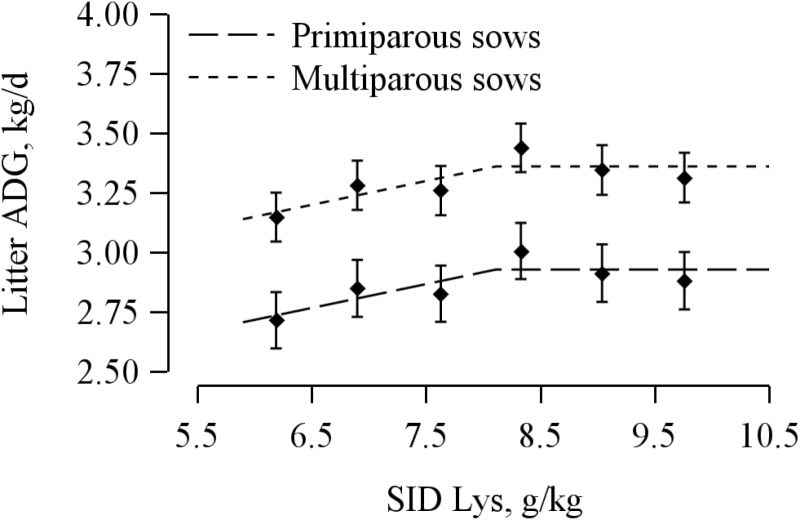
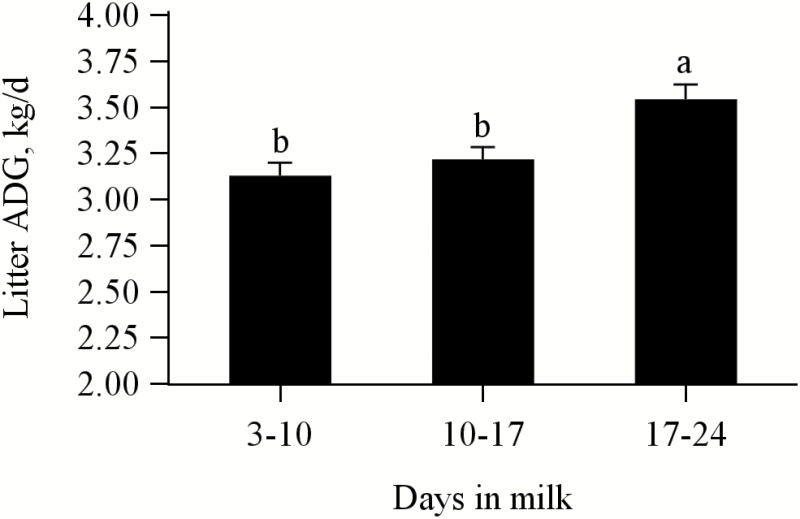
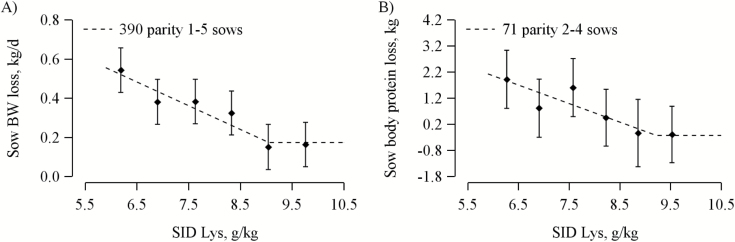
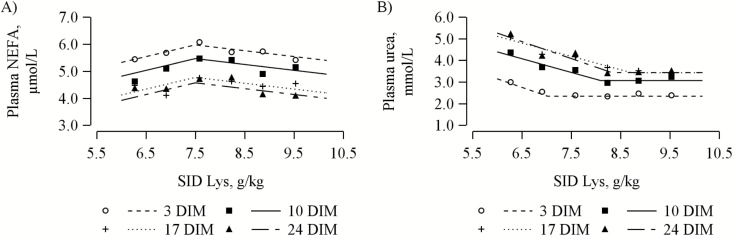
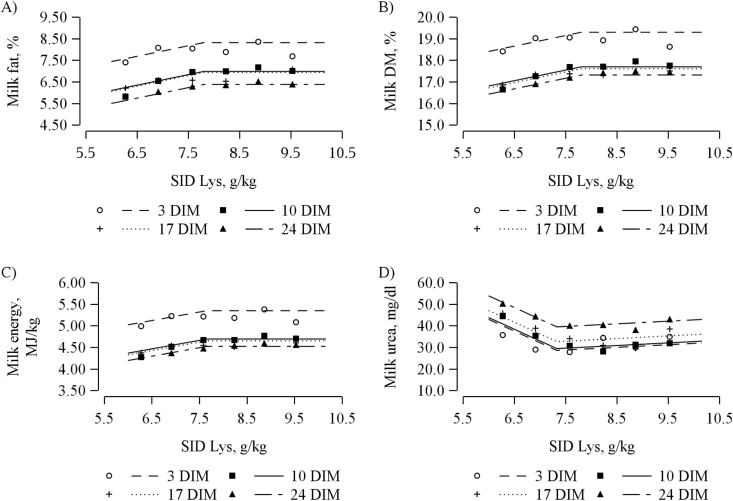
The objective of the current study was to determine the optimal concentration of dietary standardized ileal digestible (SID) Lys required to maximize litter gain and minimize sow BW loss in modern high-yielding lactating sows when SID CP was kept constant across dietary treatments. A total of 396 parity 1 to 5 sows (L × Y, DanBred, Herlev, Denmark) were included in the study from day 3 after farrowing until weaning at day 26. Sows were allocated to 6 dietary treatments increasing in SID Lys concentration (6.19, 6.90, 7.63, 8.33, 9.04, and 9.76 g/kg). Diets were isoenergetic (14.04 MJ ME/kg as-fed). Litters were standardized to 14 piglets at day 3 ± 2 d postpartum. At day 3 ± 2 d and at day 26 ± 3 d in lactation, litter weight, and sow BW and back fat were registered. On a subsample of 72 parity 2 to 4 sows, litters were additionally weighed at days 10 and 17 ± 3 d, and milk and blood were sampled at day 3 ± 2 d, and 10, 17 and at 24 ± 3 d in lactation. For the 72 sows, body pools of fat and protein were also determined at days 3 ± 2 and 26 ± 3 d using the D2O dilution technique. All data were analyzed as a randomized complete block design using PROC MIXED in SAS. Furthermore, data were subjected to linear and quadratic polynomial contrasts. Variables with quadratic or linear effects or days in milk × treatment interactions were selected for analysis in PROC NLMIXED using linear broken-line models to evaluate optimal SID Lys concentrations. Only models that converged and the best fitting models were included. Average daily litter gain increased until a breakpoint at 8.11 g/kg of SID Lys (as-fed). At and above the breakpoint, multiparous and primiparous sows had litter gains of 3.36 and 2.93 kg/d, respectively. Weaning litter size (13.0 ± 0.1) was similar between the 6 dietary treatments (P = 0.28). Lactation sow BW loss was minimized to 0.17 kg/d at 9.05 g/kg of SID Lys and sow body protein loss was minimized to 0.23 kg at 9.22 g/kg of SID Lys. Linear broken-line analyses showed that for 3, 10, 17, and 24 DIM, plasma urea was minimized at 7.02, 8.10, 8.73, and 8.32 g/kg of SID Lys, respectively, and milk fat was maximized at 7.80 g/kg of SID Lys. In conclusion, in our conditions, high-yielding lactating sows required 8.11 g/kg of SID Lys to maximize litter gain and 9.05 g/kg of SID Lys to minimize sow BW loss. Based on plasma urea, the optimal dietary concentration of SID Lys was lowest in week 1, intermediate in week 2 and 4, and greatest in week 3 of lactation.
Keywords: amino acid; blood metabolite; hyper-prolific sow; litter growth; milk composition; milk yield.
© The Author(s) 2019. Published by Oxford University Press on behalf of the American Society of Animal Science. All rights reserved. For permissions, please e-mail: journals.permissions@oup.com.
Figures
Similar articles
-
Optimal crude protein in diets supplemented with crystalline amino acids fed to high-yielding lactating sows1.J Anim Sci. 2019 Jul 30;97(8):3399-3414. doi: 10.1093/jas/skz200. J Anim Sci. 2019. PMID: 31190051 Free PMC article.
-
The standardized ileal digestible lysine-to-net energy ratio in the diets of lactating primiparous sows to optimize maternal nitrogen retention is dynamic but does not impact piglet performance.J Anim Sci. 2025 Jan 4;103:skaf168. doi: 10.1093/jas/skaf168. J Anim Sci. 2025. PMID: 40360290 Free PMC article.
-
The standardized ileal digestible lysine-to-net energy ratio in the diets of sows to optimize milk nitrogen retention is dynamic during lactation.J Anim Sci. 2024 Jan 3;102:skae094. doi: 10.1093/jas/skae094. J Anim Sci. 2024. PMID: 38558239 Free PMC article.
-
Review: Nutrient requirements of the modern high-producing lactating sow, with an emphasis on amino acid requirements.Animal. 2019 Dec;13(12):2967-2977. doi: 10.1017/S1751731119001253. Epub 2019 Jun 14. Animal. 2019. PMID: 31199216 Review.
-
l-Arginine supplementation for pregnant and lactating sows may improve the performance of piglets: A systematic review.J Anim Physiol Anim Nutr (Berl). 2025 Jan;109(1):76-95. doi: 10.1111/jpn.14031. Epub 2024 Aug 16. J Anim Physiol Anim Nutr (Berl). 2025. PMID: 39152530
Cited by
-
Dietary supplementation with lysine (protein) stimulates mammary development in late pregnant gilts.J Anim Sci. 2022 May 1;100(5):skac051. doi: 10.1093/jas/skac051. J Anim Sci. 2022. PMID: 35184195 Free PMC article.
-
Review: Physiology and nutrition of late gestating and transition sows.J Anim Sci. 2022 Jun 1;100(6):skac176. doi: 10.1093/jas/skac176. J Anim Sci. 2022. PMID: 35708593 Free PMC article.
-
Precision feeding of lactating sows: implementation and evaluation of a decision support system in farm conditions.J Anim Sci. 2022 Sep 1;100(9):skac222. doi: 10.1093/jas/skac222. J Anim Sci. 2022. PMID: 35714053 Free PMC article.
-
Importance of Selected Nutrients and Additives in the Feed of Pregnant Sows for the Survival of Newborn Piglets.Animals (Basel). 2024 Jan 27;14(3):418. doi: 10.3390/ani14030418. Animals (Basel). 2024. PMID: 38338061 Free PMC article. Review.
-
Effects of increasing standard Ileal digestible lysine and metabolizable energy levels in lactation diets fed to young and mature sows.J Anim Sci. 2025 Jan 4;102:skae247. doi: 10.1093/jas/skae247. J Anim Sci. 2025. PMID: 39180183 Free PMC article.
References
-
- Boyd R., Touchette K. J., Castro G. C., Johnston M. E., Lee K. U., and Han I. K.. 2000. Recent advances in amino acid and energy nutrition of prolific sows - review. Asian-Australas. J. Anim. Sci. 13:1638–1652. doi:10.5713/ajas.2000.1638 - DOI
-
- Chen S. Y., d’Mello J. P. F., Elsley F. W. H., and Taylor A. G.. 1978. Effect of dietary lysine levels on performance, nitrogen metabolism and plasma amino acid concentrations of lactating sows. Anim. Sci. 27:331–344. doi:10.1017/S0003356100036229 - DOI
-
- Chwalibog A. 2006. Nutritive value and nutrient requirements [In Danish: Næringsværdi og næringsbehov]. 7th rev. ed. Samfundslitteratur, Frederiksberg, Denmark.
-
- Clowes E. J., Aherne F. X., Schaefer A. L., Foxcroft G. R., and Baracos V. E.. 2003b. Parturition body size and body protein loss during lactation influence performance during lactation and ovarian function at weaning in first-parity sows. J. Anim. Sci. 81:1517–1528. doi:10.2527/2003.8161517x - DOI - PubMed
MeSH terms
Substances
LinkOut - more resources
Full Text Sources
Medical
Miscellaneous
