

Evidence That Blunted CD4 T-Cell Responses Underlie Deficient Protective Antibody Responses to Influenza Vaccines in Repeatedly Vaccinated Human Subjects
- PMID: 31504634
- PMCID: PMC8494023
- DOI: 10.1093/infdis/jiz433
Evidence That Blunted CD4 T-Cell Responses Underlie Deficient Protective Antibody Responses to Influenza Vaccines in Repeatedly Vaccinated Human Subjects
Abstract
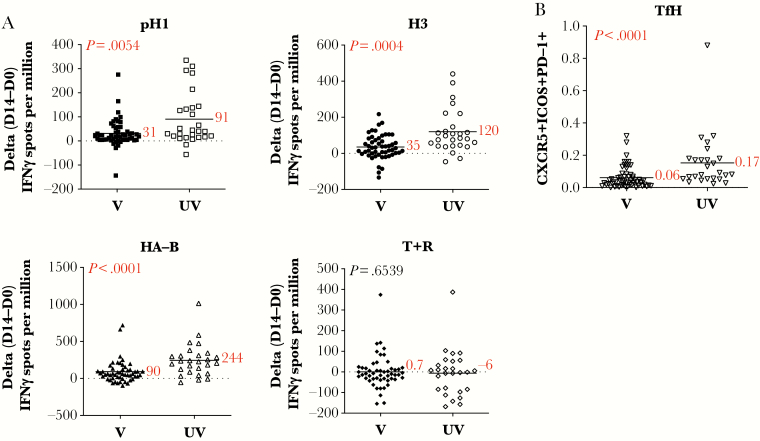
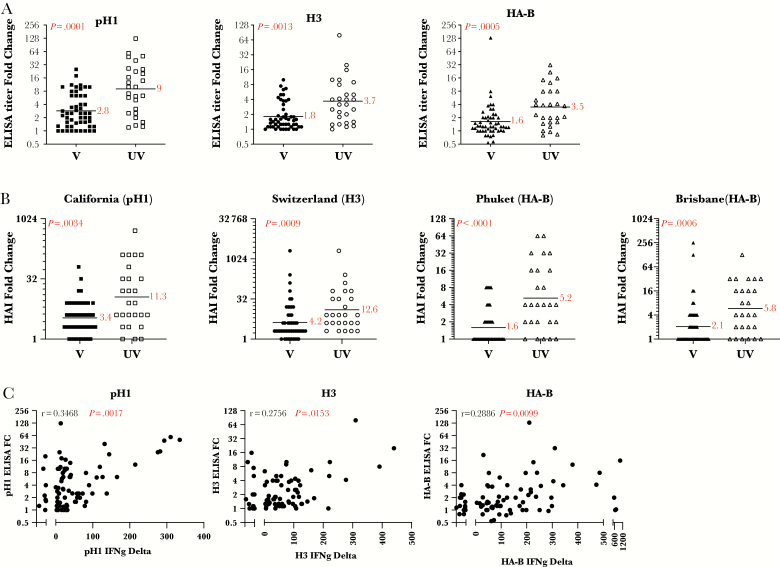
Despite the benefits of yearly influenza vaccination, accumulating evidence suggests that diminished vaccine efficacy may be related to repeated vaccination. Although studied at the level of B-cell responses, CD4 T-cell responses have not yet been examined. In this study, we analyze CD4 T-cell responses to influenza vaccination in subjects who differ in their vaccine history. We find a striking disparity in their responses, with previously vaccinated subjects exhibiting significantly blunted CD4 T-cell responses and diminished antibody responses. These results suggest that limiting CD4 T-cell help mteaserrlie the diminished or altered antibody responses in repeatedly vaccinated subjects.
Keywords: CD4 T cells; cell-mediated immunity; influenza vaccine; influenza virus.
© The Author(s) 2019. Published by Oxford University Press for the Infectious Diseases Society of America. All rights reserved. For permissions, e-mail: journals.permissions@oup.com.
Figures
Comment in
-
Repeated Seasonal Influenza Vaccination: How Much Is Too Much of a Good Thing?J Infect Dis. 2020 Jun 29;222(2):173-175. doi: 10.1093/infdis/jiz434. J Infect Dis. 2020. PMID: 31504654 No abstract available.
Similar articles
-
CD4+ T-cell expansion predicts neutralizing antibody responses to monovalent, inactivated 2009 pandemic influenza A(H1N1) virus subtype H1N1 vaccine.J Infect Dis. 2013 Jan 15;207(2):297-305. doi: 10.1093/infdis/jis684. Epub 2012 Nov 12. J Infect Dis. 2013. PMID: 23148285 Free PMC article.
-
Hemagglutinin-specific CD4+ T-cell responses following 2009-pH1N1 inactivated split-vaccine inoculation in humans.Vaccine. 2017 Oct 9;35(42):5644-5652. doi: 10.1016/j.vaccine.2017.08.061. Epub 2017 Sep 13. Vaccine. 2017. PMID: 28917539 Clinical Trial.
-
Modified vaccinia virus Ankara encoding influenza virus hemagglutinin induces heterosubtypic immunity in macaques.J Virol. 2014 Nov;88(22):13418-28. doi: 10.1128/JVI.01219-14. Epub 2014 Sep 10. J Virol. 2014. PMID: 25210172 Free PMC article.
-
Distinct and complementary roles of CD4 T cells in protective immunity to influenza virus.Curr Opin Immunol. 2018 Aug;53:13-21. doi: 10.1016/j.coi.2018.03.019. Epub 2018 Apr 2. Curr Opin Immunol. 2018. PMID: 29621639 Free PMC article. Review.
-
Influenza vaccines: the effect of vaccine dose on antibody response in primed populations during the ongoing interpandemic period. A review of the literature.Vaccine. 1993;11(9):892-908. doi: 10.1016/0264-410x(93)90375-8. Vaccine. 1993. PMID: 8212834 Review.
Cited by
-
Intranasal Nanoparticle Vaccination Elicits a Persistent, Polyfunctional CD4 T Cell Response in the Murine Lung Specific for a Highly Conserved Influenza Virus Antigen That Is Sufficient To Mediate Protection from Influenza Virus Challenge.J Virol. 2021 Jul 26;95(16):e0084121. doi: 10.1128/JVI.00841-21. Epub 2021 Jul 26. J Virol. 2021. PMID: 34076479 Free PMC article.
-
Aging and Options to Halt Declining Immunity to Virus Infections.Front Immunol. 2021 May 12;12:681449. doi: 10.3389/fimmu.2021.681449. eCollection 2021. Front Immunol. 2021. PMID: 34054872 Free PMC article. Review.
-
Immunogenicity of standard, high-dose, MF59-adjuvanted, and recombinant-HA seasonal influenza vaccination in older adults.NPJ Vaccines. 2021 Feb 16;6(1):25. doi: 10.1038/s41541-021-00289-5. NPJ Vaccines. 2021. PMID: 33594050 Free PMC article.
-
Immune imprinting: The persisting influence of the first antigenic encounter with rapidly evolving viruses.Hum Vaccin Immunother. 2024 Dec 31;20(1):2384192. doi: 10.1080/21645515.2024.2384192. Epub 2024 Aug 16. Hum Vaccin Immunother. 2024. PMID: 39149872 Free PMC article. Review.
-
Effect of Current-Season-Only Versus Continuous Two-Season Influenza Vaccination on Mortality in Older Adults: A Propensity-Score-Matched Retrospective Cohort Study.Vaccines (Basel). 2025 Feb 8;13(2):164. doi: 10.3390/vaccines13020164. Vaccines (Basel). 2025. PMID: 40006711 Free PMC article.
References
-
- Kim H, Webster RG, Webby RJ. Influenza virus: dealing with a drifting and shifting pathogen. Viral Immunol 2018; 31:174–83. - PubMed
-
- Krammer F. The human antibody response to influenza A virus infection and vaccination. Nat Rev Immunol 2019; 19:383–97. - PubMed
-
- Belongia EA, Skowronski DM, McLean HQ, Chambers C, Sundaram ME, De Serres G. Repeated annual influenza vaccination and vaccine effectiveness: review of evidence. Expert Rev Vaccines 2017; 16:1–14. - PubMed
Publication types
MeSH terms
Substances
Grants and funding
LinkOut - more resources
Full Text Sources
Medical
Research Materials
