. 2020 Apr 24;12(3):202-215.
doi: 10.1093/jmcb/mjz090.

Tumor cells educate mesenchymal stromal cells to release chemoprotective and immunomodulatory factors

Affiliations

Tumor cells educate mesenchymal stromal cells to release chemoprotective and immunomodulatory factors

Augustin Le Naour et al. J Mol Cell Biol. .

Abstract

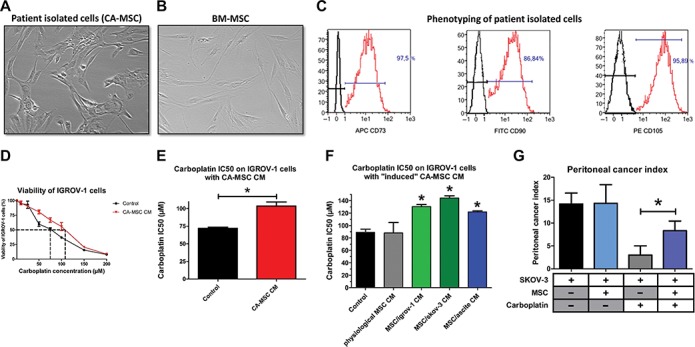
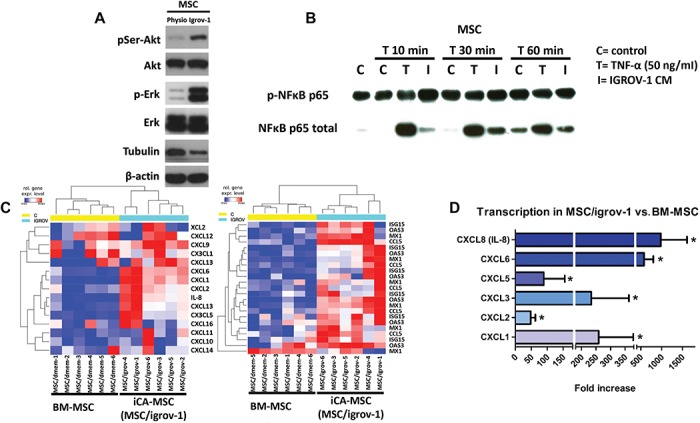
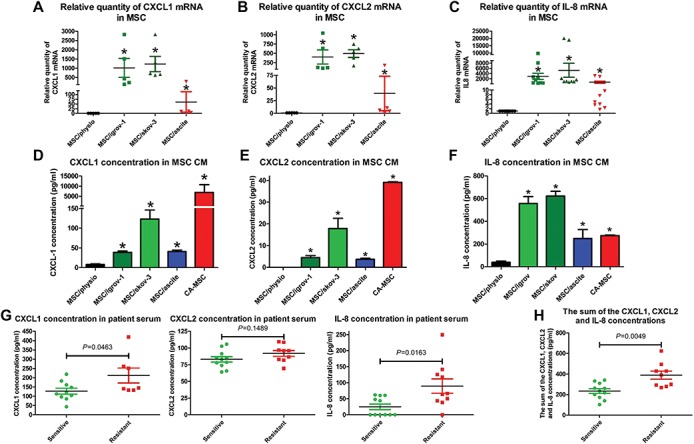
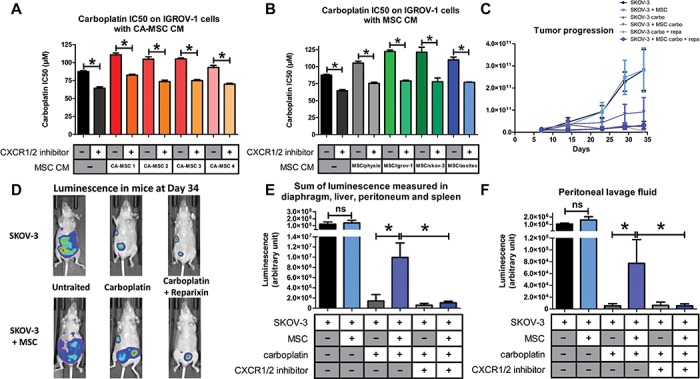
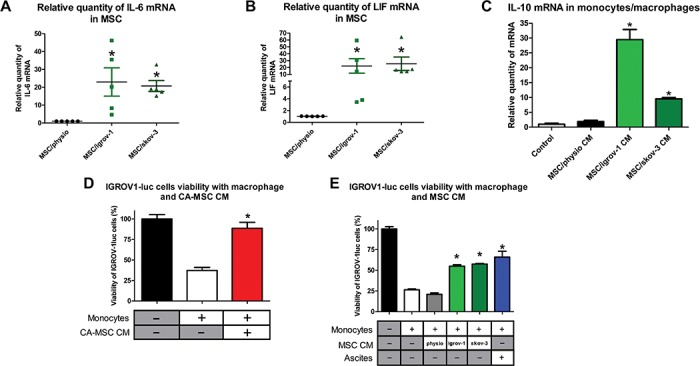
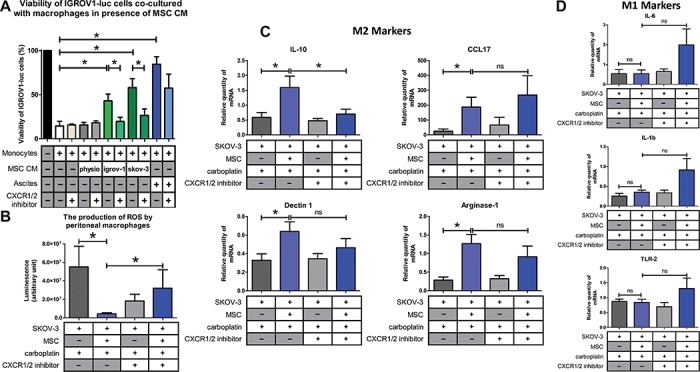
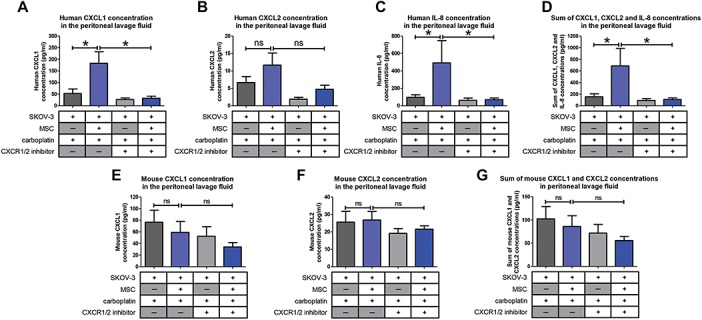
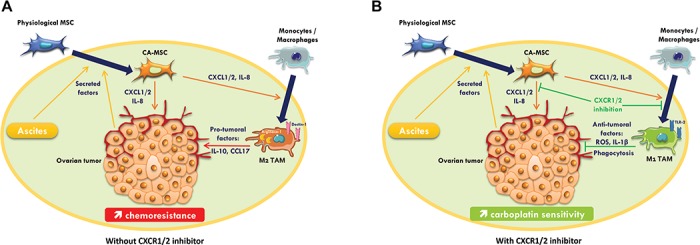
Factors released by surrounding cells such as cancer-associated mesenchymal stromal cells (CA-MSCs) are involved in tumor progression and chemoresistance. In this study, we characterize the mechanisms by which naïve mesenchymal stromal cells (MSCs) can acquire a CA-MSCs phenotype. Ovarian tumor cells trigger the transformation of MSCs to CA-MSCs by expressing pro-tumoral genes implicated in the chemoresistance of cancer cells, resulting in the secretion of high levels of CXC chemokine receptors 1 and 2 (CXCR1/2) ligands such as chemokine (C-X-C motif) ligand 1 (CXCL1), CXCL2, and interleukin 8 (IL-8). CXCR1/2 ligands can also inhibit the immune response against ovarian tumor cells. Indeed, through their released factors, CA-MSCs promote the differentiation of monocytes towards M2 macrophages, which favors tumor progression. When CXCR1/2 receptors are inhibited, these CA-MSC-activated macrophages lose their M2 properties and acquire an anti-tumoral phenotype. Both ex vivo and in vivo, we used a CXCR1/2 inhibitor to sensitize ovarian tumor cells to carboplatin and circumvent the pro-tumoral effects of CA-MSCs. Since high concentrations of CXCR1/2 ligands in patients' blood are associated with chemoresistance, CXCR1/2 inhibition could be a potential therapeutic strategy to revert carboplatin resistance.

Keywords: chemokines; chemoresistance; macrophages; mesenchymal stromal cells; ovarian adenocarcinoma.


Figures

Figure 1
Figure 1
The chemoresistance acquisition by OTCs through factors secreted by CA-MSCs. (A and B) Phenotype of stromal cells from patient biopsies and BM-MSCs (X40). (C) Flow cytometry analysis of stromal cells from patient biopsies. The expression of CD73, CD90, and CD105 was evaluated. (D) OTCs cultured alone or in the presence of CA-MSC CM were treated with increasing carboplatin concentrations for 48 h. Cell viability was measured for IGROV-1 cells cultured in control medium or in CA-MSC CM. The dotted line corresponds to 50% cell viability. (E) Histogram representing the mean carboplatin IC50 ± SEM on IGROV-1 cells cultured with CA-MSC CM (n = 12). (F) Histogram representing the carboplatin IC50 on IGROV-1 cells cultured with BM-MSC CM (physiological MSCs) or iCA-MSC CM from different origins (BM-MSCs cultivated with IGROV-1 CM, SKOV-3 CM, or ascites) (n = 4 for each type of MSC). (G) The mean value of the peritoneal cancer index ± SEM calculated in mice is presented (n = 6 mice/group). P-values of <0.05 (*) using a Wilcoxon–Mann–Whitney test indicate a significant difference.
Figure 2
Figure 2
Factors secreted by OTCs activate PI3K/Akt, MAPK, and NF-κB signaling pathways and modify gene expression in MSCs. (A) Akt, phospho-Akt (Ser473), Erk, and Phospho-Erk expression levels were assayed by western blot on physiological BM-MSC or MSC/igrov-1 (representative of three experiments). (B) BM-MSCs were cultured with IGROV-1 CM or with control medium (control) for the indicated amount of time. T represents treatment of the BM-MSCs with 50 ng/ml of TNFα. NF-κB and phospho-NF-κB p65 protein expression was assayed by western blot. (C) Representative gene expression of physiological BM-MSCs (n = 6) and iCA-MSCs (MSC/igrov-1) (n = 6). RNA was extracted and analyzed by Nanostring™ technology. (D) Quantification of the transcriptomic analysis showing the log2 fold change of the selected genes with an initial filter (SD > 0.25) to eliminate genes with little variation. An ANOVA test was applied to compare the six BM-MSC control samples versus the six iCA-MSC (MSC/igrov-1) samples. The P-values were corrected for multiple tests using the BH method.
Figure 3
Figure 3
Determination of the CXCR1/2 ligands secreted by CA-MSCs and iCA-MSCs. (AC) The upregulation of genes coding for CXCL1, CXCL2 and IL-8 was validated by RT-qPCR performed on RNA extracted from BM-MSCs and different types of iCA-MSCs (induced by IGROV-1 CM, SKOV-3 CM, or ascites). The data from BM-MSCs were set to 1 and the relative quantity of mRNA is shown. CXCL1 (A), CXCL2 (B), IL-8 (C). (DF) The concentrations of CXCL1, CXCL2, and IL-8 in the CM were quantified using ELISA kits. The CM from CA-MSCs was also tested. Histograms show the mean concentrations of CXCL1 (D), CXCL2 (E), and IL-8 (F) from three independent experiments performed in triplicate (mean ± SEM). (G) The CXCL1, CXCL2, and IL-8 concentrations were determined using ELISA kits on samples of serum from patients with ovarian adenocarcinoma collected at diagnosis. (H) The sum of the CXCL1, CXCL2, and IL-8 concentrations was obtained by adding together the serum concentration of these three chemokines. P-values of <0.05 (*) using a Wilcoxon–Mann–Whitney test indicate a significant difference.
Figure 4
Figure 4
Implication of the CXCR1/2 axis in OTC resistance to carboplatin. (A and B) The carboplatin IC50 was monitored as described previously in Figure 1. IGROV-1 cells were cultured in the presence or not of CM from BM-MSCs (MSC/physio), CA-MSCs (n = 4), or iCA-MSCs (MSC/igrov-1 and MSC/skov-3, MSC/ascite). At Day 1, cells were treated with carboplatin admixed or not with a CXCR1/2 inhibitor (100 μM). Cell viability was evaluated at Day 3. (C) Bioluminescence analysis through the whole body of the mice was performed once a week after an intraperitoneal injection of luciferin. (D) At Day 34, the whole-body bioluminescence of the mice was analyzed making it possible to obtain photographs to visualize and to quantify the luminescence illustrated here using one mouse per group. (E and F) On Day 36, the mice were euthanized and a peritoneal lavage was carried out with 5 ml of NaCl 0.9%. The peritoneum, spleen, liver, and diaphragm were removed. After addition of luciferin, the sum of the luminescence of the peritoneum, spleen, diaphragm, and liver (E) and the luminescence in the peritoneal lavage fluid (F) was measured. P-values of <0.05 (*) using a Wilcoxon–Mann–Whitney test indicate a significant difference.
Figure 5
Figure 5
CA-MSCs facilitate monocyte to macrophage differentiation towards the M2 TAM phenotype. (A and B) The relative expression of mRNA coding for IL-6 (A) and LIF (B) was evaluated on BM-MSCs and the iCA-MSCs (induced by IGROV-1 (MSC/igrov-1) or SKOV-3 (MSC/skov-3) CM). The data from BM-MSCs were set to 1 and the relative quantity of mRNA is shown. (C) IL-10 mRNA expression levels were analyzed in human monocytes cultured in control media or in MSC/physio, MSC/igrov-1, or MSC/skov-3 CMs. The data from control media were set at 1 and the relative quantity of mRNA is shown. (D and E) The cytotoxic activity of the macrophages that have been cultured in different media (CA-MSC, BM-MSC, MSC/igrov-1, or MSC/skov-3 CMs or ascites) toward the IGROV-1luc (expressing luciferase) cells was evaluated by measuring luciferase activity. Bar graphs representing the IGROV-1luc cells viability (%) (n = 4). P-values of <0.05 (*) using a Wilcoxon–Mann–Whitney test indicate a significant difference.
Figure 6
Figure 6
CXCR1/2 inhibition prevented the M2 macrophage polarization induced by CA-MSCs. (A) The cytotoxic activity of the macrophages was evaluated as described Figure 5D and E in the presence of a CXCR1/2 inhibitor. (B) The ROS production by peritoneal macrophages isolated from mice injected with SKOV-3 cells admixed or not with MSCs and treated or not with carboplatin +/− CXCR1/2 inhibitor was analyzed. (C and D) Gene expression analysis of peritoneal macrophages was analyzed by RT-qPCR (8 mice/group) on M2 (IL-10, CCL17, dectin-1, and arginase-1) and M1 (IL-6, IL-1β, and TLR-2) markers. P-values of <0.05 (*) using a Wilcoxon–Mann–Whitney test indicate a significant difference.
Figure 7
Figure 7
Levels of pro-inflammatory cytokines in the mouse peritonea. Levels of human and mouse chemokines CXCL1, CXCL2, and IL-8 in the mice peritonea were evaluated by ELISA (8 mice/group). P-values of <0.05 (*) using a Wilcoxon–Mann–Whitney test indicate a significant difference.
Figure 8
Figure 8
Roles of MSCs and macrophages on ovarian tumor. (A) Secreted factors by OTCs induce differentiation of MSC into CA-MSC, which in turn lead to the secretion of chemopreventive factors such as CXCL1/2 and IL-8. These chemokines polarize monocytes/macrophages to a M2 pro-tumoral phenotype promoting tumor growth. (B) CXCR1/2 inhibition restores carboplatin sensitivity in OTCs and reinstates the anti-tumoral activity of tumor-associated macrophages, thereby improving treatment efficiency.

Similar articles

Cited by

References

    1. Asimakopoulos F., Kim J., Denu R.A., et al. (2013). Macrophages in multiple myeloma: emerging concepts and therapeutic implications. Leuk. Lymphoma 54, mjz090 202 215–2121. - PMC - PubMed
    1. Beyar-Katz O., Magidey K., Ben-Tsedek N., et al. (2016). Bortezomib-induced pro-inflammatory macrophages as a potential factor limiting anti-tumour efficacy: Bortezomib-induced MM aggressiveness. J. Pathol. 239, 262–273. - PubMed
    1. Browne A., Sriraksa R., Guney T., et al. (2013). Differential expression of IL-8 and IL-8 receptors in benign, borderline and malignant ovarian epithelial tumours. Cytokine 64, 413–421. - PubMed
    1. Castells M., Milhas D., Gandy C., et al. (2013). Microenvironment mesenchymal cells protect ovarian cancer cell lines from apoptosis by inhibiting XIAP inactivation. Cell Death Dis. 4, e887. - PMC - PubMed
    1. Castells M., Thibault B., Mery E., et al. (2012). Ovarian ascites-derived Hospicells promote angiogenesis via activation of macrophages. Cancer Lett. 326, 59–68. - PubMed

Publication types

MeSH terms