

Elevated CO2 alleviates the negative impact of heat stress on wheat physiology but not on grain yield
- PMID: 31504692
- PMCID: PMC6859723
- DOI: 10.1093/jxb/erz386
Elevated CO2 alleviates the negative impact of heat stress on wheat physiology but not on grain yield
Abstract
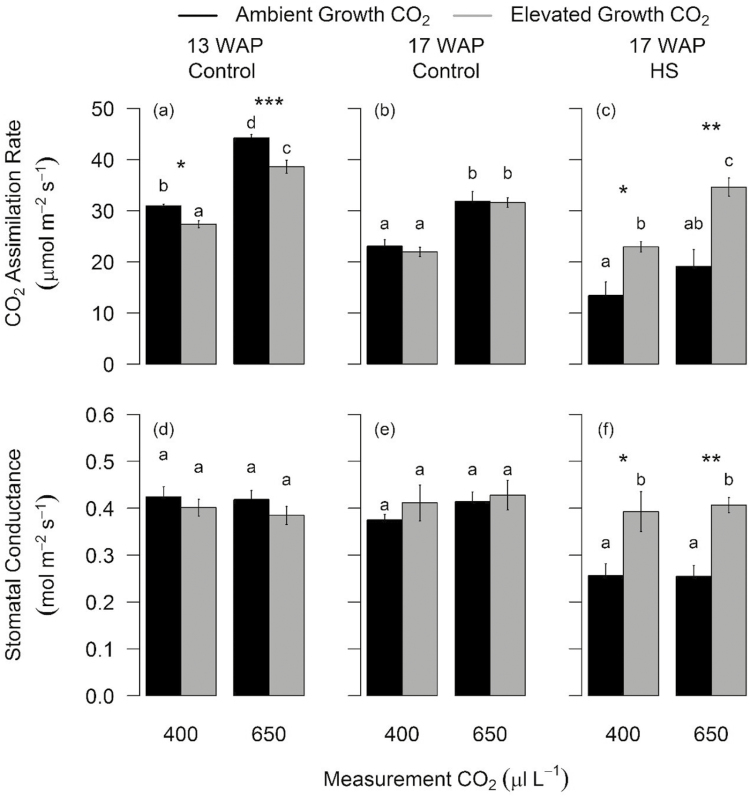
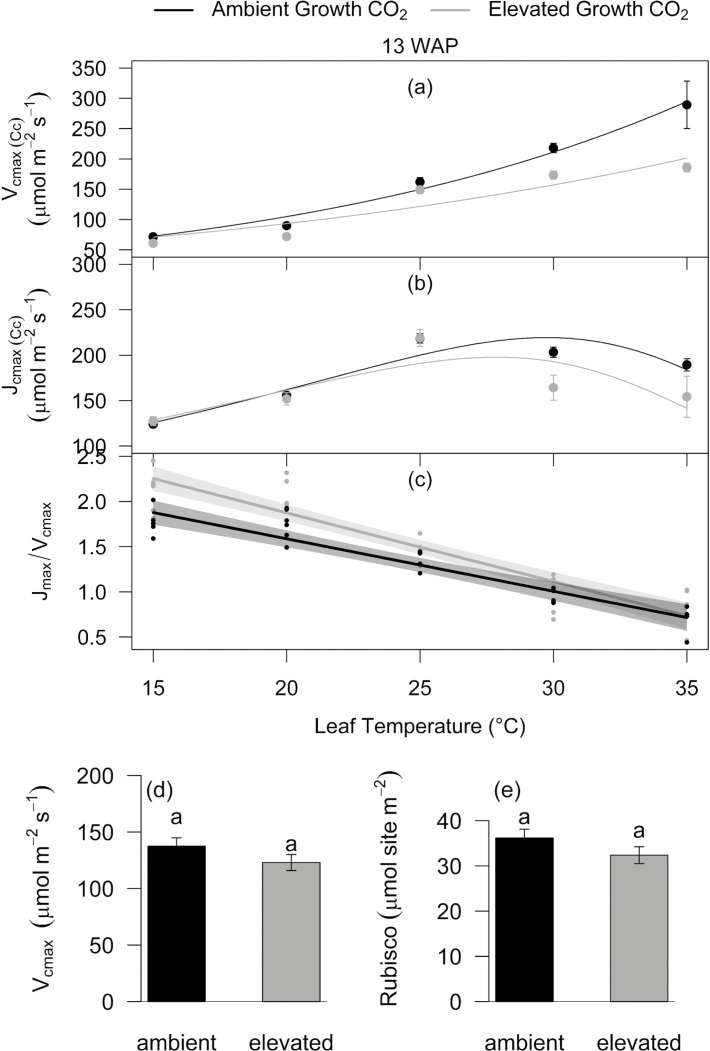
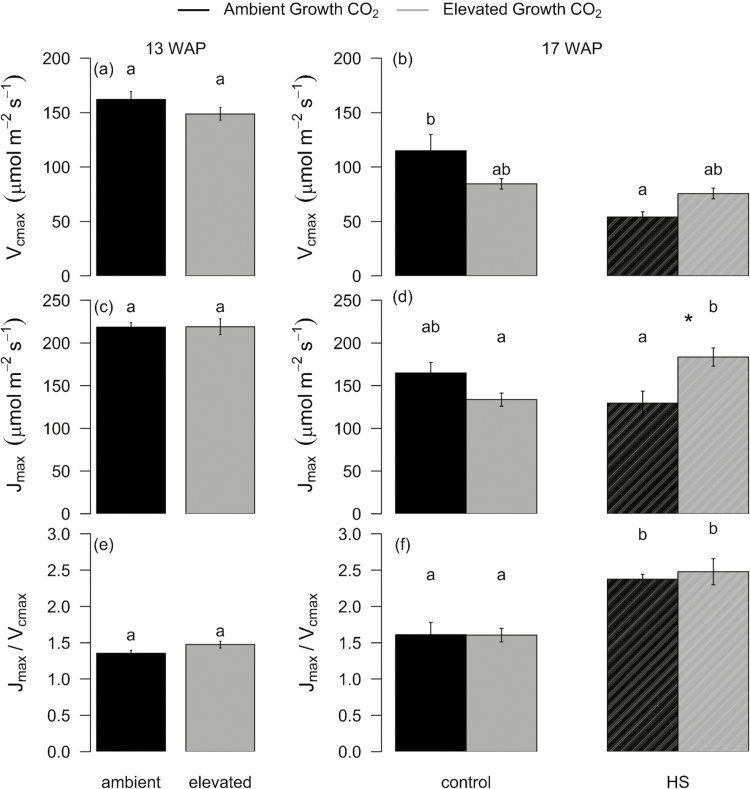
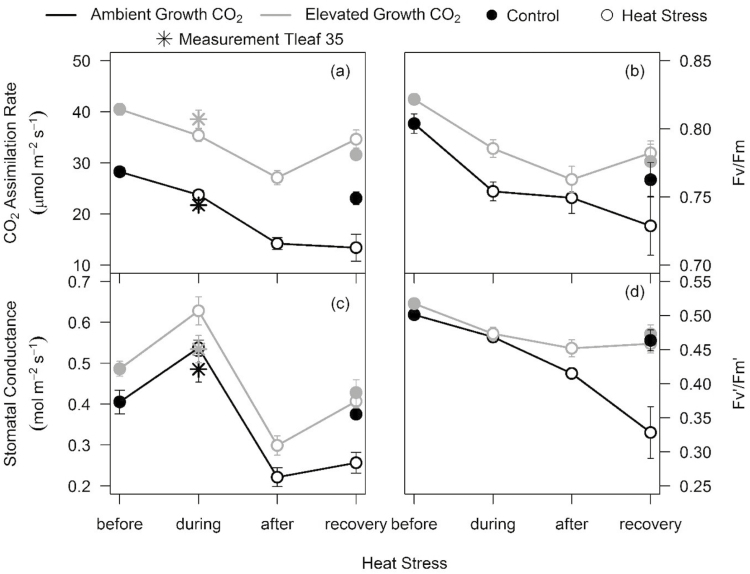
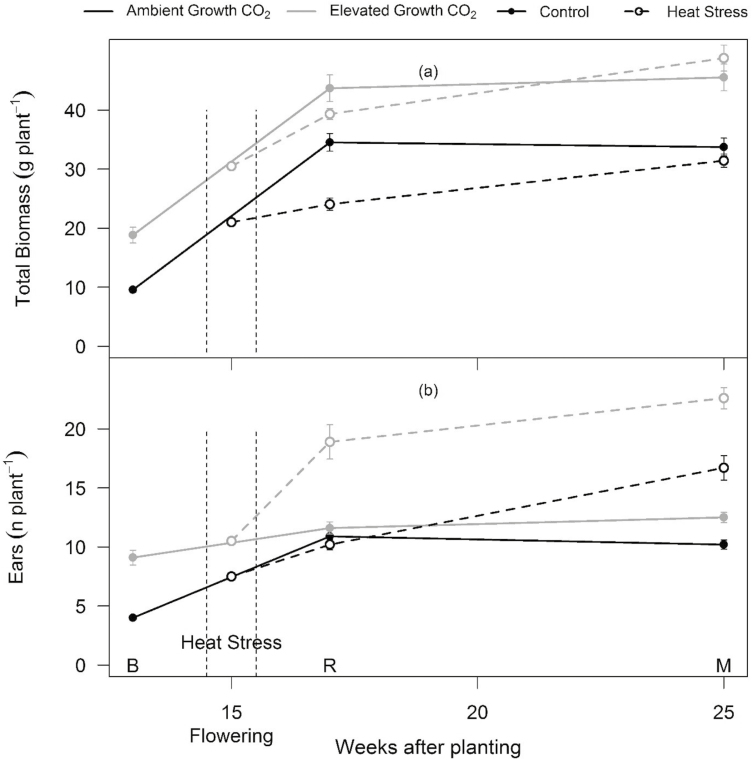
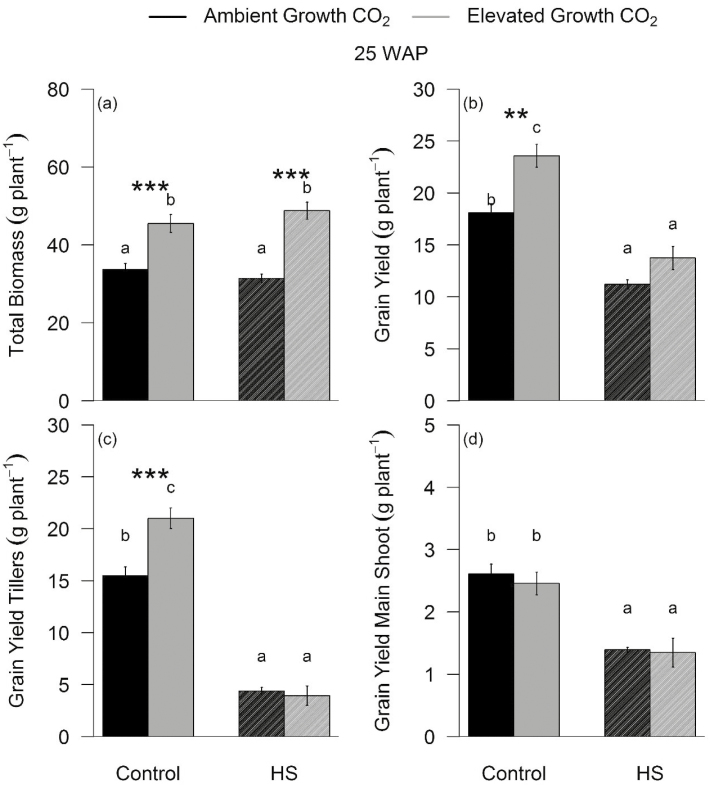
Hot days are becoming hotter and more frequent, threatening wheat yields worldwide. Developing wheat varieties ready for future climates calls for improved understanding of how elevated CO2 (eCO2) and heat stress (HS) interactively impact wheat yields. We grew a modern, high-yielding wheat cultivar (Scout) at ambient CO2 (aCO2, 419 μl l -1) or eCO2 (654 μl l-1) in a glasshouse maintained at 22/15 °C (day/night). Half of the plants were exposed to HS (40/24 °C) for 5 d at anthesis. In non-HS plants, eCO2 enhanced (+36%) CO2 assimilation rates (Asat) measured at growth CO2 despite down-regulation of photosynthetic capacity. HS reduced Asat (-42%) in aCO2- but not in eCO2-grown plants because eCO2 protected photosynthesis by increasing ribulose bisphosphate regeneration capacity and reducing photochemical damage under HS. eCO2 stimulated biomass (+35%) of all plants and grain yield (+30%) of non-HS plants only. Plant biomass initially decreased following HS but recovered at maturity due to late tillering. HS equally reduced grain yield (-40%) in aCO2- and eCO2-grown plants due to grain abortion and reduced grain filling. While eCO2 mitigated the negative impacts of HS at anthesis on wheat photosynthesis and biomass, grain yield was reduced by HS in both CO2 treatments.
Keywords: Climate change; elevated CO2; grain yield; heat stress; photosynthetic acclimation; temperature response; wheat.
© The Author(s) 2019. Published by Oxford University Press on behalf of the Society for Experimental Biology.
Figures
Similar articles
-
Moderate heat stress prevented the observed biomass and yield stimulation caused by elevated CO2 in two well-watered wheat cultivars.Plant Mol Biol. 2022 Nov;110(4-5):365-384. doi: 10.1007/s11103-022-01276-7. Epub 2022 Jun 1. Plant Mol Biol. 2022. PMID: 35648324 Free PMC article.
-
Soil and water warming accelerates phenology and down-regulation of leaf photosynthesis of rice plants grown under free-air CO2 enrichment (FACE).Plant Cell Physiol. 2014 Feb;55(2):370-80. doi: 10.1093/pcp/pcu005. Epub 2014 Jan 8. Plant Cell Physiol. 2014. PMID: 24406632 Free PMC article.
-
Elevated CO2 (free-air CO2 enrichment) increases grain yield of aluminium-resistant but not aluminium-sensitive wheat (Triticum aestivum) grown in an acid soil.Ann Bot. 2019 Feb 15;123(3):461-468. doi: 10.1093/aob/mcy171. Ann Bot. 2019. PMID: 30219854 Free PMC article.
-
Impact of climate change on wheat grain composition and quality.J Sci Food Agric. 2023 Apr;103(6):2745-2751. doi: 10.1002/jsfa.12289. Epub 2022 Nov 7. J Sci Food Agric. 2023. PMID: 36273267 Review.
-
Raising yield potential of wheat. II. Increasing photosynthetic capacity and efficiency.J Exp Bot. 2011 Jan;62(2):453-67. doi: 10.1093/jxb/erq304. Epub 2010 Oct 27. J Exp Bot. 2011. PMID: 21030385 Review.
Cited by
-
Short photoperiod attenuates CO2 fertilization effect on shoot biomass in Arabidopsis thaliana.Physiol Mol Biol Plants. 2021 Apr;27(4):825-834. doi: 10.1007/s12298-021-00968-6. Epub 2021 Mar 16. Physiol Mol Biol Plants. 2021. PMID: 33967465 Free PMC article.
-
De Novo Transcriptome Analysis of Durum Wheat Flag Leaves Provides New Insights Into the Regulatory Response to Elevated CO2 and High Temperature.Front Plant Sci. 2019 Dec 6;10:1605. doi: 10.3389/fpls.2019.01605. eCollection 2019. Front Plant Sci. 2019. PMID: 31921252 Free PMC article.
-
The Effects of Brief Heat During Early Booting on Reproductive, Developmental, and Chlorophyll Physiological Performance in Common Wheat (Triticum aestivum L.).Front Plant Sci. 2022 May 16;13:886541. doi: 10.3389/fpls.2022.886541. eCollection 2022. Front Plant Sci. 2022. PMID: 35651779 Free PMC article.
-
The reduced growth due to elevated CO2 concentration hinders the sexual reproduction of mature Northern pipevine (Aristolochia contorta Bunge).Front Plant Sci. 2024 Mar 20;15:1359783. doi: 10.3389/fpls.2024.1359783. eCollection 2024. Front Plant Sci. 2024. PMID: 38571710 Free PMC article.
-
Combinatorial impacts of elevated CO2 and temperature affect growth, development, and fruit yield in Capsicum chinense Jacq.Physiol Mol Biol Plants. 2023 Mar;29(3):393-407. doi: 10.1007/s12298-023-01294-9. Epub 2023 Mar 16. Physiol Mol Biol Plants. 2023. PMID: 37033763 Free PMC article.
References
-
- Ainsworth EA, Rogers A. 2007. The response of photosynthesis and stomatal conductance to rising [CO2]: mechanisms and environmental interactions. Plant, Cell & Environment 30, 258–270. - PubMed
-
- Alonso A, Pérez P, Martínez-Carrasco R. 2009. Growth in elevated CO2 enhances temperature response of photosynthesis in wheat. Physiologia Plantarum 135, 109–120. - PubMed
-
- Alonso A, Pérez P, Morcuende R, Martinez-Carrasco R. 2008. Future CO2 concentrations, though not warmer temperatures, enhance wheat photosynthesis temperature responses. Physiologia Plantarum 132, 102–112. - PubMed
-
- Amthor JS. 2001. Effects of atmospheric CO2 concentration on wheat yield: review of results from experiments using various approaches to control CO2 concentration. Field Crops Research 73, 1–34.
-
- Asseng S, Ewert F, Martre P, et al. . 2015. Rising temperatures reduce global wheat production. Nature Climate Change 5, 143–147.
Publication types
MeSH terms
Substances
LinkOut - more resources
Full Text Sources
