Characterization of the transient fluorescence wave phenomenon that occurs during H2 production in Chlamydomonas reinhardtii
- PMID: 31504725
- PMCID: PMC6859737
- DOI: 10.1093/jxb/erz380
Characterization of the transient fluorescence wave phenomenon that occurs during H2 production in Chlamydomonas reinhardtii
Abstract
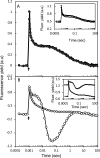
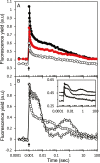
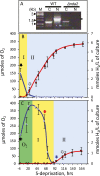
The redox state of the plastoquinone (PQ) pool in sulfur-deprived, H2-producing Chlamydomonas reinhardtii cells was studied using single flash-induced variable fluorescence decay kinetics. During H2 production, the fluorescence decay kinetics exhibited an unusual post-illumination rise of variable fluorescence, giving a wave-like appearance. The wave showed the transient fluorescence minimum at ~60 ms after the flash, followed by a rise, reaching the transient fluorescence maximum at ~1 s after the flash, before decaying back to the initial fluorescence level. Similar wave-like fluorescence decay kinetics have been reported previously in anaerobically incubated cyanobacteria but not in green algae. From several different electron and proton transfer inhibitors used, polymyxin B, an inhibitor of type II NAD(P)H dehydrogenase (NDA2), had the effect of eliminating the fluorescence wave feature, indicating involvement of NDA2 in this phenomenon. This was further confirmed by the absence of the fluorescence wave in the Δnda2 mutant lacking NDA2. Additionally, Δnda2 mutants have also shown delayed and diminished H2 production (only 23% if compared with the wild type). Our results show that the fluorescence wave phenomenon in C. reinhardtii is observed under highly reducing conditions and is induced by the NDA2-mediated electron flow from the reduced stromal components to the PQ pool. Therefore, the fluorescence wave phenomenon is a sensitive probe for the complex network of redox reactions at the PQ pool level in the thylakoid membrane. It could be used in further characterization and improvement of the electron transfer pathways leading to H2 production in C. reinhardtii.
Keywords: Chlamydomonas reinhardtii; hydrogen production; plastoquinone pool; sulfur deprivation; type II NDH; variable fluorescence.
© The Author(s) 2019. Published by Oxford University Press on behalf of the Society for Experimental Biology.
Figures


Similar articles
-
Characterization of the wave phenomenon of flash-induced chlorophyll fluorescence in Chlamydomonas reinhardtii.Photosynth Res. 2022 May;152(2):235-244. doi: 10.1007/s11120-022-00900-3. Epub 2022 Feb 15. Photosynth Res. 2022. PMID: 35166999 Free PMC article.
-
Biochemical and morphological characterization of sulfur-deprived and H2-producing Chlamydomonas reinhardtii (green alga).Planta. 2002 Feb;214(4):552-61. doi: 10.1007/s004250100660. Planta. 2002. PMID: 11925039
-
Interplay between non-photochemical plastoquinone reduction and re-oxidation in pre-illuminated Chlamydomonas reinhardtii: a chlorophyll fluorescence study.Photosynth Res. 2011 Oct;110(1):13-24. doi: 10.1007/s11120-011-9686-5. Epub 2011 Sep 24. Photosynth Res. 2011. PMID: 21948601
-
Photosynthetic H2 metabolism in Chlamydomonas reinhardtii (unicellular green algae).Planta. 2007 Oct;226(5):1075-86. doi: 10.1007/s00425-007-0609-9. Epub 2007 Aug 25. Planta. 2007. PMID: 17721788 Review.
-
Novel insights into the function of LHCSR3 in Chlamydomonas reinhardtii.Plant Signal Behav. 2015;10(12):e1058462. doi: 10.1080/15592324.2015.1058462. Plant Signal Behav. 2015. PMID: 26237677 Free PMC article. Review.
Cited by
-
Characterization of the wave phenomenon of flash-induced chlorophyll fluorescence in Chlamydomonas reinhardtii.Photosynth Res. 2022 May;152(2):235-244. doi: 10.1007/s11120-022-00900-3. Epub 2022 Feb 15. Photosynth Res. 2022. PMID: 35166999 Free PMC article.
-
Effects of mutations of D1-R323, D1-N322, D1-D319, D1-H304 on the functioning of photosystem II in Thermosynechococcus vulcanus.Photosynth Res. 2022 May;152(2):193-206. doi: 10.1007/s11120-022-00920-z. Epub 2022 May 3. Photosynth Res. 2022. PMID: 35503495
-
Characterization of the Flash-Induced Fluorescence Wave Phenomenon in the Coral Endosymbiont Algae, Symbiodiniaceae.Int J Mol Sci. 2023 May 13;24(10):8712. doi: 10.3390/ijms24108712. Int J Mol Sci. 2023. PMID: 37240058 Free PMC article.
-
Investigation of the effect of salt stress on photosynthetic electron transport pathways in the Synechocystis PCC 6803 cyanobacterium.Physiol Plant. 2025 Jan-Feb;177(1):e70066. doi: 10.1111/ppl.70066. Physiol Plant. 2025. PMID: 39868636 Free PMC article.
-
A multi-parametric screening platform for photosynthetic trait characterization of microalgae and cyanobacteria under inorganic carbon limitation.PLoS One. 2020 Jul 23;15(7):e0236188. doi: 10.1371/journal.pone.0236188. eCollection 2020. PLoS One. 2020. PMID: 32701995 Free PMC article.
References
-
- Alric J. 2014. Redox and ATP control of photosynthetic cyclic electron flow in Chlamydomonas reinhardtii: (II) involvement of the PGR5–PGRL1 pathway under anaerobic conditions. Biochimica et Biophysica Acta 1837, 825–834. - PubMed
-
- Antal TK, Krendeleva TE, Laurinavichene TV, Makarova VV, Ghirardi ML, Rubin AB, Tsygankov AA, Seibert M. 2003. The dependence of algal H2 production on Photosystem II and O2 consumption activities in sulfur-deprived Chlamydomonas reinhardtii cells. Biochimica et Biophysica Acta 1607, 153–160. - PubMed
-
- Antal TK, Krendeleva TE, Rubin AB. 2007. Study of photosystem 2 heterogeneity in the sulfur-deficient green alga Chlamydomonas reinhardtii. Photosynthesis Research 94, 13–22. - PubMed
-
- Antal TK, Kukarskikh GP, Bulychev AA, Tyystjärvi E, Krendeleva T. 2013. Antimycin A effect on the electron transport in chloroplasts of two Chlamydomonas reinhardtii strains. Planta 237, 1241–1250. - PubMed
Publication types
MeSH terms
Substances
LinkOut - more resources
Full Text Sources

