. 2019 Oct 10;47(18):9511-9523.
doi: 10.1093/nar/gkz759.

Nucleosome Dynamics: a new tool for the dynamic analysis of nucleosome positioning

Affiliations

Nucleosome Dynamics: a new tool for the dynamic analysis of nucleosome positioning

Diana Buitrago et al. Nucleic Acids Res. .

Abstract

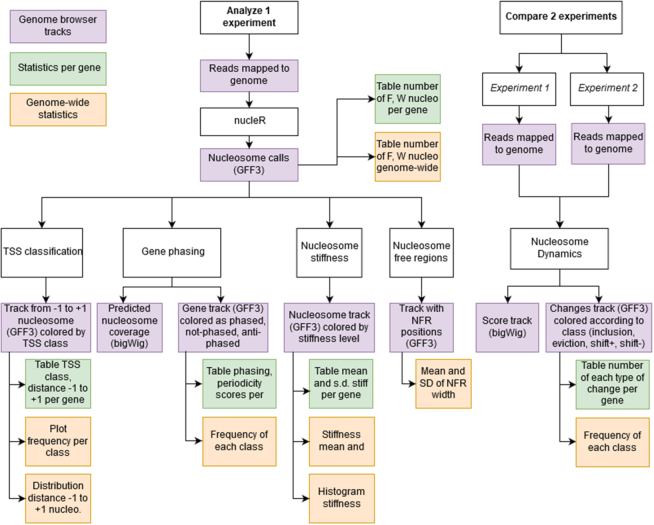
We present Nucleosome Dynamics, a suite of programs integrated into a virtual research environment and created to define nucleosome architecture and dynamics from noisy experimental data. The package allows both the definition of nucleosome architectures and the detection of changes in nucleosomal organization due to changes in cellular conditions. Results are displayed in the context of genomic information thanks to different visualizers and browsers, allowing the user a holistic, multidimensional view of the genome/transcriptome. The package shows good performance for both locating equilibrium nucleosome architecture and nucleosome dynamics and provides abundant useful information in several test cases, where experimental data on nucleosome position (and for some cases expression level) have been collected for cells under different external conditions (cell cycle phase, yeast metabolic cycle progression, changes in nutrients or difference in MNase digestion level). Nucleosome Dynamics is a free software and is provided under several distribution models.


Figures

Figure 1.
Figure 1.
Analysis pipeline for Nucleosome Dynamics. A single MNase-seq experiment can be analysed, obtaining: nucleosome calls with nucleR, their fuzzy/well-positioned classification and stiffness estimation, Nucleosome Free Regions location, classification of TSS according to −1 and +1 nucleosomes, and nucleosome phasing along the gene body. Comparing two MNase-seq experiments, NucDyn identifies hotspots of changes (SHIFT +, SHIFT -, INCLUSION and EVICTION), and reports a significance score of the difference in the coverage profiles at base-pair level. Summary statistics per gene as well as genome-wide are also reported for each calculation.
Figure 2.
Figure 2.
Visualization of Nucleosome Dynamics results in MuGVRE. (A) Nucleosome positioning along ACE2 (YLR131C) gene from S. cerevisiae between G2 and M cell cycle phases (a) YLR131C open reading frame; (b) ACE2 full length transcripts; (c), (c') coverage of MNase-seq reads aligned to reference genome (in G2 and M phase, respectively); (d), (d') nucleosome calls obtained with nucleR (G2 and M phase, respectively); (e) NFR coordinates in G2 phase; (f) prediction of the nucleosome coverage along each gene, using signals from +1 and -last nucleosomes; (g) genes shown as coloured boxes according to the phasing between the +1 and -last nucleosomes; (h) TSS classification based on nucleosomes −1 and +1 (W, F, missing) and the distance between them (open or close) represented as coloured boxes, with an arrow indicating the direction of the gene; (i) nucleosomes are coloured by their apparent stiffness value: darker blue nucleosomes are more stiff and lighter are less stiff; (j) significance of the differences in nucleosome coverage between G2 and M phases (-log10 of the p-value) (k) movement hotspots represented as colour coded boxes: purple for shift +, blue for shit -, green for inclusion and red for eviction; (l,m, n, o) Tracks from publicly available data representing (l) TATA elements (Rhee et al., 2012), (m) TFIIB binding sites (Mayer et al., 2010), (n) H3K4me3 histone mark enrichment (Liu et al., 2005) and (o) gene expression changes during cell cycle (Deniz et al., 2016). (B) Detailed view around a hotspot identified by NucDyn in chrXII. (C) Genome wide statistics of NFR width around TSS, in G2 phase. (D) Genome wide frequency of changes detected by NucDyn between G2 and M.
Figure 3.
Figure 3.
Performance of nucleR and NucDyn. (A) Coverage of three synthetic nucleosome maps (shown in grey), containing well-positioned (dark blue) and fuzzy nucleosomes (light blue). Two possible nucleosome families generate different nucleosome positioning in fuzzy regions (Fam1 and Fam2). Predicted nucleosome positions using nucleR and Danpos are shown in green and purple, respectively. (B) Comparison of nucleR and Danpos for detection of a second family of nucleosomes (light blue nucleosome in the bottom-right panel). Y-axis shows the number of cells required in the second family in order to be detected by the algorithm. (C) Distance between the dyads identified by nucleR (green) and DANPOS (purple) to the dyad position in the true synthetic nucleosome map for fuzzy and well positioned nucleosomes. (D) Sensitivity of the EVICTION prediction for NucDyn, DANPOS and Dimnp. Evictions were simulated removing reads from a given percentage of families (10%, 20%, …, 90%) and were identified from DANPOS output as a nucleosome with point_log2FC < −1 and point_diff_FDR < 0.01 (point with highest difference in the two samples, as reported by the software), and with default parameters for Dimnp. (E) Sensitivity of the SHIFT prediction computed on synthetic nucleosome maps. Shifts were introduced displacing reads from 1 to 5 DNA turns and modifying different percentages of the families (10%, 20%, …, 90%).
Figure 4.
Figure 4.
Nucleosome Dynamics along the cell cycle. (A) Percentage of fuzzy and well-positioned nucleosomes and (B) promoter classification (number of genes in each class) for every cell cycle stage. (C) GO terms enriched in genes with nucleosome changes between G1 and S detected by NucDyn. (D) Example of three cell-cycle dependent genes that present differential nucleosome architectures between G1 and S. In gray, the normalized coverage from the BAM files of the two cell cycle stages, 500 bp upstream and 1000 bp downstream the TSS. Below each BAM file, the nucleosome calls obtained with nucleR are represented (dark blue for well-positioned nucleosomes, light blue for fuzzy nucleosomes). The fifth track contains shifts (yellow for positive, blue for negative), inclusions (green) and evictions (red) identified by NucDyn.
Figure 5.
Figure 5.
Nucleosome Dynamics in two points of the YMC. Promoter classification in the two time points (T9 and T12) for (A) all genes, (B) genes from the Ox cluster and (C) genes from the R/C cluster. (D and E) Example of three genes from Ox and 3 from R/C clusters that present differential nucleosome architectures between T9 and T12. In grey, the normalized coverage from the BAM files of the two time points, 500 bp upstream and 1000 bp downstream the TSS. Below each BAM file, the nucleosome calls obtained with nucleR are represented (dark blue for well-positioned nucleosomes, light blue for fuzzy nucleosomes). The fifth track contains shifts (yellow for positive, blue for negative), inclusions (green) and evictions (red) identified by NucDyn.
Figure 6.
Figure 6.
Nucleosome Dynamics under different nutrient conditions. (A) Promoter classification in glucose, galactose and ethanol rich media. (B and C) GO terms enriched in genes with nucleosome changes detected by NucDyn, changing the medium from glucose to galactose or ethanol, respectively. (D and E) Example of three genes involved in galactose and ethanol metabolism, respectively, that present differential nucleosome architectures depending on the carbon source. In gray, the normalized coverage from the BAM files of the two cell cycle stages, 500 bp upstream and 1000 bp downstream the TSS. Below each BAM file, the nucleosome calls obtained with nucleR are represented (dark blue for well-positioned nucleosomes, light blue for fuzzy nucleosomes). The fifth track contains shifts (yellow for positive, blue for negative), inclusions (green) and evictions (red) identified by NucDyn.

Similar articles

Cited by

References

    1. Barski A., Cuddapah S., Cui K., Roh T.-Y., Schones D.E., Wang Z., Wei G., Chepelev I., Zhao K.. High-Resolution profiling of histone methylations in the human genome. Cell. 2007; 129:823–837. - PubMed
    1. Mavrich T.N., Jiang C., Ioshikhes I.P., Li X., Venters B.J., Zanton S.J., Tomsho L.P., Qi J., Glaser R.L., Schuster S.C. et al. .. Nucleosome organization in the Drosophila genome. Nature. 2008; 453:358–362. - PMC - PubMed
    1. Yuan G.-C. Genome-Scale Identification of Nucleosome Positions in S. cerevisiae. Science. 2005; 309:626–630. - PubMed
    1. Lai W.K.M., Pugh B.F.. Understanding nucleosome dynamics and their links to gene expression and DNA replication. Nat. Rev. Mol. Cell Biol. 2017; 18:548–562. - PMC - PubMed
    1. Rando O.J., Ahmad K.. Rules and regulation in the primary structure of chromatin. Curr. Opin. Cell Biol. 2007; 19:250–256. - PubMed

Publication types

MeSH terms