. 2019 Oct 10;47(18):9741-9760.
doi: 10.1093/nar/gkz725.

Programmed genome rearrangements in Oxytricha produce transcriptionally active extrachromosomal circular DNA

Affiliations

Programmed genome rearrangements in Oxytricha produce transcriptionally active extrachromosomal circular DNA

V Talya Yerlici et al. Nucleic Acids Res. .

Abstract

Extrachromosomal circular DNA (eccDNA) is both a driver of eukaryotic genome instability and a product of programmed genome rearrangements, but its extent had not been surveyed in Oxytricha, a ciliate with elaborate DNA elimination and translocation during development. Here, we captured rearrangement-specific circular DNA molecules across the genome to gain insight into its processes of programmed genome rearrangement. We recovered thousands of circularly excised Tc1/mariner-type transposable elements and high confidence non-repetitive germline-limited loci. We verified their bona fide circular topology using circular DNA deep-sequencing, 2D gel electrophoresis and inverse polymerase chain reaction. In contrast to the precise circular excision of transposable elements, we report widespread heterogeneity in the circular excision of non-repetitive germline-limited loci. We also demonstrate that circular DNAs are transcribed in Oxytricha, producing rearrangement-specific long non-coding RNAs. The programmed formation of thousands of eccDNA molecules makes Oxytricha a model system for studying nucleic acid topology. It also suggests involvement of eccDNA in programmed genome rearrangement.


Figures

Figure 1.
Figure 1.
Genome rearrangements in Oxytricha. (A) Cartoon illustrating Oxytricha’s dual genome architectures. The germline micronuclear genome comprises of long chromosomes that mostly contain germline-limited sequences (gray line). Somatic macronuclear nanochromosomes contain only MDSs (blue rectangles). MDSs belonging to two different MAC nanochromosomes are labeled with letters or numbers. Short colored blocks with matching color denote pointers, short direct repeats that are present downstream of the nth MDS and upstream of (n + 1)th MDS. Black blocks at the ends of nanochromosomes denote telomeres, added de novo during genome rearrangement. The chromosome copy numbers are represented by 2n and ∼2000n for the MIC and MAC genomes, respectively. (B) A model for circular TBE elimination during rearrangement. Elimination of transposon-like sequences called TBEs (in gray) via precise excisions at the ANT target site duplication (purple) and subsequent circularization based on previous work is shown (17).
Figure 2.
Figure 2.
Experimental and bioinformatic pipeline to identify eccDNA in Oxytricha genome-wide. (A) Experimental pipeline to enrich for and sequence eccDNAs. Gray lines represent whole-cell DNA (either linear or circular). Gray clouds represent the Nextera transposome, which simultaneously fragments DNA and ligates the blue and red Illumina sequencing primers to the DNA fragments. (B) Three bioinformatic metrics are used to identify eccDNA: (i) Junction reads in which the 5′ and 3′ portions of chimeric-reads (green and pink) coming from circle junctions map to the linear MIC genome assembly in a permuted order, as shown, (ii) When a small circular DNA molecule is cut only once by the Nextera transposome, via a 9 bp staggered cut, it will produce a signature 9 bp duplication at the 5′ ends of the reads in a pair that is a bioinformatic signature for circular topology in non-repetitive regions, (iii) Exonuclease digested libraries will have increased coverage in loci that give rise to eccDNA, compared to non-exonuclease treated samples. Paired-end reads are represented as two lines where the two reads in a pair are red and blue. (C) Hypothetical pathway for the excision of an IES (in gray) via recombination at pointers (orange). The circular junction read is shown as part green and part pink to illustrate regions of partial MIC alignment, where the pink and green portions map upstream and downstream of the IES, respectively. The coordinates for the split alignments for a circular junction read can then be used to infer (i) cut sites that would lead to the excision of the IES and (ii) whether direct repeats flank the circularly excised loci.
Figure 3.
Figure 3.
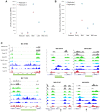
Circular DNA enrichment coupled to deep-sequencing reveals circularly excised TBEs. (A) Counts of Illumina reads that map to circular TBE junctions in the various samples across development were normalized to the total number of mapped reads in each library (RPM). The mid-rearrangement replicate 1 sample that was not treated with the exonuclease is represented by –exo. Asexual, early and mid-rearrangement samples were done as two biological replicates. (B) Circular DNA sequencing pipeline enriched for circularly excised TBE junction reads that can be classified into three groups according to the 5 bp central sequence at the junction. The outlined GANTC motif is the previously identified circular junction (17). (C) The consensus sequence (73) of the TIR from 2636 TBEs in the MIC genome assembly (1,32) was generated by searching for partially conserved A2C4A4C4 and G4T4G4T2 telomeric motifs at both ends, allowing for detection of variation internal to the TSD. Positions 5 to 7 and −7 to −5 are the ANT TSD. Positions 1 to 4 and −1 to −4 show the 4 nt flanking the TSD. The nucleotide distribution at position −4 (also marked with an asterisk) has the following nucleotide distribution: 19% C, 52% G, 22% A and 7% T. On the TBE circle junction motif, this nucleotide corresponds to the one marked with an asterisk in (B).
Figure 4.
Figure 4.
Circulome-seq also reveals circularly excised non-repetitive MIC-limited loci. (A) Circular junction reads in non-repetitive MIC-limited loci were counted and normalized to the total number of mapped reads in each library (RPM). (B) Paired-end reads containing the signature 9 bp duplication at the 5′ ends were counted and normalized to the total number of mapped reads in each library (RPM). (C) Example genome tracks during development showing mapped reads that were enriched for circular DNA as well as −exo that was not enriched (light blue track). Biological replicates are shown with the same color and are represented by R1 and R2. The y-axis represents sequencing coverage of reads that were subsampled to normalize for sequencing depth. Loci shown in MIC 67460, MIC 71470, MIC67570, MIC87955 were detected via circular junction reads and are annotated as high confidence circles (shown as green blocks). Loci shown in MIC 67187 and MIC 88761 contained paired-end reads with the 9 bp signature duplication shown with black arrows.
Figure 5.
Figure 5.
Characteristics of high confidence rearrangement-specific eccDNA. (A) For the 2432 high confidence eccDNA identified in mid-rearrangement, the distance to the nearest MDS boundary was measured and shown as red points. The distances are binned according to the values specified on the x-axis. The set of 2432 high confidence eccDNA were randomized 500 times across the MIC assembly and the blue points represent the mean frequency of each bin for the simulated data. The error bars on the simulated data represent three standard deviations. (B) The locations of 933 cut sites inferred from high confidence eccDNA that are within 50 bp of an MDS boundary that also have high confidence pointer annotations are shown. Each bar represents 1 bp, with the exception of the dark orange bar in the middle of the pointer, which represents all cut sites within variable length pointers. The distribution of cut sites inside IESs is significantly different from the distribution of cut sites inside MDSs (Kolmogorov–Smirnov test, P-value = 4.108 × 10⁻¹⁵). (C) The length of the direct repeats flanking circularly excised loci for the 2432 high confidence eccDNA are shown.
Figure 6.
Figure 6.
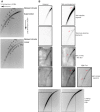
Validating and further investigating the circular conformation and topology of bona fide eccDNA using 2D agarose gel electrophoresis. (A) Whole-cell DNA from asexually growing cells was separated on a 2D agarose gel with spiked-in relaxed circular, supercoiled circular and linear DNA standards showing separation of topologically different DNA molecules. Numbers represent size of the spike-in standards in kb. (B) Whole-cell DNA during asexual growth and rearrangement was separated on a 2D agarose gel and coupled to Southern blotting with probes specific for 380 nt satellite repeats, TBEs, a 5 kb and 3 kb IES that were annotated to contain high confidence circles. The same gel was stained with ethidium bromide to show equal loading of DNA. Membranes were stripped and reprobed sequentially for the four loci. Whole-cell DNA during mid-rearrangement was cut with BglII, which has a single target restriction site in the 5 kb IES circle in parental strain JRB310, leading to a 5 kb linear fragment. The other parental strain, JRB510, has two BglII restriction sites producing a 1.8 kb linear fragment that contains the probe hybridization target site. The cut DNA was separated on a 2D gel similar to the previous uncut samples and probed for the 5 kb IES circle. Red arrows mark the spots at the expected sizes for the two parental strains or overlapping the arc of linear DNA.
Figure 7.
Figure 7.
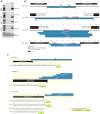
Inverse PCR validation of rearrangement-specific eccDNA. (A) Inverse PCR using primer pairs that point away from each other were used to validate circularly excised loci identified by circular junction reads (MIC67570 and MIC87955) and 9 bp duplications (MIC 67187 and MIC 88761). P1 and P2 represent whole-cell DNA from asexually growing parental strains. Mid-R represents whole-cell DNA from cells during mid-rearrangement. Mitochondrial primers (Mito) were used to show equal loading of whole-cell DNA. (B) Clones obtained from inverse PCR products amplified using primer pairs that point away from each other (shown as pink arrows) were sequenced and are shown as blue bars. MDS annotations and pointers flanking IESs are shown as black and gray arrows respectively. (C) Terminal transferase treatment of genomic DNA during mid-rearrangement suggests variable 3′ DNA breaks at MDS boundaries for three loci. Green arrows indicate where the dGTP tracts are added by the terminal transferase. The black vertical arrows indicate where the 3′ breaks map, as determined by the dGTP tracts. MIC 67570 contains an encoded G at the site of G-tailing, which leads to 1 nt ambiguity in mapping the precise 3′ breakpoint, denoted by two black arrows shown side by side. One clone for MIC72448 indicates polyG addition downstream of the MDS 13–14 junction (yellow arrow indicates partial match to MDS14), suggesting that this clone likely originates from either the old degrading MAC or a partially rearranged molecule. The total number of clones sequenced and the number of clones that correspond to the mapped ends are noted before each electropherogram.
Figure 8.
Figure 8.
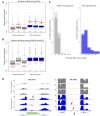
Rearrangement-specific transcription from high confidence eccDNA. (A) Red lines show mean RNA-seq read counts normalized by circle length for 2432 high confidence eccDNA. The 2432 intervals were randomly shuffled 1000 times among all IESs, genome-wide. The boxplots indicate the simulated distribution for the 1000 randomizations. Gray boxplots represent RNA-seq data collected in triplicate before early rearrangement, 12 h post-mixing. Blue boxplots represent RNA-seq data collected in triplicate in mid-rearrangement. Values under the boxplots represent the percentages of dots in the randomized set that fall below the observed mean RNA-seq read counts for the annotated eccDNA. (B) The 2432 eccDNA intervals were randomly shuffled throughout the whole MIC assembly, including MDSs that contain gene sequences. The boxplots indicate the simulated distribution for the 1000 randomizations throughout the whole MIC assembly. (C) Horizontal RNA-seq read coverage was calculated as the fraction of each eccDNA across its length with at least one read mapped. Gray histogram represents three RNA-seq replicates collected prior to rearrangement. Purple histogram represents three RNA-seq replicates collected at mid-rearrangement. (D) Genome tracks for two validated eccDNA showing RNA-seq read coverage in the region that circularizes. For MIC 67570, eccDNA annotations inferred from junction reads are indicated by green rectangles. For MIC 88761 the IES that has a read pair with the signature 9bp duplication is marked with a black arrow. Blue arrows point to RNA-seq read coverage in IESs that give rise to validated eccDNA.
Figure 9.
Figure 9.
Inverse RT-PCR suggests transcription across eccDNA junctions. (A) Inverse RT-PCR using primer pairs that point away from each other were used to show transcription from eccDNA in asexual cells and throughout rearrangement. P1 and P2 represent asexually growing parental strains and ‘gDNA’ represents conventional inverse PCR using mid-rearrangement whole-cell DNA as template. Control reverse transcription reactions lacking reverse transcriptase are represented by RT-. (B) Clones obtained from inverse RT-PCR using primer pairs that point away from each other (shown as pink arrows) were sequenced for MIC 88761 and are shown as red bars. MDS annotations and pointers flanking IESs are shown as black and gray arrows respectively.
Figure 10.
Figure 10.
5′- RACE reveals TSS sites within eccDNA. (A) 5′-RACE products for three validated eccDNAs are resolved using agarose gel electrophoresis. Control A-tailing reactions lacking terminal transferase are represented by TdT-. Control reverse transcription reactions lacking reverse transcriptase are represented by RT-. The directionality of transcription was determined using two different sets of primers for each candidate and is represented by + or – strand. The locations of the three locus-specific primers used for each direction is represented by cyan arrows. The sequenced 5′-RACE products that revealed a TSS in the vicinity of the pointers are shown as red lines. Pointers are represented by gray arrows. (B) The electropherogram for polyA-containing sites are shown. Black arrows show the location of the TSSs and their direction as suggested by the sequence of the 5′-RACE product.

Similar articles

Cited by

References

    1. Chen X., Bracht J.R., Goldman A.D., Dolzhenko E., Clay D.M., Swart E.C., Perlman D.H., Doak T.G., Stuart A., Amemiya C.T. et al. .. The architecture of a scrambled genome reveals massive levels of genomic rearrangement during development. Cell. 2014; 158:1187–1198. - PMC - PubMed
    1. Swart E.C., Bracht J.R., Magrini V., Minx P., Chen X., Zhou Y., Khurana J.S., Goldman A.D., Nowacki M., Schotanus K. et al. .. The Oxytricha trifallax macronuclear genome: a complex eukaryotic genome with 16,000 tiny chromosomes. PLoS Biol. 2013; 11:e1001473. - PMC - PubMed
    1. Prescott D.M. The DNA of ciliated protozoa. Microbiol. Rev. 1994; 58:233–267. - PMC - PubMed
    1. Bracht J.R., Fang W., Goldman A.D., Dolzhenko E., Stein E.M., Landweber L.F.. Genomes on the edge: programmed genome instability in ciliates. Cell. 2013; 152:406–416. - PMC - PubMed
    1. Yerlici V.T., Landweber L.F.. Programmed genome rearrangements in the ciliate Oxytricha. Microbiol. Spectr. 2014; 2:doi:10.1128/microbiolspec.MDNA3-0025-2014. - PMC - PubMed

Publication types

MeSH terms