. 2019 Nov 4;47(19):10357-10372.
doi: 10.1093/nar/gkz747.

LYAR potentiates rRNA synthesis by recruiting BRD2/4 and the MYST-type acetyltransferase KAT7 to rDNA

Affiliations

LYAR potentiates rRNA synthesis by recruiting BRD2/4 and the MYST-type acetyltransferase KAT7 to rDNA

Keiichi Izumikawa et al. Nucleic Acids Res. .

Abstract

Activation of ribosomal RNA (rRNA) synthesis is pivotal during cell growth and proliferation, but its aberrant upregulation may promote tumorigenesis. Here, we demonstrate that the candidate oncoprotein, LYAR, enhances ribosomal DNA (rDNA) transcription. Our data reveal that LYAR binds the histone-associated protein BRD2 without involvement of acetyl-lysine-binding bromodomains and recruits BRD2 to the rDNA promoter and transcribed regions via association with upstream binding factor. We show that BRD2 is required for the recruitment of the MYST-type acetyltransferase KAT7 to rDNA loci, resulting in enhanced local acetylation of histone H4. In addition, LYAR binds a complex of BRD4 and KAT7, which is then recruited to rDNA independently of the BRD2-KAT7 complex to accelerate the local acetylation of both H4 and H3. BRD2 also helps recruit BRD4 to rDNA. By contrast, LYAR has no effect on rDNA methylation or the binding of RNA polymerase I subunits to rDNA. These data suggest that LYAR promotes the association of the BRD2-KAT7 and BRD4-KAT7 complexes with transcription-competent rDNA loci but not to transcriptionally silent rDNA loci, thereby increasing rRNA synthesis by altering the local acetylation status of histone H3 and H4.


Figures

Figure 1.
Figure 1.
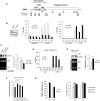
LYAR is involved in rDNA transcription. (A) Schematic diagram of a single human rDNA genic region (rDNA repeats are separated by an intergenic spacer). Primer sets (short bars: subregions H0, H8, H13, and H27) used for ChIP analysis are indicated along with their approximate positions relative to the transcription start site (0 kb). (B) ChIP analysis of UBF and LYAR binding to rDNA loci in HeLa cells transfected with scRNA (control) or siRNA specific for LYAR. Nonspecific mouse IgG or rabbit IgG was used as the antibody control. The chromatin-immunoprecipitated (ChIPed) DNA was quantified by qPCR using the primer sets indicated in A. The graph shows the amount of ChIPed DNA (% of input). Data represent the mean ± SEM of three independent experiments. The efficiency of LYAR knockdown was assessed with immunoblotting. (C) Metabolic labeling (4-thiouridine) of newly synthesized 47/45S pre-rRNA in HeLa cells upon LYAR knockdown. The RNA extracted for the cells treated with siRNA #1, siRNA #2 or ncRNA specific for LYAR (or ncRNA, control), was biotinylated and then subjected to agarose gel electrophoresis under denaturing condition and northern blotting. Signals for 47/45S pre-rRNA were detected by chemiluminescence. 28S and 18S rRNAs were used as loading controls (stained with methylene blue). The graph shows the relative band intensities of biotin-labeled 47/45S pre-rRNA normalized to that of 18S rRNA. Data reflect the mean ± SEM of three independent experiments. *P < 0.05 (paired t-test). LYAR mRNA levels, normalized to GAPDH mRNA, were assessed by reverse transcription-qPCR. (D) ChIP analysis of LYAR binding to rDNA loci (H0, H8, H13, H27) in HBF-LYAR-TO cells with or without HBF-LYAR induction via Dox. Nonspecific rabbit IgG was used as the antibody control. The graph shows the amount of ChIPed DNA (% of input). Data reflect the mean ± SEM of three independent experiments. (E) Metabolic labeling (4-thiouridine) of newly synthesized 47/45S pre-rRNA in HBF-LYAR-TO cells with or without Dox treatment. The pre-rRNA was biotinylated and then subjected to agarose gel electrophoresis under denaturing condition and northern blotting. Signals for 47/45S pre-rRNA were detected by chemiluminescence. 18S rRNAs were used as loading controls (stained with methylene blue). The graph shows the relative band intensities of 2 biotin-labeled 47/45S pre-rRNA normalized to that of 18S rRNA. Data reflect the mean ± SEM of six independent experiments. **P < 0.01 (paired t-test). (F) prHu3-Luc assay showing the effect of LYAR on RNAP I–dependent transcription. 293T cells were co-transfected with the prHu3-Luc reporter gene (firefly luciferase) and internal control vector pRL-TK (Renilla luciferase) along with the indicated amount of HBF and/or HBF-LYAR expression vectors, and luciferase activities were measured. The graph shows the ratio of the luciferase activities (firefly/Renilla) along with the corresponding HBF-LYAR expression levels or levels of HBF only. Data represent the mean ± SEM of three independent experiments. *P < 0.05, **P < 0.01 (paired t-test). (G) Methylation of rDNA in HBF-LYAR-TO cells was assessed with the HpaII resistance assay. HBF-LYAR-TO cells were treated with Dox for 24 h and then subjected to HpaII resistance assay. ChIP-CHOP experiment, in which the rDNA promoter-proximal DNA that had been subjected to ChIP with anti-LYAR or anti-UBF was subjected to HpaII digestion to determine whether LYAR associates with transcriptionally active, unmethylated rDNA repeats.
Figure 2.
Figure 2.
Pulldown of LYAR and identification of LYAR-associated proteins (A) Silver staining of HBF-LYAR-associated proteins. HBF-LYAR-associated complexes were isolated via sequential two-step pulldown (Ni-NTA pulldown, RNase A treatment, and pulldown of FLAG-tagged HBF-LYAR) from nuclear extract of HBF-LYAR-TO cells or T-REx 293 cells (control) treated with Dox for 24 h. Proteins were subjected to SDS-PAGE and visualized with silver staining. The arrowhead represents HBF-LYAR, as the bait protein. Molecular mass markers (kDa) are indicated to the left. Input: nuclear extract (10 μg). (B) Immunoblotting of HBF-LYAR-associated proteins using antibodies indicated to the right of each panel. 1% Input: 1% of the nuclear extract used for pull down of HBF-LYAR complexes. HBF-LYAR was detected by Stabilized Streptavidin-HRP Conjugate.
Figure 3.
Figure 3.
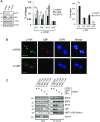
LYAR recruitment to rDNA loci depends on UBF (A) ChIP analysis of LYAR (left) or UBF binding (right) to rDNA loci in 293T cells upon knockdown of UBF or SPT5. 293T cells were treated with an siRNA specific for UBF or SPT5 (ncRNA as a control) for 72 h, and whole-cell extract was subjected to immunoblotting using the antibodies indicated to the right of the panels. β-actin was used as the loading control. Molecular mass markers (kDa) are indicated to the left. The graphs show the amount of ChIPed DNA (% of input) with respect to particular rDNA loci. Data represent the mean ± SEM of three independent experiments. *P < 0.05 (unpaired t-test). (B) Immunocytostaining of LYAR and UBF upon UBF knockdown. 293T cells were treated with ncRNA or an siRNA specific for UBF for 72 h and subjected to immunocytostaining with anti-LYAR (rabbit) and anti-UBF (mouse). FITC-conjugated anti-rabbit IgG and Cy3-conjugated anti-mouse IgG were used as the secondary antibodies. DAPI staining indicates the nucleus. Bar: 10 μm. (C) Immunoblotting for HBF-LYAR-associated proteins upon siRNA-mediated knockdown of treacle, UBF or SPT5 in HBF-LYAR-TO cells for 72 h. A two-step pulldown was carried out with His6- or FLAG-tag of HBF-LYAR. The antibodies used for immunoblotting are indicated to the right.
Figure 4.
Figure 4.
LYAR recruits BRD2 to rDNA transcription sites (A) ChIP analysis of BRD2 binding to rDNA loci in 293T cells upon LYAR knockdown (KD). 293T cells were treated with an siRNA specific for LYAR (or ncRNA, control) and then subjected to ChIP analysis with an antibody against LYAR or BRD2. LYAR KD was confirmed by immunoblotting with antibodies indicated to the right of the panels. β-actin was used as the loading control. Molecular mass markers (kDa) are indicated to the left of the panels. The graphs show the amount of ChIPed DNA (% of input) relative to the number of rDNA loci with the antibody indicated under each graph. Data represent the mean ± SEM of three independent experiments. *P < 0.05, **P < 0.01 (unpaired t-test). (B) ChIP analysis of BRD2 binding to rDNA loci in 293T cells upon UBF knockdown. The cells were treated with an siRNA specific for UBF (or ncRNA) and then subjected to ChIP analysis with an antibody against BRD2. The graph shows the amount of ChIPed DNA (% of input). (C) Re-ChIP analysis showing that LYAR-BRD2-associated complexes bind rDNA loci. The first ChIP of HBF-LYAR, with anti-FLAG, was performed using HBF-LYAR-TO cells with or without Dox treatment (1st ChIP; left graph). The second ChIP, with anti-BRD2, was performed using the first ChIPed HBF-LYAR-associated complexes (2nd ChIP; right graph). As an antibody control for anti-BRD2, a nonspecific rabbit IgG was used. The graphs show the amount of ChIPed DNA (% of input). Data represent the mean ± SEM of three independent experiments. *P < 0.05, **P < 0.01 (unpaired t-test). (D) Metabolic labeling (4-thiouridine) of newly synthesized 47/45S pre-rRNA in 293T cells upon BRD2 knockdown (siRNA). The pre-rRNA was biotinylated and then subjected to agarose gel electrophoresis under denaturing condition and northern blotting. The signals for 47/45S pre-rRNA were detected by chemiluminescence. 28S and 18S rRNAs were used as loading controls (stained with SYBR gold). The graph shows the relative band intensities of biotin-labeled 47/45S pre-rRNA normalized to that of 18S rRNA. Data represent the mean ± SEM of four independent experiments. *P < 0.05, **P < 0.01 (paired t-test). Knockdown of BRD2 was confirmed by immunoblotting with anti-BRD2. β-actin was used as the loading control.
Figure 5.
Figure 5.
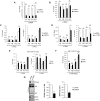
BRD2 recruits KAT7 to rDNA loci (A) ChIP analysis of the extent to which H3 or H4 is acetylated. 293T cells were treated with an siRNA specific for BRD2 or ncRNA (control) and then subjected to ChIP analysis with an antibody against H3ac or H4ac, as indicated. The graphs show the amount of ChIPed DNA (% of input) relative to the number of rDNA loci indicated under each graph. Data represent the mean ± SEM of three independent experiments. *P < 0.05, **P < 0.01 (unpaired t-test). B–D) ChIP analysis of the binding of KAT7 to rDNA loci. HBF-LYAR-TO cells were treated with (+Dox) or without (–Dox) Dox (B). 293T cells were treated with ncRNA (control) or an siRNA specific for LYAR (C) or BRD2 (D) for 72 h. These cells were subjected to ChIP analysis with an antibody against KAT7. The graphs show the amount of ChIPed DNA (% of input) relative to the number of rDNA loci indicated under each graph. Data represent the mean ± SEM of three independent experiments. *P < 0.05, **P < 0.01 (unpaired t-test). (E) Immunoblotting for HBF-LYAR-associated proteins upon the knockdown of BRD2. HBF-LYAR-TO cells were treated with an siRNA specific for BRD2 for 72 h; after induction with Dox, the nuclear extract was subjected to the pulldown with two-step pull down with His6- and FLAG-tag of HBF-LYAR. HBF-LYAR-associated proteins were detected by immunoblotting with antibodies indicated to the right of the panels. (F) ChIP analysis of the extent to which H3 or H4 is acetylated. 293T cells were treated with an siRNA specific for KAT7. These cells were subjected to ChIP analysis with an antibody against H3ac or H4ac, as indicated. 293T cells were treated with ncRNA (control) or an siRNA specific for KAT7. The graphs show the amount of ChIPed DNA (% of input) relative to the number of rDNA loci indicated under each graph. Data represent the mean ± SEM of three independent experiments. *P < 0.05, **P < 0.01 (unpaired t-test).
Figure 6.
Figure 6.
LYAR and BRD2 assist the recruitment of BRD4 to rDNA (A, B) ChIP analysis of the binding of BRD4 to rDNA upon the knockdown of LYAR (A) or BRD2 (B). 293T cells were treated with ncRNA or an siRNA specific for LYAR (A) or BRD2 (B) for 72 h. These cells were subjected to ChIP analysis with an antibody against BRD4. The graphs show the amount of ChIPed DNA (% of input) relative to the number of rDNA loci indicated under each graph. Data represent the mean ± SEM of three independent experiments. *P < 0.05, **P < 0.01 (unpaired t-test). (C, D) ChIP analysis of the extent to which H3 or H4 is acetylated in 293T cells. The cells were treated with ncRNA or an siRNA specific for BRD4 (C) or LYAR (D) for 72 h. These cells were subjected to ChIP analysis with an antibody against H3ac or H4ac, as indicated. (E, F) ChIP analysis of the extent to which H3 or H4 is acetylated in HBF-LYAR-TO cells. The cells were treated with (Dox+) or without Dox (Dox–) for 24 h. These cells were subjected to ChIP analysis with an antibody against H3ac or H4ac (E), or H3K122ac (F). (G) Metabolic labeling (4-thiouridine) of newly synthesized 47/45S pre-rRNA in 293T cells upon BRD4 knockdown (siRNA) for 72 h. The pre-rRNA was biotinylated and then subjected to agarose gel electrophoresis and northern blotting. The signals for 47/45S pre-rRNA were detected by chemiluminescence. 28S and 18S rRNAs were used as loading controls (stained with SYBR gold). The graph shows the relative band intensities of biotin-labeled 47/45S pre-rRNA normalized to that of 18S rRNA. Data represent the mean ± SEM of four independent experiments. *P < 0.05, **P < 0.01 (paired t-test). Knockdown of BRD4 was confirmed by immunoblotting with anti-BRD4. β-actin was used as the loading control.
Figure 7.
Figure 7.
BRD2, BRD4, and SPT5 bind LYAR independently (A, B) Reverse pulldown (PD) of UBF (A) or SPT5 (B) from HBF-LYAR complexes, assessed with immunoblotting. HBF-LYAR-TO cells were treated with Dox for 24 h, and then nuclear extracts (NE) were subjected to first pulldown (first PD) by two-step immunoprecipitation using His6- and FLAG-tag of HBF-LYAR. The purified HBF-LYAR complexes were immunoprecipitated with anti-UBF (αUBF) (A) or anti-SPT5 (αSPT5) (B) as the second affinity bait (second PD). T-REx 293 cells treated with Dox were used as the control. Proteins were detected by immunoblotting using the antibodies indicated to the right of the panels. Molecular mass markers (kDa) are indicated to the left of the panels. The nuclear extract (NE, 10 μg) was used as a loading control. (C) Immunoblotting for proteins that associated with BRD2 or BRD4. HBF-BRD2-TO cells and FLAG-BRD4-TO cells were treated with Dox for 24 h, and then the nuclear extracts were subjected to a two-step immunoprecipitation (IP) with anti-His6 and anti-FLAG. T-REx 293 cells treated with Dox were used as the control. Proteins that associated with HBF-BRD2 or FLAG-BRD4 were detected by immunoblotting using the antibodies indicated to the right of the panels. β-actin was used as the loading control. (D) Immunoblotting for HBF-LYAR-associated proteins upon the knockdown of BRD4. HBF-LYAR-TO cells were treated with an siRNA specific for BRD4 for 72 h. After induction with Dox, the nuclear extracts were subjected to two-step immunoprecipitation (IP) using His6- and FLAG-tag of HBF-LYAR.
Figure 8.
Figure 8.
Model for LYAR function in rDNA transcription For RNAP I–dependent transcription, LYAR binds rDNA via UBF, recruits BRD2-KAT7-JADE3 through direct binding between LYAR and BRD2 (without any auxiliary factor) to rDNA transcription sites, and accelerates acetylation of histone H4. Moreover, LYAR facilitates the binding of BRD4-KAT7-JADE3 to acetylated H4 at rDNA transcription sites. BRD4-KAT7-JADE3 further accelerates the acetylation of histones H3 and H4 at rDNA loci, which further enhances BRD4-KAT7-JADE3 binding to rDNA loci, resulting in the relaxation of chromatin structure to enhance RNAP I–dependent transcription. Because the binding of LYAR to KAT7-JADE3 is dependent on BRD2 but not BRD4, an unknown factor may be involved in the binding between LYAR and KAT7-JADE3 in the LYAR-BRD4-KAT7-JADE3 complex.

Similar articles

Cited by

References

    1. Ruggero D., Pandolfi P.P.. Does the ribosome translate cancer. Nat. Rev. Cancer. 2003; 3:179–192. - PubMed
    1. White R.J. RNA polymerases I and III, non-coding RNAs and cancer. Trends Genet. 2008; 24:622–629. - PubMed
    1. Russell J., Zomerdijk J.C.. RNA-polymerase-I-directed rDNA transcription, life and works. Trends Biochem. Sci. 2005; 30:87–96. - PMC - PubMed
    1. Boisvert F.M., van Koningsbruggen S., Navascues J., Lamond A.I.. The multifunctional nucleolus. Nat. Rev. Mol. Cell Biol. 2007; 8:574–585. - PubMed
    1. Henras A.K., Soudet J., Gerus M., Lebaron S., Caizergues-Ferrer M., Mougin A., Henry Y.. The post-transcriptional steps of eukaryotic ribosome biogenesis. Cell Mol. Life Sci. 2008; 65:2334–2359. - PMC - PubMed

Publication types

LinkOut - more resources