. 2019 Nov 4;47(19):10373-10387.
doi: 10.1093/nar/gkz761.

mTOR-regulated U2af1 tandem exon splicing specifies transcriptome features for translational control

Affiliations

mTOR-regulated U2af1 tandem exon splicing specifies transcriptome features for translational control

Jae-Woong Chang et al. Nucleic Acids Res. .

Abstract

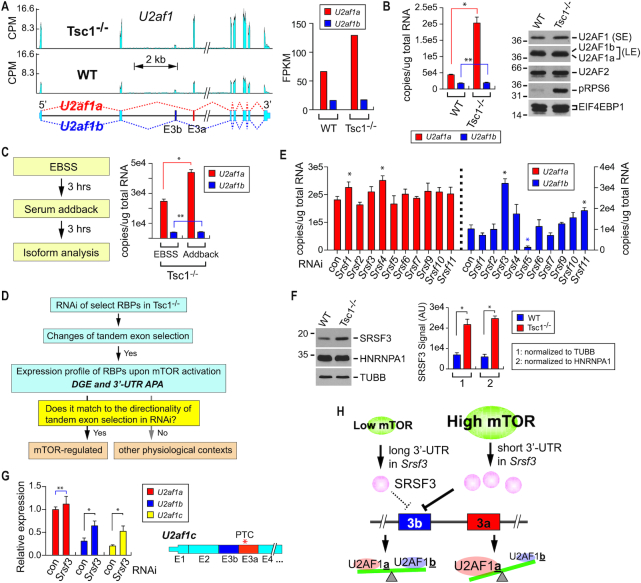
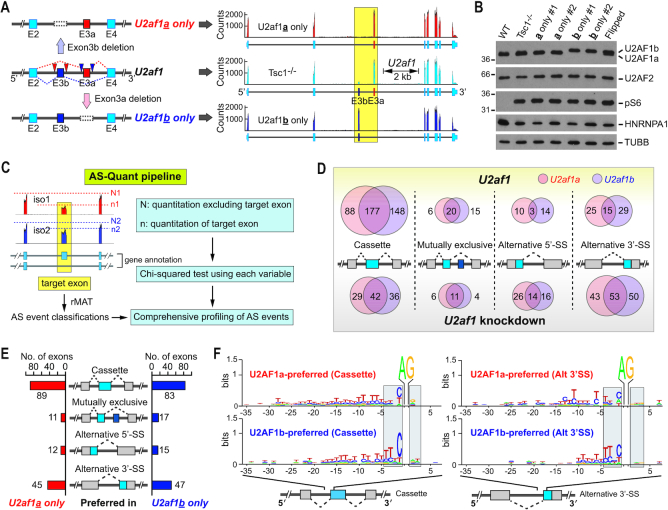
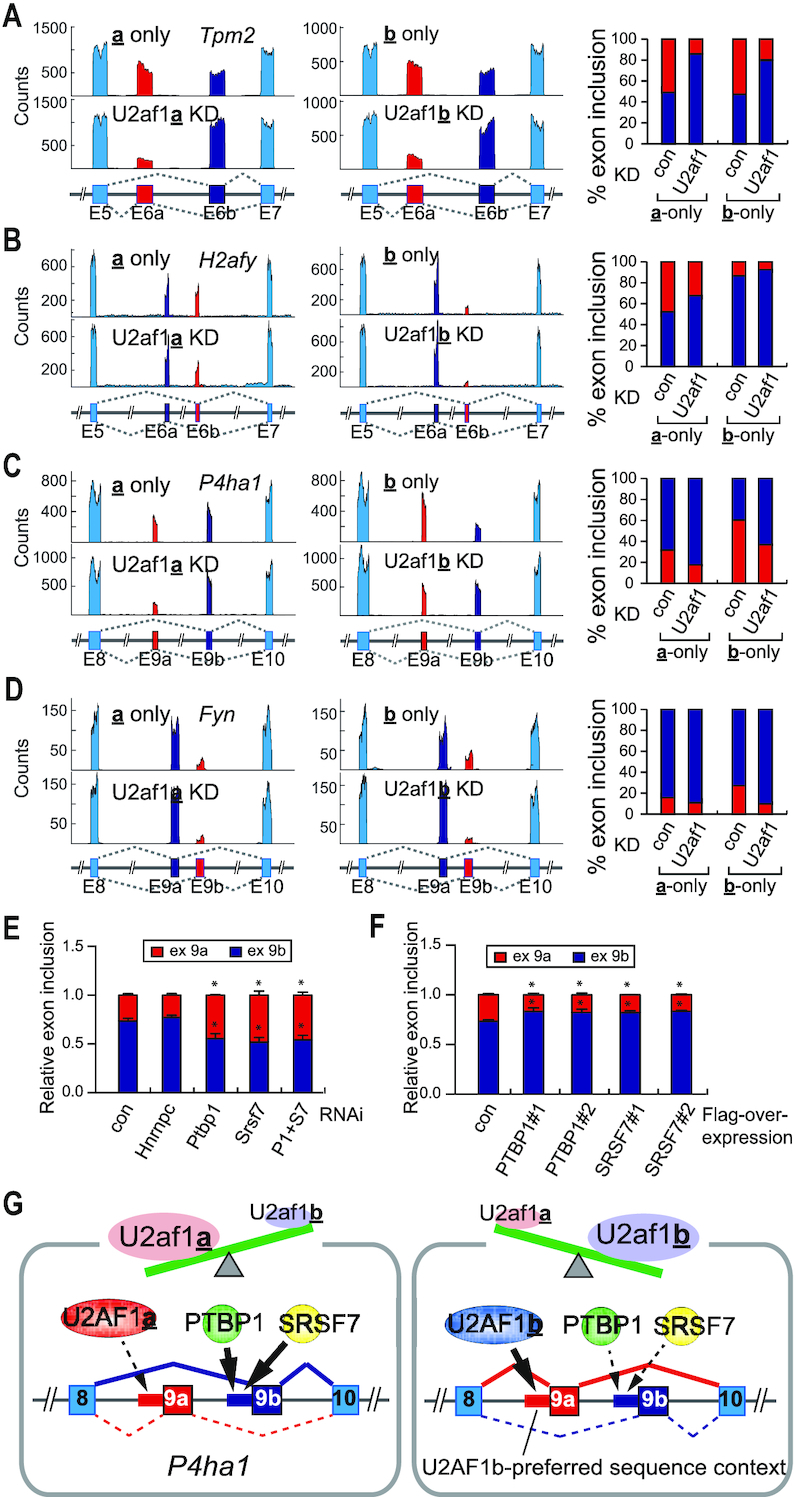
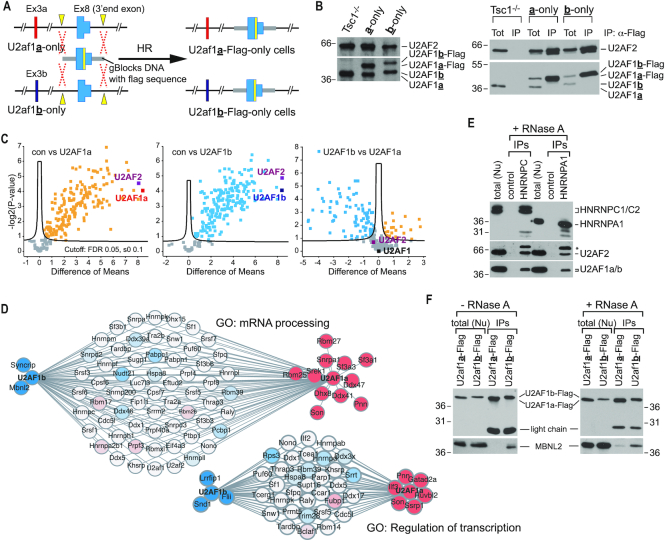
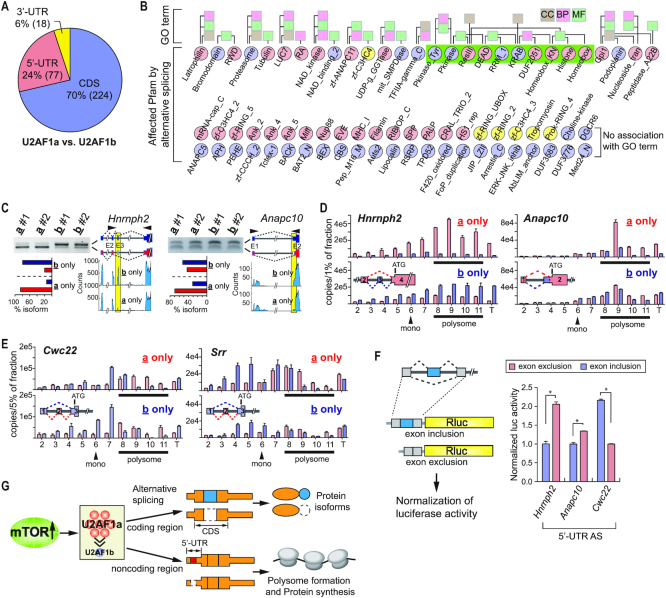
U2 auxiliary factor 1 (U2AF1) functions in 3'-splice site selection during pre-mRNA processing. Alternative usage of duplicated tandem exons in U2AF1 produces two isoforms, U2AF1a and U2AF1b, but their functional differences are unappreciated due to their homology. Through integrative approaches of genome editing, customized-transcriptome profiling and crosslinking-mediated interactome analyses, we discovered that the expression of U2AF1 isoforms is controlled by mTOR and they exhibit a distinctive molecular profile for the splice site and protein interactomes. Mechanistic dissection of mutually exclusive alternative splicing events revealed that U2AF1 isoforms' inherent differential preferences of nucleotide sequences and their stoichiometry determine the 3'-splice site. Importantly, U2AF1a-driven transcriptomes feature alternative splicing events in the 5'-untranslated region (5'-UTR) that are favorable for translation. These findings unveil distinct roles of duplicated tandem exon-derived U2AF1 isoforms in the regulation of the transcriptome and suggest U2AF1a-driven 5'-UTR alternative splicing as a molecular mechanism of mTOR-regulated translational control.


Figures

Figure 1.
Figure 1.
Cellular mTOR activity affects the expression profile of U2af1 isoform. (A) U2af1a is selectively up-regulated upon mTOR activation. (left) RNA-Seq reads alignments of U2af1 isoforms in WT and Tsc1−/− transcriptomes. (right) Quantitation of U2af1 isoforms in the RNA-Seq data from WT and Tsc1−/− MEFs. (B) Expression of U2af1 isoforms in WT and Tsc1−/− MEFs was measured by Taqman qPCR with absolute quantitation. The data are presented as the mean (SD) (*P = 1.3e-6, **P = 0.60; two-tailed Student's t test, n = 3 for technical repeats). Western blot analyses of U2AF1 isoforms were done using total cellular extracts from WT and Tsc1−/− MEFs. Please note that U2AF1b isoform is only visible in the longer exposure blot. Phospho-S6 (pRPS6) probing is for the validation of mTOR activation. SE and LE indicate short exposure and long exposure in western blot, respectively. (C) U2af1a is selectively up-regulated upon the activation of cellular mTOR signaling. (left) A workflow of the serum add-back experiment for the manipulation of cellular mTOR activity. (right) Absolute quantitation of U2af1 isoforms by Taqman qPCR. The data are presented as the mean (SD) (*P = 1.6e–4, **P = 0.43; two-tailed Student's t test, n = 3 for technical repeats). (D) A workflow of the screening strategy for mTOR-regulated splicing factors that regulate the U2af1 isoform expression. DGE, differential gene expression at the transcript level. (E) An RNAi screen to identify a regulator(s) of U2af1 alternative splicing. SR splicing factors were knocked down by siRNAs in Tsc1−/− MEFs and the expression of U2af1 isoforms was measured by Taqman qPCR assay with absolute quantitation. Asterisks denote statistically significant changes of U2af1 isoform expression upon the RNAi knockdown. The data are presented as the mean (SD) (*P < 0.0086; two-tailed Student's t test, n = 3 for technical repeats). (F) Western blot analysis of SRSF3 in WT and Tsc1−/− MEFs. TUBULIN and HNRNPA1 were used as loading controls. Quantitation by ImageQuant software of the SRSF3 signals normalized to TUBULIN or HNRNPA1 is shown on the right. (*P < 7.5e-4; two-tailed Student's t test, n = 3 for biological repeats; see Supplementary Figure S1N for the other two repeats). (G) Relative expression of U2af1a, U2af1b and U2af1c transcripts (structure shown on right; PTC, premature termination codon) upon RNAi knockdown of Srsf3. Puromycin was added for 8 h at the concentration of 5 μg/ml. The data are presented as the mean (SD) (*P <0.010, **P = 0.31; two-tailed Student's t test, n = 3 for technical repeats). (H) A proposed model for regulation of U2af1 tandem exon splicing by mTOR and SRSF3.
Figure 2.
Figure 2.
U2AF1 isoforms display distinctive alternative splicing profiles. (A) (left) Schematic for the generation of U2AF1 isoform-specific cell lines in Tsc1−/− MEFs. Location of guide RNA (gRNA) pairs to produce U2af1a-only and U2af1b-only cells are indicated by red and blue triangles, respectively. (right) RNA-Seq read alignments of U2af1 gene locus in U2af1a-only, U2af1b-only and control Tsc1−/− MEFs. The yellow box highlights tandem exon regions in U2af1. (B) Western blot analyses of U2af1a-only, U2af1b-only, control Tsc1−/−, and WT MEFs. Exon 3a targeting experiment created several heterozygous clones, which were named as ‘flipped’ since the U2AF1a/U2AF1b ratio is flipped compared to control Tsc1−/− MEFs. A flipped clone is also loaded to aid visualizing the migration shift of U2AF1 isoforms. Two a-only and b-only cell lines were analyzed. (C) Schematic of custom-developed AS-Quant (Alternative Splicing Quantitation) pipeline for a quantitative analysis of alternative splicing. (D) Types of alternative splicing events dependent on the cellular level of U2AF1a or U2AF1b isoform. U2af1 knockdown-dependent alternative splicing events are categorized and the numbers of events identified in U2af1a-only cell line (orange circles), U2af1b-only cell line (purple circles), and in both cell lines (overlapped regions) are presented. (upper) Number of alternative exons that are more included in the presence of U2af1. (lower) Number of alternative exons that are more included in the absence of U2af1 (upon knockdown). (E) Types of alternative splicing events preferred by U2AF1a or U2AF1b. Alternative splicing events identified by a direct comparison between U2af1a- and U2af1b-only cell lines are presented. Alternative splicing events are categorized and the number of exons that are preferentially included in U2af1a-only (left) and U2af1b-only cell line (right) are shown. (F) The frequency of upstream nucleotides of the 3′-splice site of cassette type (left) or alternative 3′-splice site type (right) preferred by U2AF1 isoforms. The certainty (bit = log(frequency/2.4), ranging from 0 to 1.5) of nucleotides in each position of the upstream intron and the downstream exon regions from the AG dinucleotide of the 3′-splice site is illustrated. X-axis denotes the position of upstream and downstream nucleotides from the AG dinucleotide and Y-axis represents the certainty of the nucleotides.
Figure 3.
Figure 3.
Stoichiometry of U2AF1 isoforms determines alternative 3′-splice site. (A–D) RNA-Seq read alignments of Tpm2 (A), H2afy (B), P4ha1 (C) and Fyn (D) gene loci in U2af1a-only, U2af1b-only and U2af1 knockdown in corresponding cells. Please note that the designation of mutually exclusive exon a and b of these genes is in the order of exons from 5′ to 3′-end direction for convenience. Inclusion of exon a or b is shown based on the quantitation of RNA-Seq data with the matching color code. (E) An RNAi screening to identify a factor(s) for P4ha1 exon 9b alternative splicing. Relative inclusion of exon 9a or exon 9b in P4ha1 expression was presented after the knockdown of indicated RNA-binding proteins (RBPs) in Tsc1−/− MEFs. The asterisks indicate the statistically significant decrease in the inclusion of exon 9b compared to the control. The data are presented as the mean (SD) (*P <0.0062, two-tailed Student's t test, n = 3 for technical repeats). (F) The effect of PTBP1 and SRSF7 overexpression on the inclusion of P4ha1 exon 9b. PTBP1 or SRSF7 was overexpressed in Tsc1−/− MEFs and the relative inclusion of exon 9b was measured. Two independent repeats of the experiments are shown. The asterisks indicate the statistically significant increase in the inclusion of exon 9b compared to control. The data are presented as the mean (SD) (*P <0.01, two-tailed Student's t test, n = 3 for technical repeats). (G) A proposed model for the mutually exclusive alternative splicing of P4ha1 upon the changes of U2AF1 isoform stoichiometry. The stoichiometry of U2AF1 isoforms in cells determines the usage of one of the tandem exons’ splice site based on the nucleotide composition and the other splice site is selected by other splicing factors. In this case, PTBP1 and SRSF7 are one of the splicing factors involved in the mutually exclusive alternative splicing of P4ha1.
Figure 4.
Figure 4.
Overlapping but distinct interactome profiles of U2AF1 isoforms represents refined functional differences. (A) Schematic for CRISPR-induced homologous recombination (HR) to generate C-terminal Flag-tagged U2AF1 isoform-specific cell lines. Yellow rectangular box represents the Flag-tag. (B) Western blot analyses confirming the addition of a Flag-tag to U2AF1 (left). Anti-Flag immunoprecipitation (IP) and western blot analyses using total cellular extracts from Flag-tagged U2AF1 isoform-specific cell lines. Only Flag-tagged U2AF1 along with U2AF2 was immunoprecipitated (right). Tot: Total cell lysate, 1% of input was loaded. (C) Volcano plots illustrating enrichment of both U2AF1 isoforms and corresponding interactors. The plot compares the log2 mean protein LFQ intensity difference between the control, U2AF1a and U2AF1b baits against the logarthmic P-values. (D) Interactome analyses of U2AF1a and U2AF1b. Interactomes of U2AF1a and U2AF1b in GO term mRNA processing (GO:0006397) and regulation of transcription (GO:0006355) are illustrated. Proteins colored in solid blue and red represent unique interactors of U2AF1b and U2AF1a, respectively. (E, F) Co-IP and western blotting validation of U2AF1 isoform interactome analysis. (E) Anti-HNRNPC1/C2 or HNRNPA1 antibodies were used for co-IPs in the presence of RNase A. Nuclear fraction of HEK293 cells was used for co-IPs. 2.5% of input was loaded as total. The asterisk denotes a non-specific band which may come from undissociated antibody chains. (F) MBNL2 and U2AF1a-Flag or U2AF1b-Flag were co-expressed in HEK293 cells. Flag-IP was performed with nuclear fractions in the absence or presence of RNase A. 10% of input was loaded as total. Anti-Flag and Anti-MBNL2 antibodies were used for immunoblotting.
Figure 5.
Figure 5.
U2AF1 isoform-regulated alternative splicing in 5′-UTR modulates translation. (A) Distribution of alternative splicing in the regions of mRNA. Alternative splicing events displaying differences between U2af1a- and U2af1b-only cells were shown. (B) Affected Pfam domains by U2AF1 isoform-coordinated alternative splicing events were analyzed and their linkage to GO term is presented. Pfam domains affected by U2AF1a and U2AF1b-mediated alternative splicing are highlighted in light red and light blue, respectively. The Pfam domains highlighted in yellow are affected by both U2AF1a and U2AF1b-mediated alternative splicing. CC: Cellular Components; BP: Biological Processes; MF: Molecular Functions (C) Examples of 5′-UTR alternative splicing events in U2af1a- and b-only cells. RT-PCR and agarose gel electrophoresis were conducted to validate alternative splicing events. RNA-Seq read alignments and quantitation of alternative splicing events are shown. Arrows indicate the position of primer binding sites for RT-PCR analyses. Splicing isoforms and their quantitation are color-coded as illustrated; yellow boxes highlight the alternative exons. Asterisk denotes a non-specific PCR product. (D) Polysome profiling analyses on the cytosolic fraction of U2af1a-only and U2af1b-only cells. Distribution of 5′-UTR alternative splicing transcripts (left, Hnrnph2; right, Anapc10) in polysome fractionation were analyzed by absolute quantitation using qPCR. T: 10% of input. Splicing isoforms are color-coded as illustrated. Monosome and polysome fractions are indicated. (E) The same analyses described in (D) were conducted on Cwc22 and Srr genes. (F) Luciferase assays showing the effects of 5′-UTR alternative splicing events on translation efficiency. The 5′-UTRs including or excluding the alternative exons of Hnrnph2, Anapc10, and Cwc22 were placed into the 5′-UTR of luciferase reporter. The fold-changes of luciferase signals between the exon-included and exon-excluded 5′-UTR reporter construct pairs of the three genes are shown in bar graphs. The data are presented as the mean (SD) (*P < 8.6e-5, two-tailed Student's t test, n = 4 for technical repeats). (G) A proposed model for U2AF1 isoform-coordinated translational regulation by 5′-UTR alternative splicing and the connection to mTOR signaling. In this model, mTOR-regulated changes of U2AF1 expression profile contributes to the proteome regulation by multiple ways. Alternative splicing in coding regions produce protein isoforms while alternative splicing in the 5′-UTR regulates differential translation.

Similar articles

Cited by

References

    1. Shi Y. Mechanistic insights into precursor messenger RNA splicing by the spliceosome. Nat. Rev. Mol. Cell Biol. 2017; 18:655–670. - PubMed
    1. Zamore P.D., Patton J.G., Green M.R.. Cloning and domain structure of the mammalian splicing factor U2AF. Nature. 1992; 355:609–614. - PubMed
    1. Zhang M., Zamore P.D., Carmo-Fonseca M., Lamond A.I., Green M.R.. Cloning and intracellular localization of the U2 small nuclear ribonucleoprotein auxiliary factor small subunit. Proc. Natl. Acad. Sci. U.S.A. 1992; 89:8769–8773. - PMC - PubMed
    1. Singh R., Valcárcel J., Green M.R.. Distinct binding specificities and functions of higher eukaryotic polypyrimidine tract-binding proteins. Science. 1995; 268:1173–1176. - PubMed
    1. Valcárcel J., Gaur R.K., Singh R., Green M.R.. Interaction of U2AF65 RS region with pre-mRNA branch point and promotion of base pairing with U2 snRNA [corrected]. Science. 1996; 273:1706–1709. - PubMed

Publication types