

BioSeq-Analysis2.0: an updated platform for analyzing DNA, RNA and protein sequences at sequence level and residue level based on machine learning approaches
- PMID: 31504851
- PMCID: PMC6847461
- DOI: 10.1093/nar/gkz740
BioSeq-Analysis2.0: an updated platform for analyzing DNA, RNA and protein sequences at sequence level and residue level based on machine learning approaches
Abstract
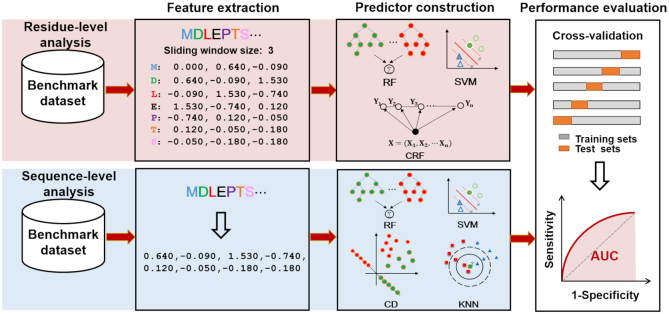
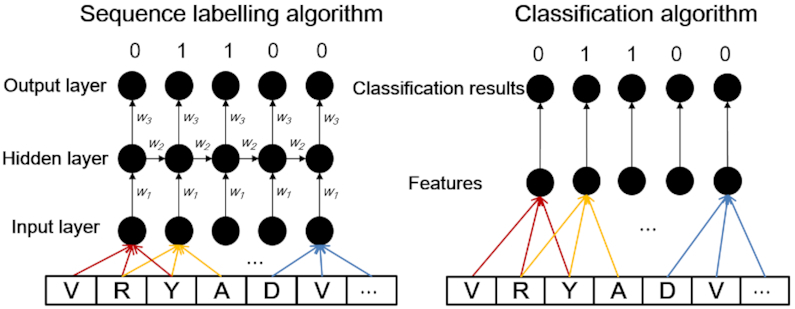
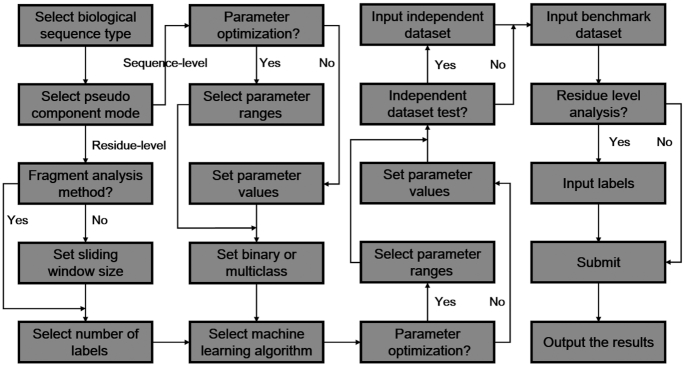
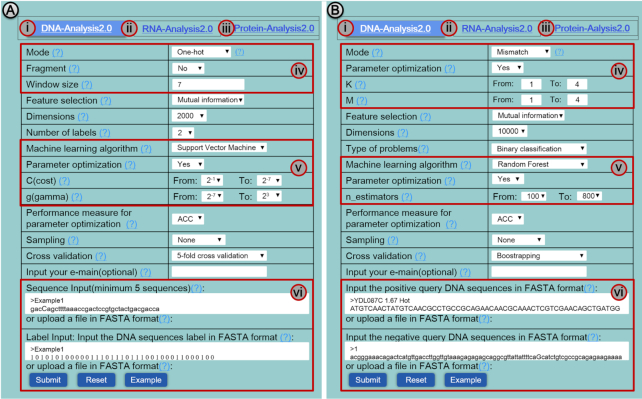
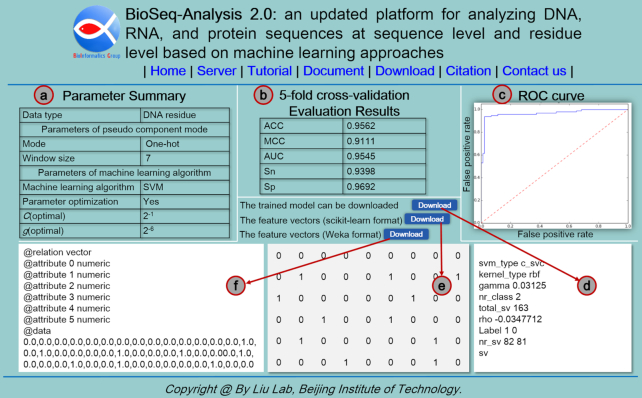
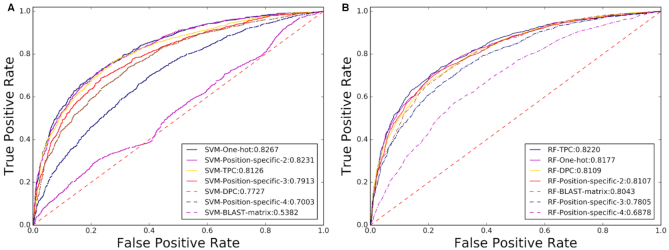
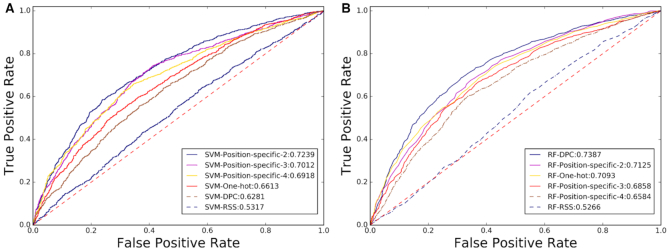
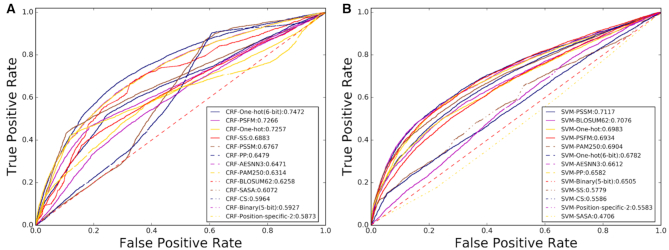
As the first web server to analyze various biological sequences at sequence level based on machine learning approaches, many powerful predictors in the field of computational biology have been developed with the assistance of the BioSeq-Analysis. However, the BioSeq-Analysis can be only applied to the sequence-level analysis tasks, preventing its applications to the residue-level analysis tasks, and an intelligent tool that is able to automatically generate various predictors for biological sequence analysis at both residue level and sequence level is highly desired. In this regard, we decided to publish an important updated server covering a total of 26 features at the residue level and 90 features at the sequence level called BioSeq-Analysis2.0 (http://bliulab.net/BioSeq-Analysis2.0/), by which the users only need to upload the benchmark dataset, and the BioSeq-Analysis2.0 can generate the predictors for both residue-level analysis and sequence-level analysis tasks. Furthermore, the corresponding stand-alone tool was also provided, which can be downloaded from http://bliulab.net/BioSeq-Analysis2.0/download/. To the best of our knowledge, the BioSeq-Analysis2.0 is the first tool for generating predictors for biological sequence analysis tasks at residue level. Specifically, the experimental results indicated that the predictors developed by BioSeq-Analysis2.0 can achieve comparable or even better performance than the existing state-of-the-art predictors.
© The Author(s) 2019. Published by Oxford University Press on behalf of Nucleic Acids Research.
Figures
Similar articles
-
BioSeq-Analysis: a platform for DNA, RNA and protein sequence analysis based on machine learning approaches.Brief Bioinform. 2019 Jul 19;20(4):1280-1294. doi: 10.1093/bib/bbx165. Brief Bioinform. 2019. PMID: 29272359
-
BioSeq-BLM: a platform for analyzing DNA, RNA and protein sequences based on biological language models.Nucleic Acids Res. 2021 Dec 16;49(22):e129. doi: 10.1093/nar/gkab829. Nucleic Acids Res. 2021. PMID: 34581805 Free PMC article.
-
Pse-in-One: a web server for generating various modes of pseudo components of DNA, RNA, and protein sequences.Nucleic Acids Res. 2015 Jul 1;43(W1):W65-71. doi: 10.1093/nar/gkv458. Epub 2015 May 9. Nucleic Acids Res. 2015. PMID: 25958395 Free PMC article.
-
Pseudo nucleotide composition or PseKNC: an effective formulation for analyzing genomic sequences.Mol Biosyst. 2015 Oct;11(10):2620-34. doi: 10.1039/c5mb00155b. Mol Biosyst. 2015. PMID: 26099739 Review.
-
Prediction of bio-sequence modifications and the associations with diseases.Brief Funct Genomics. 2021 Mar 2;20(1):1-18. doi: 10.1093/bfgp/elaa023. Brief Funct Genomics. 2021. PMID: 33313647 Review.
Cited by
-
PreMLS: The undersampling technique based on ClusterCentroids to predict multiple lysine sites.PLoS Comput Biol. 2024 Oct 22;20(10):e1012544. doi: 10.1371/journal.pcbi.1012544. eCollection 2024 Oct. PLoS Comput Biol. 2024. PMID: 39436947 Free PMC article.
-
Distribution rules of 8-mer spectra and characterization of evolution state in animal genome sequences.BMC Genomics. 2024 Sep 12;25(1):855. doi: 10.1186/s12864-024-10786-1. BMC Genomics. 2024. PMID: 39266973 Free PMC article.
-
Advances in the Identification of Circular RNAs and Research Into circRNAs in Human Diseases.Front Genet. 2021 Mar 19;12:665233. doi: 10.3389/fgene.2021.665233. eCollection 2021. Front Genet. 2021. PMID: 33815488 Free PMC article. Review.
-
ProSol-multi: Protein solubility prediction via amino acids multi-level correlation and discriminative distribution.Heliyon. 2024 Aug 22;10(17):e36041. doi: 10.1016/j.heliyon.2024.e36041. eCollection 2024 Sep 15. Heliyon. 2024. PMID: 39281576 Free PMC article.
-
Detecting Interactive Gene Groups for Single-Cell RNA-Seq Data Based on Co-Expression Network Analysis and Subgraph Learning.Cells. 2020 Aug 21;9(9):1938. doi: 10.3390/cells9091938. Cells. 2020. PMID: 32825786 Free PMC article.
References
-
- Liu B. BioSeq-Analysis: a platform for DNA, RNA and protein sequence analysis based on machine learning approaches. Brief. Bioinform. 2017; doi:10.1093/bib/bbx165. - PubMed
-
- Chen Z., Zhao P., Li F., Marquez-Lago T.T., Leier A., Revote J., Zhu Y., Powell D.R., Akutsu T., Webb G.I. et al. .. iLearn: an integrated platform and meta-learner for feature engineering, machine-learning analysis and modeling of DNA, RNA and protein sequence data. Brief. Bioinform. 2019; doi:10.1093/bib/bbz041. - PubMed
-
- Wei L., Hu J., Li F., Song J., Su R., Zou Q.. Comparative analysis and prediction of quorum-sensing peptides using feature representation learning and machine learning algorithms. Brief. Bioinform. 2018; doi:10.1093/bib/bby107. - PubMed
-
- Bock J.R., Gough D.A.. Predicting protein–protein interactions from primary structure. Bioinformatics. 2001; 17:455–460. - PubMed
Publication types
MeSH terms
LinkOut - more resources
Full Text Sources
Research Materials
