. 2019 Dec 1;172(2):316-329.
doi: 10.1093/toxsci/kfz189.

Evaluating Sufficient Similarity of Botanical Dietary Supplements: Combining Chemical and In Vitro Biological Data

Affiliations

Evaluating Sufficient Similarity of Botanical Dietary Supplements: Combining Chemical and In Vitro Biological Data

Kristen R Ryan et al. Toxicol Sci. .

Abstract

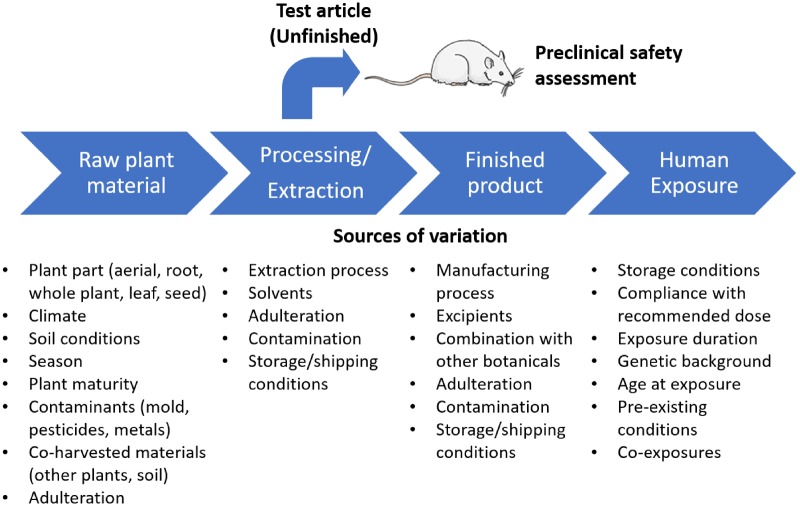
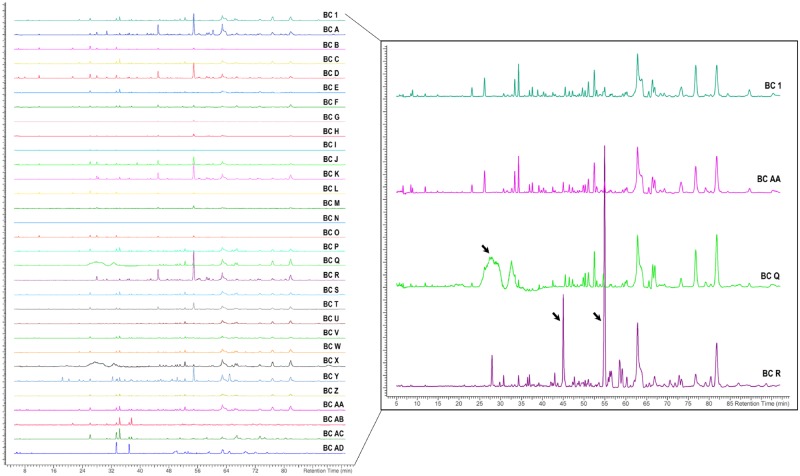
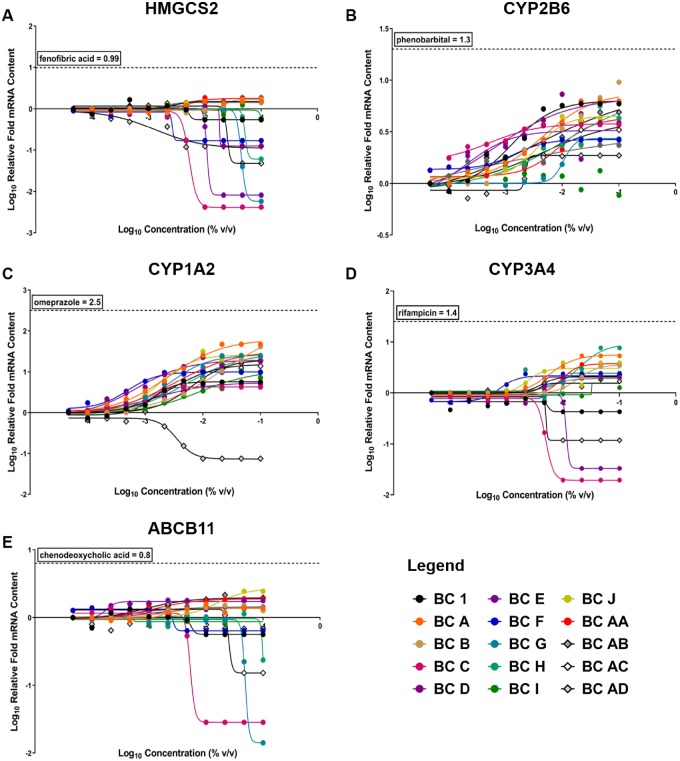
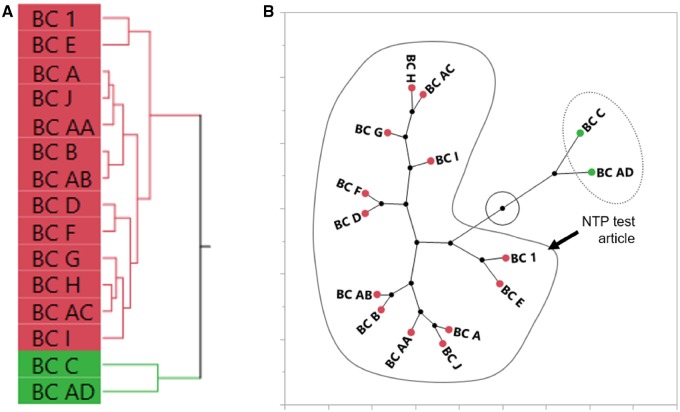
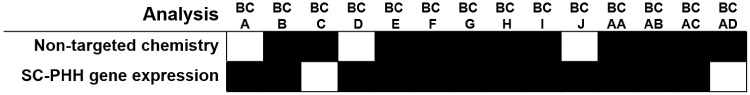
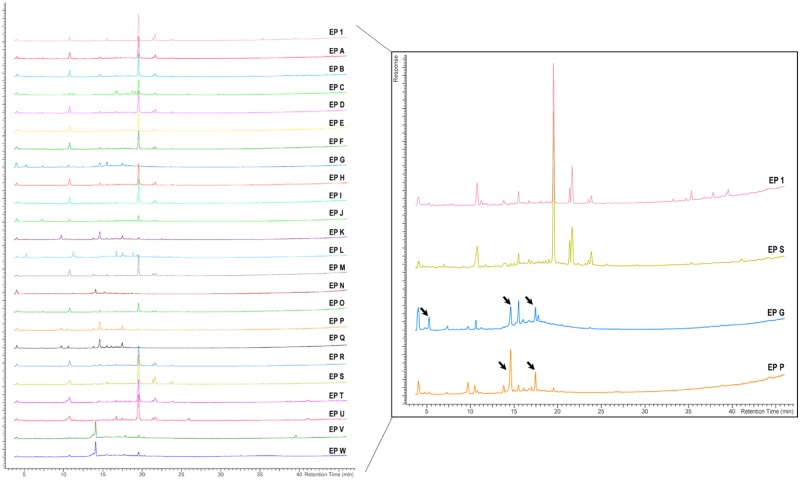
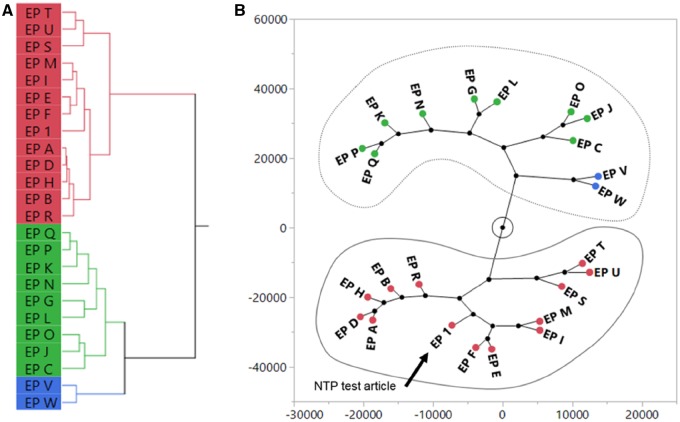
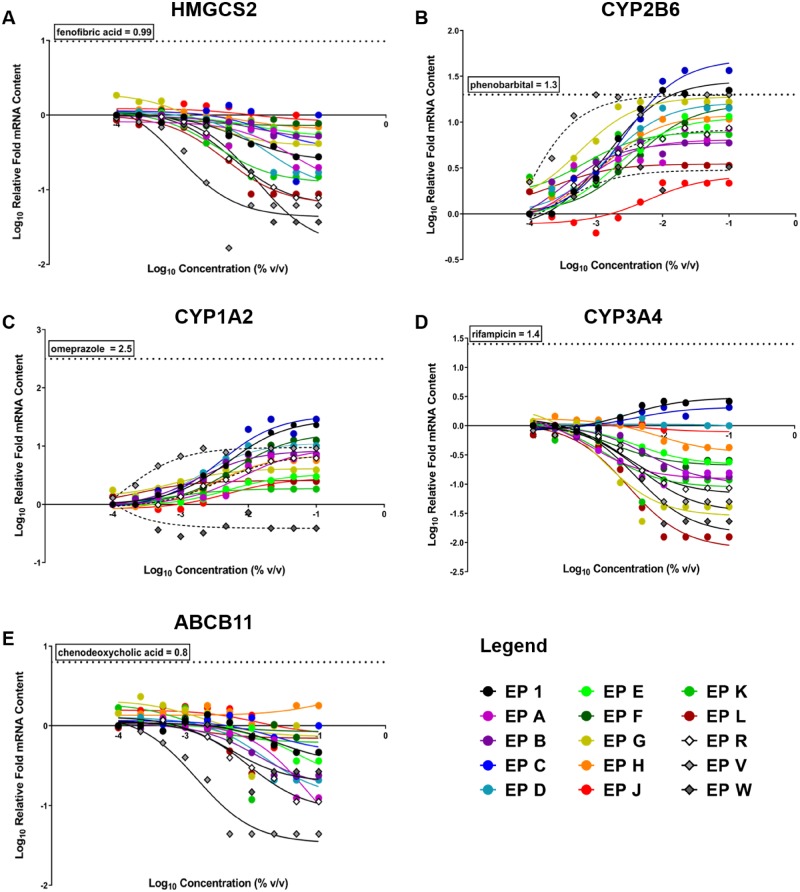
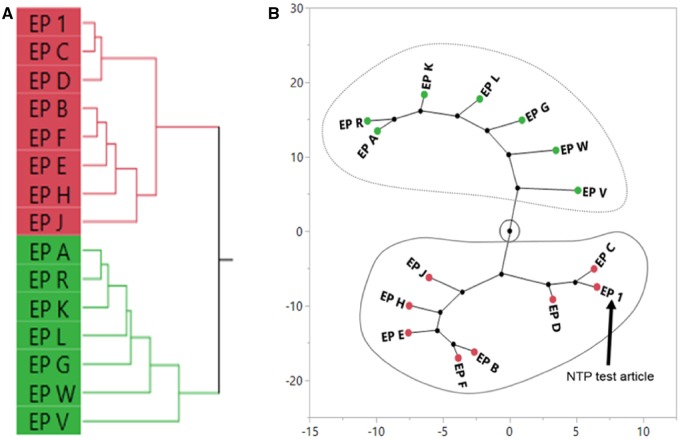
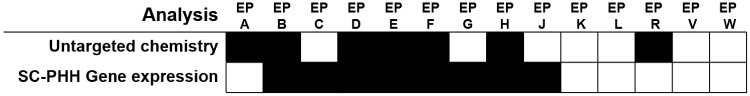
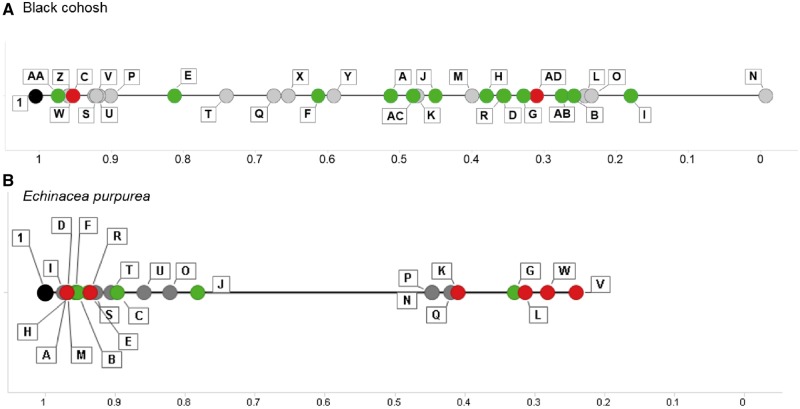
Botanical dietary supplements are complex mixtures with numerous potential sources of variation along the supply chain from raw plant material to the market. Approaches for determining sufficient similarity (ie, complex mixture read-across) may be required to extrapolate efficacy or safety data from a tested sample to other products containing the botanical ingredient(s) of interest. In this work, screening-level approaches for generating both chemical and biological-response profiles were used to evaluate the similarity of black cohosh (Actaea racemosa) and Echinacea purpurea samples to well-characterized National Toxicology Program (NTP) test articles. Data from nontargeted chemical analyses and gene expression of toxicologically important hepatic receptor pathways (aryl hydrocarbon receptor [AhR], constitutive androstane receptor [CAR], pregnane X receptor [PXR], farnesoid X receptor [FXR], and peroxisome proliferator-activated receptor alpha [PPARα]) in primary human hepatocyte cultures were used to determine similarity through hierarchical clustering. Although there were differences in chemical profiles across black cohosh samples, these differences were not reflected in the biological-response profiles. These findings highlight the complexity of biological-response dynamics that may not be reflected in chemical composition profiles. Thus, biological-response data could be used as the primary basis for determining similarity among black cohosh samples. Samples of E. purpurea displayed better correlation in similarity across chemical and biological-response measures. The general approaches described herein can be applied to complex mixtures with unidentified active constituents to determine when data from a tested mixture (eg, NTP test article) can be used for hazard identification of sufficiently similar mixtures, with the knowledge of toxicological targets informing assay selection when possible.

Keywords: Echinacea purpurea; black cohosh; complex mixtures; herbal supplements; sufficient similarity.


Figures

Figure 1.
Figure 1.
Potential sources of variation in botanical dietary supplements. In addition, this figure highlights that most preclinical safety evaluations (ie, in rodents) of botanicals are conducted with unfinished materials rather than formulated products.
Figure 2.
Figure 2.
Nontargeted chemical analyses of black cohosh (BC) samples. Chromatograms (left) are showing aligned peak intensity versus time data for all BC samples. For illustrative purposes, 4 sample chromatograms are enlarged (right) to demonstrate the similarities or differences (black arrows) in chemical profiles of samples BC AA, BC Q, and BC R compared with the NTP designated test article, BC 1.
Figure 3.
Figure 3.
Sufficient similarity evaluation of BC samples using nontargeted chemical analyses. Aligned data from chromatograms were used for hierarchical clustering of BC samples using Ward’s method. A dendrogram (A) and constellation plot (B) were generated from the clustering analysis. BC samples in the same cluster of the constellation plot as the NTP test article (BC 1) were determined to be chemically “similar” (circled in solid line). BC samples circled by the dotted line were classified as “different” from BC 1.
Figure 4.
Figure 4.
Concentration-response curves of gene expression for 15 BC samples in sandwich cultures of primary human hepatocytes (SC-PHHs). Nuclear receptor activation of (A) peroxisome proliferator-activated receptor alpha (PPARa) (HMGCS2), (B) constitutive androstane receptor (CAR) (CYP2B6), (C) aryl hydrocarbon receptor (AhR) (CYP1A2), (D) pregnane X receptor (PXR) (CYP3A4), and (E) farnesoid X receptor (FXR) (ABCB11) were evaluated at increasing concetrations of each sample. Human clinical activator/ positive control maximum responses for each receptor are shown by the horizontal dotted line on each graph. A legend is provided for all 15 samples tested, BC 1 (black dot) is the NTP test article.
Figure 5.
Figure 5.
Sufficient similarity evaluation of BC samples using the area under the curve of gene expression concentration-response curves in exposed sandwich-culture primary human hepatocytes. Hierarchical clustering of the area under the curve of gene expression concentration-response curves was done using the Ward’s method (A). A constellation plot (B) was generated from the clustering analysis and BC samples in the same cluster as the NTP test article (BC 1) were determined to be “similar” (circled in solid line). BC samples circled by the dotted line were classified as “different” from BC 1.
Figure 6.
Figure 6.
Summary of total sufficient similarity findings for black cohosh (BC) samples. Conclusions of sufficient similarity for the different data streams are shown. A black box indicates the result for each data stream is “similar” to the NTP test article (BC 1) and a white box indicates “different.” Only samples used in all analyses are presented. SC-PHH = sandwich culture of primary human hepatocytes.
Figure 7.
Figure 7.
Nontargeted chemical analyses of Echinacea purpurea (EP) samples. Chromatograms (left) are showing aligned peak intensity versus time data for all EP samples. For illustrative purposes, 4 sample chromatograms are enlarged (right) to demonstrate the similarities or differences (black arrows) in chemical profiles of samples EP S, EP G, and EP P compared with the NTP designated test article, EP 1.
Figure 8.
Figure 8.
Sufficient similarity evaluation of Echinacea purpurea (EP) samples using nontargeted chemical analyses. Aligned data from chromatograms were used for hierarchical clustering of EP samples using Ward’s method. A dendrogram (A) and constellation plot (B) were generated from the clustering analysis and EP samples in the same cluster of the constellation plot as the NTP test article (EP 1) were determined to be “similar” (circled in solid line). EP samples circled by the dotted line were classified as “different” from EP 1.
Figure 9.
Figure 9.
Concentration-response curves of gene expression for 15 Echinacea purpurea samples in SC-PHHs. Nuclear receptor activation of (A) peroxisome proliferator-activated receptor alpha (PPARa) (HMGCS2), (B) constitutive androstane receptor (CAR) (CYP2B6), (C) aryl hydrocarbon receptor (AhR) (CYP1A2), (D) pregnane X receptor (PXR) (CYP3A4), and (E) farnesoid X receptor (FXR) (ABCB11) were evaluated at increasing concetrations of each sample. Human clinical activator/positive control maximum responses for each receptor are shown by the horizontal dotted line on each graph. A legend is provided for all 15 samples tested, EP 1 (black dot) is the NTP test article.
Figure 10.
Figure 10.
Sufficient similarity evaluation of Echinacea purpurea (EP) samples using the area under the curve of gene expression concentration-response curves in exposed sandwich-culture primary human hepatocytes. Hierarchical clustering of the area under the curve of gene expression concentration-response curves was done using the Ward’s method (A). A constellation plot (B) was generated from the clustering analysis and EP samples in the same cluster as the NTP test article (EP 1) were determined to be “similar” (circled in solid line). EP samples circled by the dotted line were classified as “different” from EP 1.
Figure 11.
Figure 11.
Summary of total sufficient similarity findings for Echinacea purpurea (EP) samples. Conclusions of sufficient similarity for the different data streams are shown. A black box indicates “similar” and a white box indicates “different” from the NTP test article. Only samples used in all analyses are presented. SC-PHH = sandwich culture of primary human hepatocytes.
Figure 12.
Figure 12.
Distance line plots for black cohosh (A) and Echinacea purpurea (B) samples. Pearson’s linear correlation coefficients were calculated in reference to the NTP test article sample (BC/EP 1) using data from the nontargeted chemistry analyses. The samples are plotted by distance from the reference with the test article set at 1 (far left of the plot). Further distance from the NTP test article (further right) indicates more chemical dissimilarity. Similarity determinations from the gene expression analysis in sandwich-culture primary human hepatocytes are indicated by color (green = similar; red = different). The black dot references the NTP test article.

References

    1. Avigan M. I., Mozersky R. P., Seeff L. B. (2016). Scientific and regulatory perspectives in herbal and dietary supplement associated hepatotoxicity in the United States. Int. J. Mol. Sci. 17, 331.. - PMC - PubMed
    1. Awortwe C., Manda V. K., Avonto C., Khan S. I., Khan I. A., Walker L. A., Bouic P. J., Rosenkranz B. (2015). Echinacea purpurea up-regulates CYP1A2, CYP3A4 and MDR1 gene expression by activation of pregnane X receptor pathway. Xenobiotica 45, 218–229. - PMC - PubMed
    1. Bittner M., Schenk R., Springer A., Melzig M. F. (2016). Economical, plain, and rapid authentication of Actaea racemosa L. (syn. Cimicifuga racemosa, Black Cohosh) herbal raw material by resilient RP-PDA-HPLC and chemometric analysis. Phytochem. Anal. 27, 318–325. - PubMed
    1. Catlin N. R., Collins B. J., Auerbach S. S., Ferguson S. S., Harnly J. M., Gennings C., Waidyanatha S., Rice G. E., Smith-Roe S. L., Witt K. L., et al. (2018). How similar is similar enough? A sufficient similarity case study with Ginkgo biloba extract. Food Chem. Toxicol. 118, 328–339. - PMC - PubMed
    1. Cicek S. S., Girreser U., Zidorn C. (2018). Quantification of the total amount of black cohosh cycloartanoids by integration of one specific (1)H NMR signal. J. Pharm. Biomed. Anal. 155, 109–115. - PubMed

Publication types

MeSH terms