

Systematic Exploration of the High Likelihood Set of Phylogenetic Tree Topologies
- PMID: 31504997
- PMCID: PMC7682726
- DOI: 10.1093/sysbio/syz047
Systematic Exploration of the High Likelihood Set of Phylogenetic Tree Topologies
Abstract
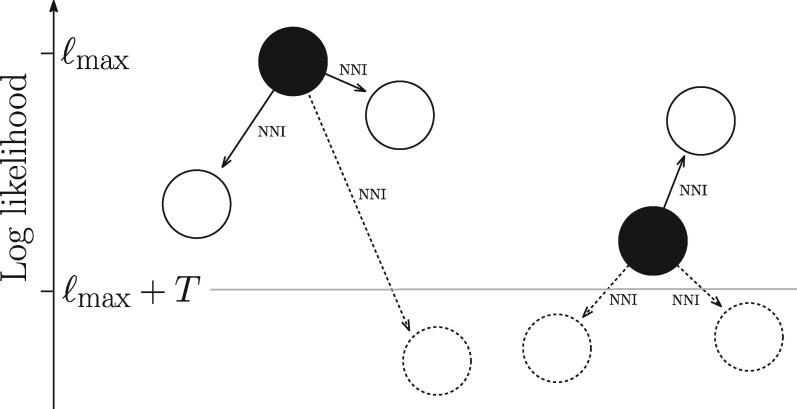
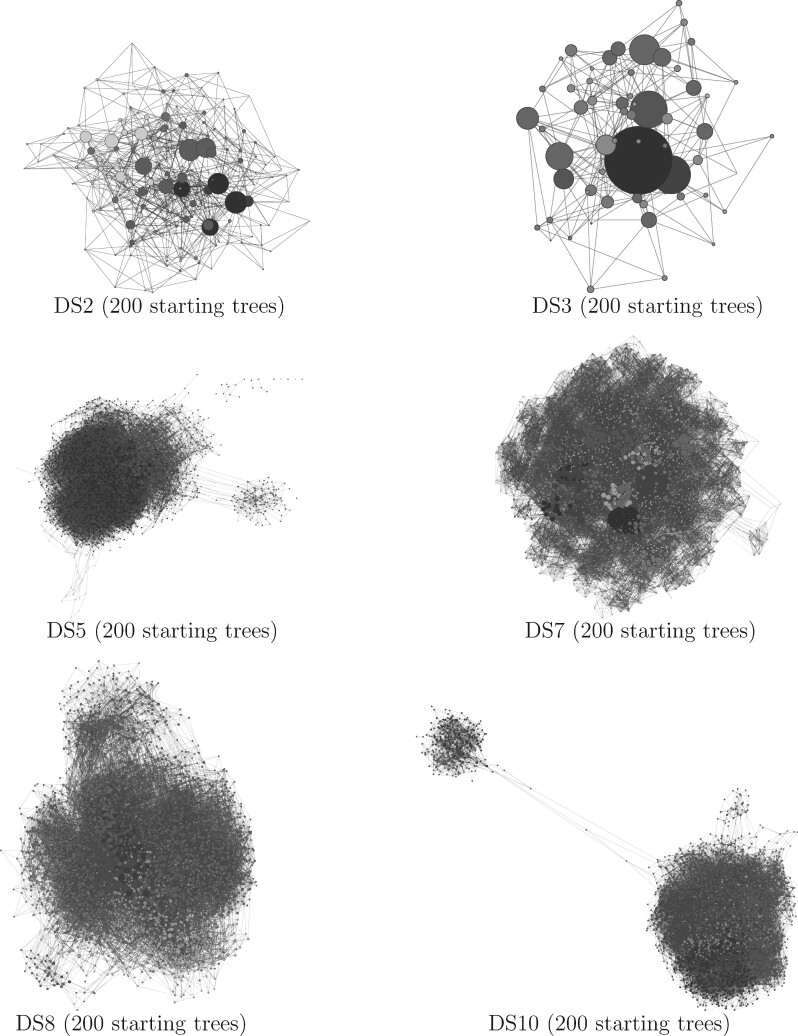
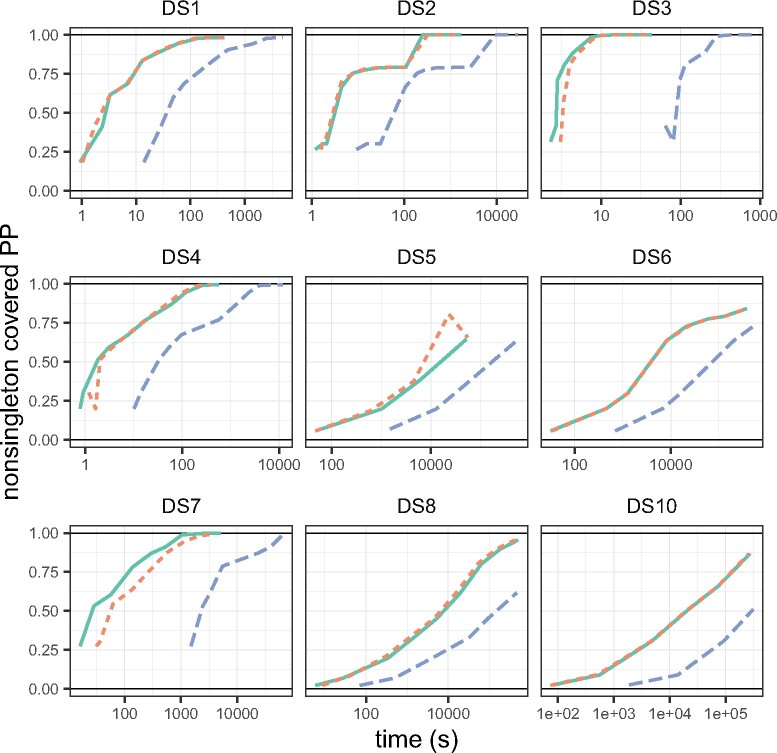
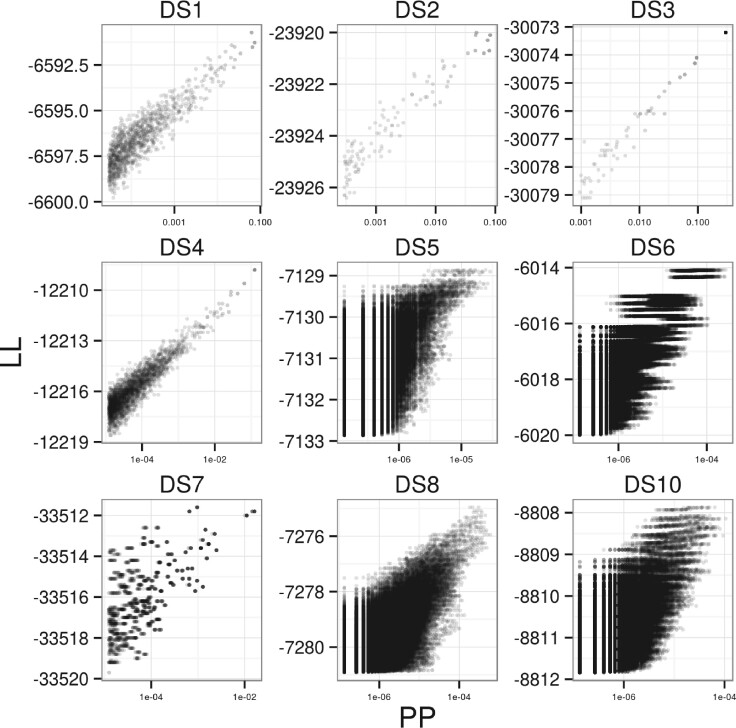
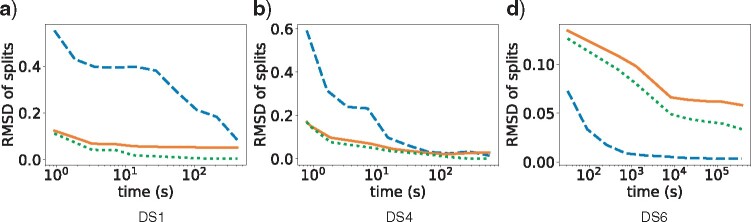
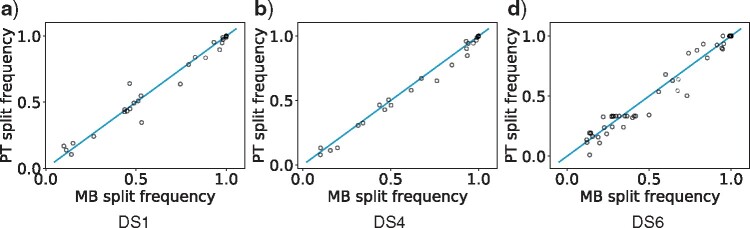
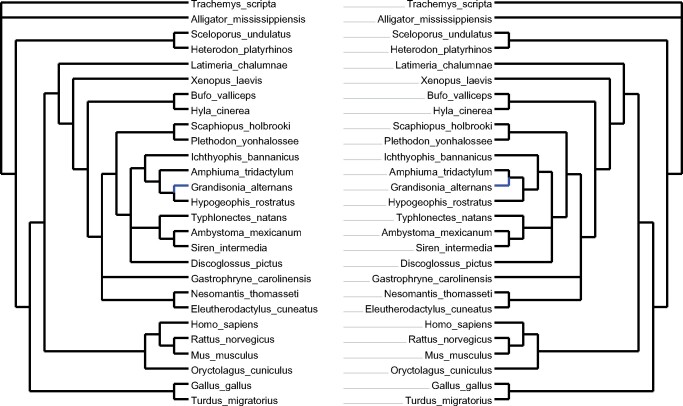
Bayesian Markov chain Monte Carlo explores tree space slowly, in part because it frequently returns to the same tree topology. An alternative strategy would be to explore tree space systematically, and never return to the same topology. In this article, we present an efficient parallelized method to map out the high likelihood set of phylogenetic tree topologies via systematic search, which we show to be a good approximation of the high posterior set of tree topologies on the data sets analyzed. Here, "likelihood" of a topology refers to the tree likelihood for the corresponding tree with optimized branch lengths. We call this method "phylogenetic topographer" (PT). The PT strategy is very simple: starting in a number of local topology maxima (obtained by hill-climbing from random starting points), explore out using local topology rearrangements, only continuing through topologies that are better than some likelihood threshold below the best observed topology. We show that the normalized topology likelihoods are a useful proxy for the Bayesian posterior probability of those topologies. By using a nonblocking hash table keyed on unique representations of tree topologies, we avoid visiting topologies more than once across all concurrent threads exploring tree space. We demonstrate that PT can be used directly to approximate a Bayesian consensus tree topology. When combined with an accurate means of evaluating per-topology marginal likelihoods, PT gives an alternative procedure for obtaining Bayesian posterior distributions on phylogenetic tree topologies.
Keywords: Bayesian phylogenetics; consensus trees; phylogenetic islands; phylogenetic tree topology; systematic search.
© The Author(s) 2019. Published by Oxford University Press, on behalf of the Society of Systematic Biologists. All rights reserved. For permissions, please email: journals.permissions@oup.com.
Figures
Similar articles
-
19 Dubious Ways to Compute the Marginal Likelihood of a Phylogenetic Tree Topology.Syst Biol. 2020 Mar 1;69(2):209-220. doi: 10.1093/sysbio/syz046. Syst Biol. 2020. PMID: 31504998 Free PMC article.
-
An Efficient Independence Sampler for Updating Branches in Bayesian Markov chain Monte Carlo Sampling of Phylogenetic Trees.Syst Biol. 2016 Jan;65(1):161-76. doi: 10.1093/sysbio/syv051. Epub 2015 Jul 30. Syst Biol. 2016. PMID: 26231183 Free PMC article.
-
Polytomies and Bayesian phylogenetic inference.Syst Biol. 2005 Apr;54(2):241-53. doi: 10.1080/10635150590924208. Syst Biol. 2005. PMID: 16012095
-
Marginal Likelihoods in Phylogenetics: A Review of Methods and Applications.Syst Biol. 2019 Sep 1;68(5):681-697. doi: 10.1093/sysbio/syz003. Syst Biol. 2019. PMID: 30668834 Free PMC article. Review.
-
Bayesian tests of topology hypotheses with an example from diving beetles.Syst Biol. 2013 Sep;62(5):660-73. doi: 10.1093/sysbio/syt029. Epub 2013 Apr 28. Syst Biol. 2013. PMID: 23628960 Free PMC article. Review.
Cited by
-
19 Dubious Ways to Compute the Marginal Likelihood of a Phylogenetic Tree Topology.Syst Biol. 2020 Mar 1;69(2):209-220. doi: 10.1093/sysbio/syz046. Syst Biol. 2020. PMID: 31504998 Free PMC article.
-
Fidelity of hyperbolic space for Bayesian phylogenetic inference.PLoS Comput Biol. 2023 Apr 26;19(4):e1011084. doi: 10.1371/journal.pcbi.1011084. eCollection 2023 Apr. PLoS Comput Biol. 2023. PMID: 37099595 Free PMC article.
-
How Trustworthy Is Your Tree? Bayesian Phylogenetic Effective Sample Size Through the Lens of Monte Carlo Error.Bayesian Anal. 2024 Jun;19(2):565-593. doi: 10.1214/22-ba1339. Epub 2024 Apr 9. Bayesian Anal. 2024. PMID: 38665694 Free PMC article.
-
Testing Phylogenetic Stability with Variable Taxon Sampling.Methods Mol Biol. 2022;2569:167-188. doi: 10.1007/978-1-0716-2691-7_8. Methods Mol Biol. 2022. PMID: 36083448
-
Finding high posterior density phylogenies by systematically extending a directed acyclic graph.Algorithms Mol Biol. 2025 Feb 28;20(1):2. doi: 10.1186/s13015-025-00273-x. Algorithms Mol Biol. 2025. PMID: 40022201 Free PMC article.
References
-
- Blei D.M., Kucukelbir A., McAuliffe J.D.. 2017. Variational inference: a review for statisticians. J. Am. Stat. Assoc. 112:859–877.
-
- Dinh V., Bilge A., Zhang C., Matsen F.A. IV.. 2017. Probabilistic path Hamiltonian Monte Carlo. International Conference on Machine Learning. 1009–1018.
-
- Dobra A., Massam H.. 2010. The mode oriented stochastic search (MOSS) algorithm for log-linear models with conjugate priors. Stat. Methodol. 7:240–253.
-
- Flouri T., Darriba D., Kozlov A., Holder M.T., Matsen F.A. IV, Barbera P.. 2018. libpll. Available from: https://github.com/xflouris/libpll.
Publication types
MeSH terms
Grants and funding
LinkOut - more resources
Full Text Sources
Miscellaneous
