

Hepatocyte Stress Increases Expression of Yes-Associated Protein and Transcriptional Coactivator With PDZ-Binding Motif in Hepatocytes to Promote Parenchymal Inflammation and Fibrosis
- PMID: 31505040
- PMCID: PMC7062580
- DOI: 10.1002/hep.30928
Hepatocyte Stress Increases Expression of Yes-Associated Protein and Transcriptional Coactivator With PDZ-Binding Motif in Hepatocytes to Promote Parenchymal Inflammation and Fibrosis
Abstract
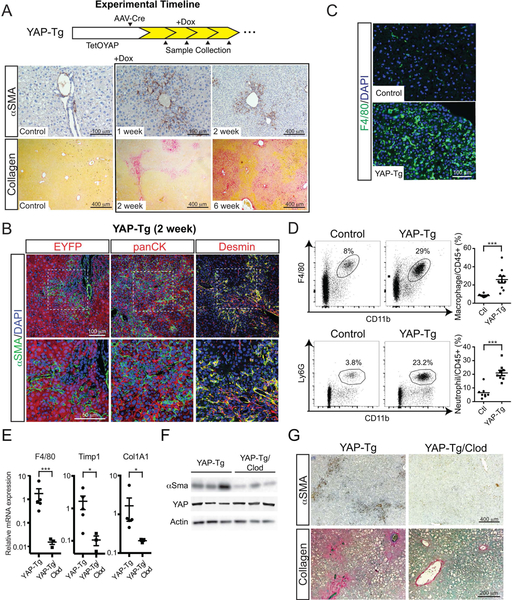
Background and aims: Activated hepatocytes are hypothesized to be a major source of signals that drive cirrhosis, but the biochemical pathways that convert hepatocytes into such a state are unclear. We examined the role of the Hippo pathway transcriptional coactivators Yes-associated protein (YAP) and transcriptional coactivator with PDZ-binding motif (TAZ) in hepatocytes to facilitate cell-cell interactions that stimulate liver inflammation and fibrosis.
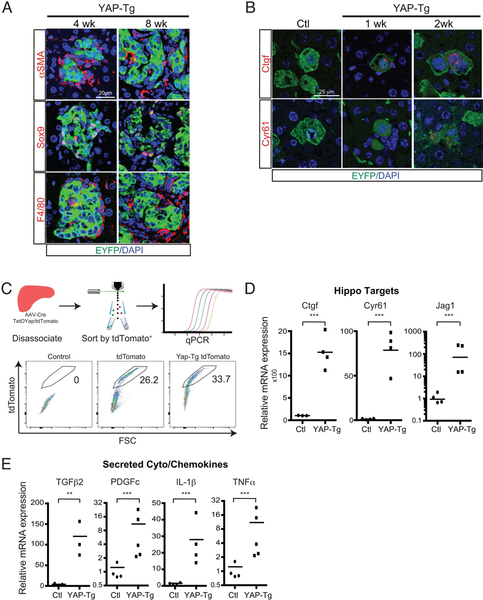
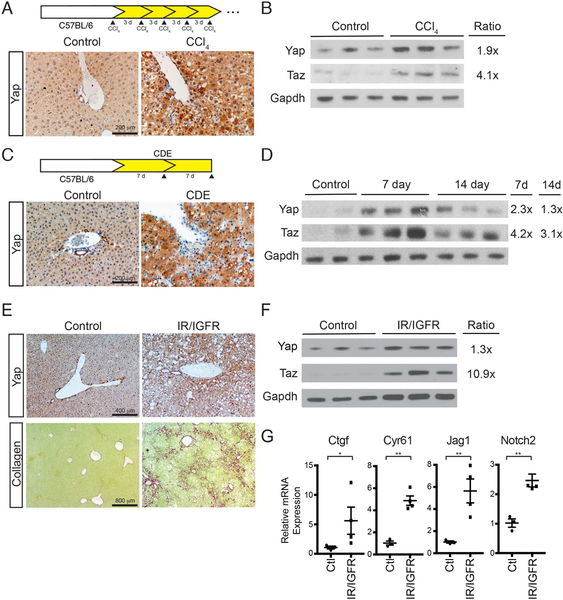
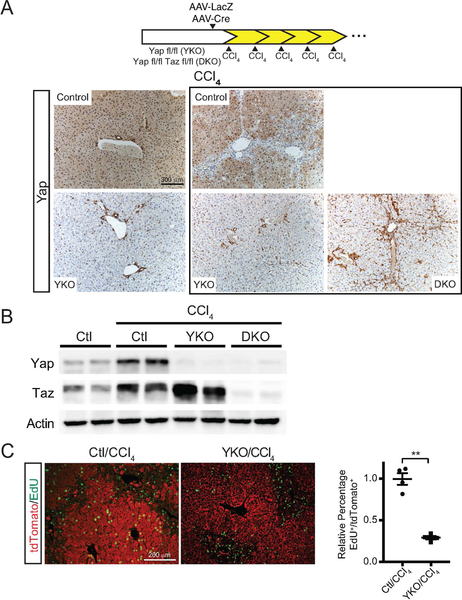
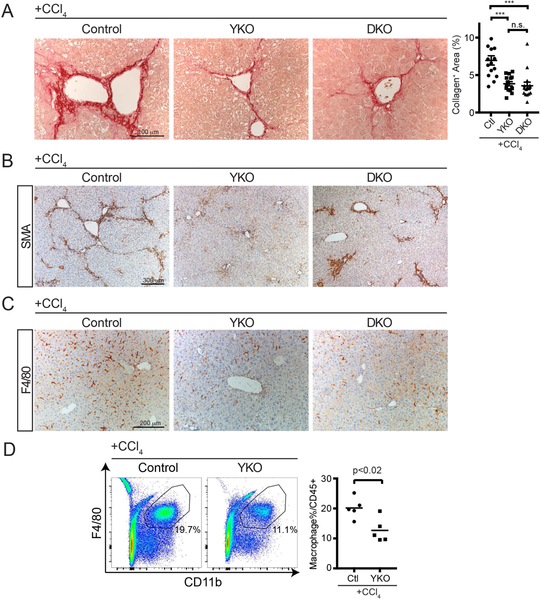
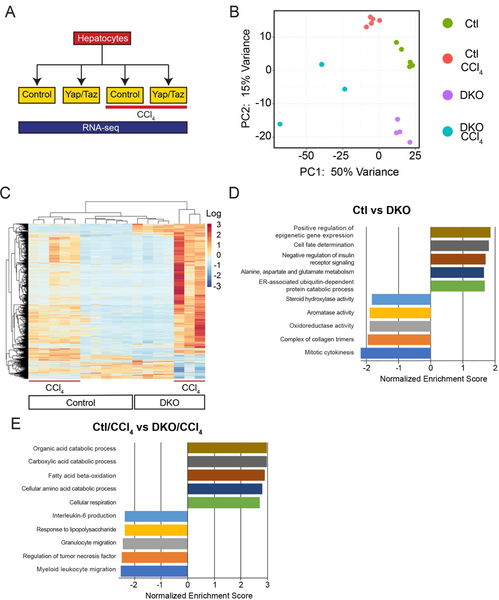
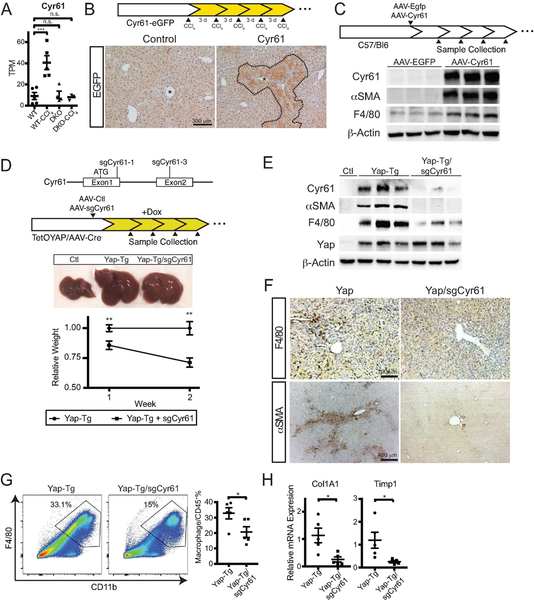
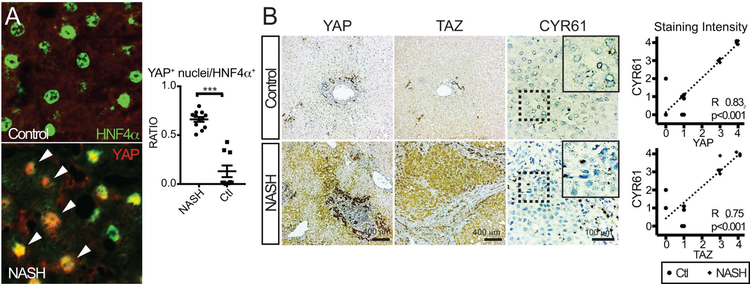
Approach and results: Using a variety of genetic, metabolic, and liver injury models in mice, we manipulated Hippo signaling in hepatocytes and examined its effects in nonparenchymal cells to promote liver inflammation and fibrosis. YAP-expressing hepatocytes rapidly and potently activate the expression of proteins that promote fibrosis (collagen type I alpha 1 chain, tissue inhibitor of metalloproteinase 1, platelet-derived growth factor c, transforming growth factor β2) and inflammation (tumor necrosis factor, interleukin 1β). They stimulate expansion of myofibroblasts and immune cells, followed by aggressive liver fibrosis. In contrast, hepatocyte-specific YAP and YAP/TAZ knockouts exhibit limited myofibroblast expansion, less inflammation, and decreased fibrosis after CCl4 injury despite a similar degree of necrosis as controls. We identified cellular communication network factor 1 (CYR61) as a chemokine that is up-regulated by hepatocytes during liver injury but is expressed at significantly lower levels in mice with hepatocyte-specific deletion of YAP or TAZ. Gain-of-function and loss-of-function experiments with CYR61 in vivo point to it being a key chemokine controlling liver fibrosis and inflammation in the context of YAP/TAZ. There is a direct correlation between levels of YAP/TAZ and CYR61 in liver tissues of patients with high-grade nonalcoholic steatohepatitis.
Conclusions: Liver injury in mice and humans increases levels of YAP/TAZ/CYR61 in hepatocytes, thus attracting macrophages to the liver to promote inflammation and fibrosis.
© 2019 by the American Association for the Study of Liver Diseases.
Conflict of interest statement
Figures
Similar articles
-
Peritumoral activation of the Hippo pathway effectors YAP and TAZ suppresses liver cancer in mice.Science. 2019 Nov 22;366(6468):1029-1034. doi: 10.1126/science.aaw9886. Science. 2019. PMID: 31754005
-
Low MBOAT7 expression, a genetic risk for MASH, promotes a profibrotic pathway involving hepatocyte TAZ upregulation.Hepatology. 2025 Feb 1;81(2):576-590. doi: 10.1097/HEP.0000000000000933. Epub 2024 May 22. Hepatology. 2025. PMID: 38776184
-
Suppression of YAP/TAZ-Notch1-NICD axis by bromodomain and extraterminal protein inhibition impairs liver regeneration.Theranostics. 2019 May 31;9(13):3840-3852. doi: 10.7150/thno.33370. eCollection 2019. Theranostics. 2019. PMID: 31281517 Free PMC article.
-
Interplay between YAP/TAZ and metabolic dysfunction-associated steatotic liver disease progression.Arch Pharm Res. 2024 Jun;47(6):558-570. doi: 10.1007/s12272-024-01501-5. Epub 2024 Jun 14. Arch Pharm Res. 2024. PMID: 38874747 Free PMC article. Review.
-
Roles of Yes-associated protein and transcriptional coactivator with PDZ-binding motif in non-neoplastic liver diseases.Biomed Pharmacother. 2022 Jul;151:113166. doi: 10.1016/j.biopha.2022.113166. Epub 2022 May 24. Biomed Pharmacother. 2022. PMID: 35609372 Review.
Cited by
-
YAP in epithelium senses gut barrier loss to deploy defenses against pathogens.PLoS Pathog. 2020 Aug 28;16(8):e1008766. doi: 10.1371/journal.ppat.1008766. eCollection 2020 Aug. PLoS Pathog. 2020. PMID: 32857822 Free PMC article.
-
Hepatocyte-Specific Smad4 Deficiency Alleviates Liver Fibrosis via the p38/p65 Pathway.Int J Mol Sci. 2022 Oct 2;23(19):11696. doi: 10.3390/ijms231911696. Int J Mol Sci. 2022. PMID: 36232998 Free PMC article.
-
Mechanisms of Fibrosis Development in Nonalcoholic Steatohepatitis.Gastroenterology. 2020 May;158(7):1913-1928. doi: 10.1053/j.gastro.2019.11.311. Epub 2020 Feb 8. Gastroenterology. 2020. PMID: 32044315 Free PMC article. Review.
-
MCM7 promotes liver fibrosis by transcriptionally regulating IL11 via the SHCBP1-RACGAP1-STAT3 axis.Cell Death Dis. 2025 Aug 11;16(1):608. doi: 10.1038/s41419-025-07937-x. Cell Death Dis. 2025. PMID: 40789837 Free PMC article.
-
Maladaptive regeneration - the reawakening of developmental pathways in NASH and fibrosis.Nat Rev Gastroenterol Hepatol. 2021 Feb;18(2):131-142. doi: 10.1038/s41575-020-00365-6. Epub 2020 Oct 13. Nat Rev Gastroenterol Hepatol. 2021. PMID: 33051603 Free PMC article. Review.
References
-
- Murphy SL, Xu J, Kochanek KD, Curtin SC, Arias E. Deaths: Final Data for 2015. Natl Vital Stat Rep 2017;66:1–75. - PubMed
-
- Patel V Deaths registered in England and Wales: 2016. In: Office for National Statistics; 2017. p. 1–13.
-
- Organization WH. World Health Statistics 2017: Monitoring Health for the SDGs, Sustainable Development Goals. In: World Health Organization; 2017.
-
- Sia D, Villanueva A, Friedman SL, Llovet JM. Liver Cancer Cell of Origin, Molecular Class, and Effects on Patient Prognosis. Gastroenterology 2017;152:745–761. - PubMed
Publication types
MeSH terms
Substances
Grants and funding
- K08 DK105351/DK/NIDDK NIH HHS/United States
- T32 EB001026/EB/NIBIB NIH HHS/United States
- R01DK033201/DK/NIDDK NIH HHS/United States
- P30 DK120531/DK/NIDDK NIH HHS/United States
- 2P30DK034854/DK/NIDDK NIH HHS/United States
- P30 DK036836/DK/NIDDK NIH HHS/United States
- R01DK031036/DK/NIDDK NIH HHS/United States
- K08 DK105351/NH/NIH HHS/United States
- R01 DK033201/DK/NIDDK NIH HHS/United States
- UL1 RR025758/RR/NCRR NIH HHS/United States
- R01 DK031036/DK/NIDDK NIH HHS/United States
- R01 CA183119/CA/NCI NIH HHS/United States
- R01DK099559/DK/NIDDK NIH HHS/United States
- K12 HD000850/HD/NICHD NIH HHS/United States
- P30DK40561/DK/NIDDK NIH HHS/United States
- P30 DK034854/DK/NIDDK NIH HHS/United States
- R01 DK099559/DK/NIDDK NIH HHS/United States
- R01CA183119/CA/NCI NIH HHS/United States
- R37 DK031036/DK/NIDDK NIH HHS/United States
- UL1RR025758/NH/NIH HHS/United States
- K12HD000850/HD/NICHD NIH HHS/United States
LinkOut - more resources
Full Text Sources
Medical
Molecular Biology Databases
Research Materials
Miscellaneous
