

MitoPark transgenic mouse model recapitulates the gastrointestinal dysfunction and gut-microbiome changes of Parkinson's disease
- PMID: 31505196
- PMCID: PMC7048412
- DOI: 10.1016/j.neuro.2019.09.004
MitoPark transgenic mouse model recapitulates the gastrointestinal dysfunction and gut-microbiome changes of Parkinson's disease
Abstract
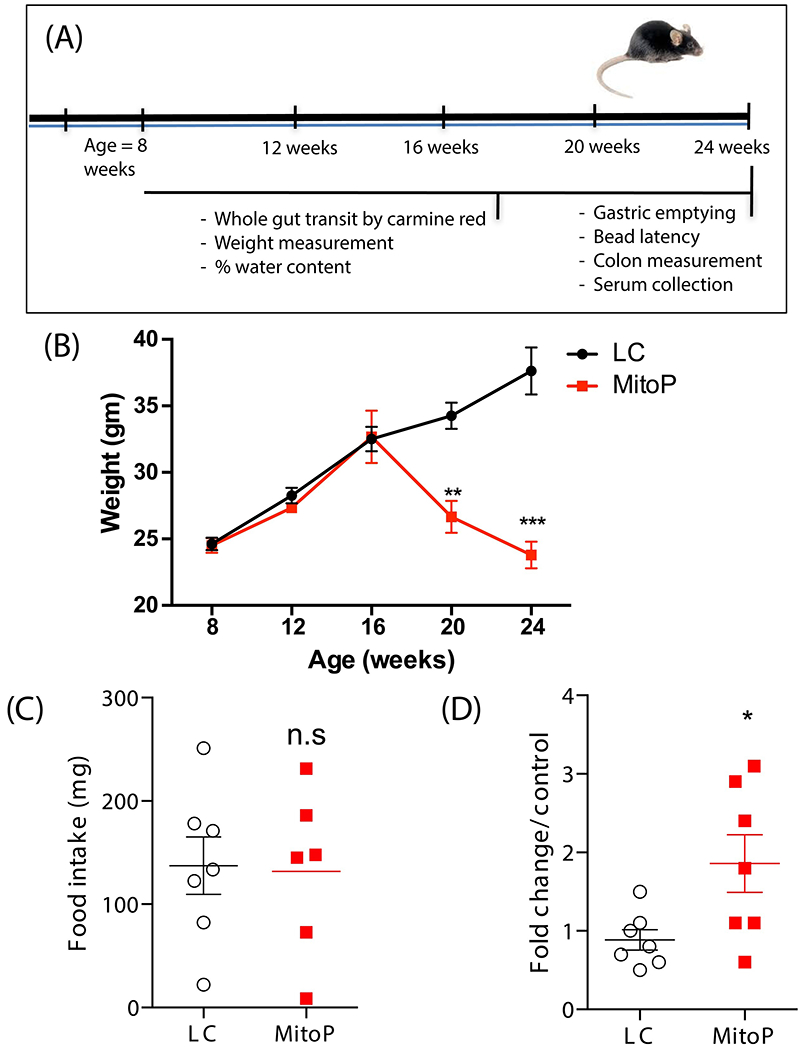
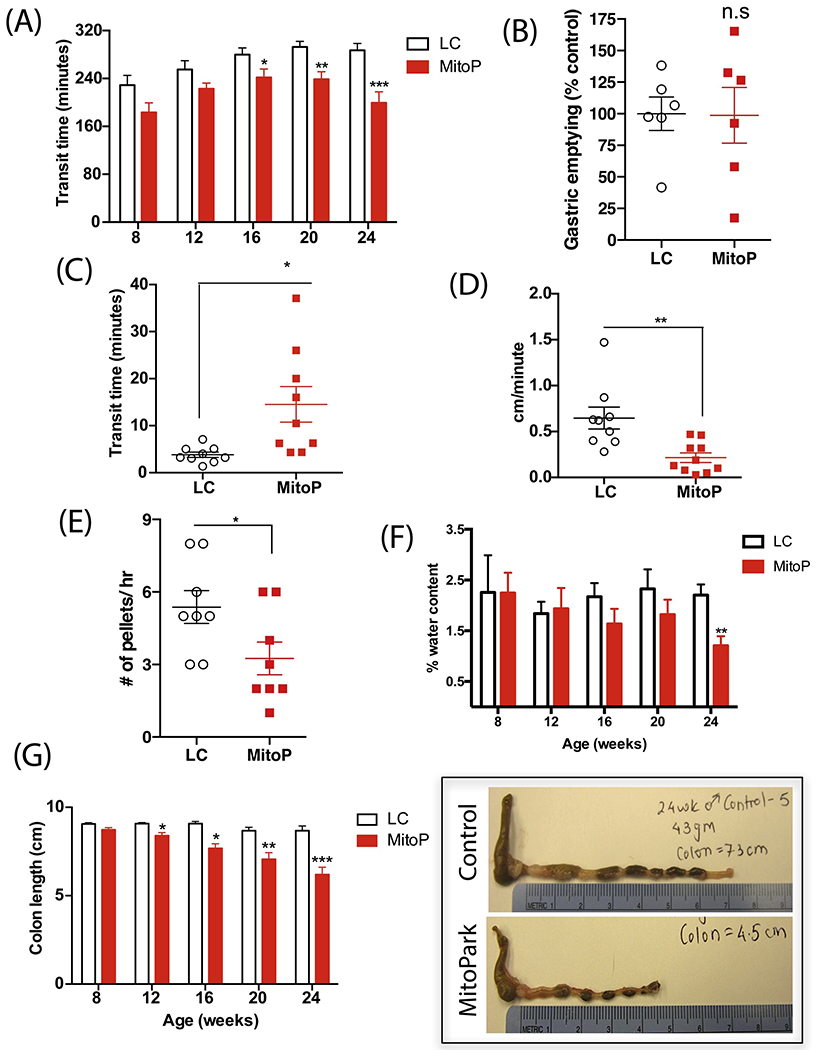
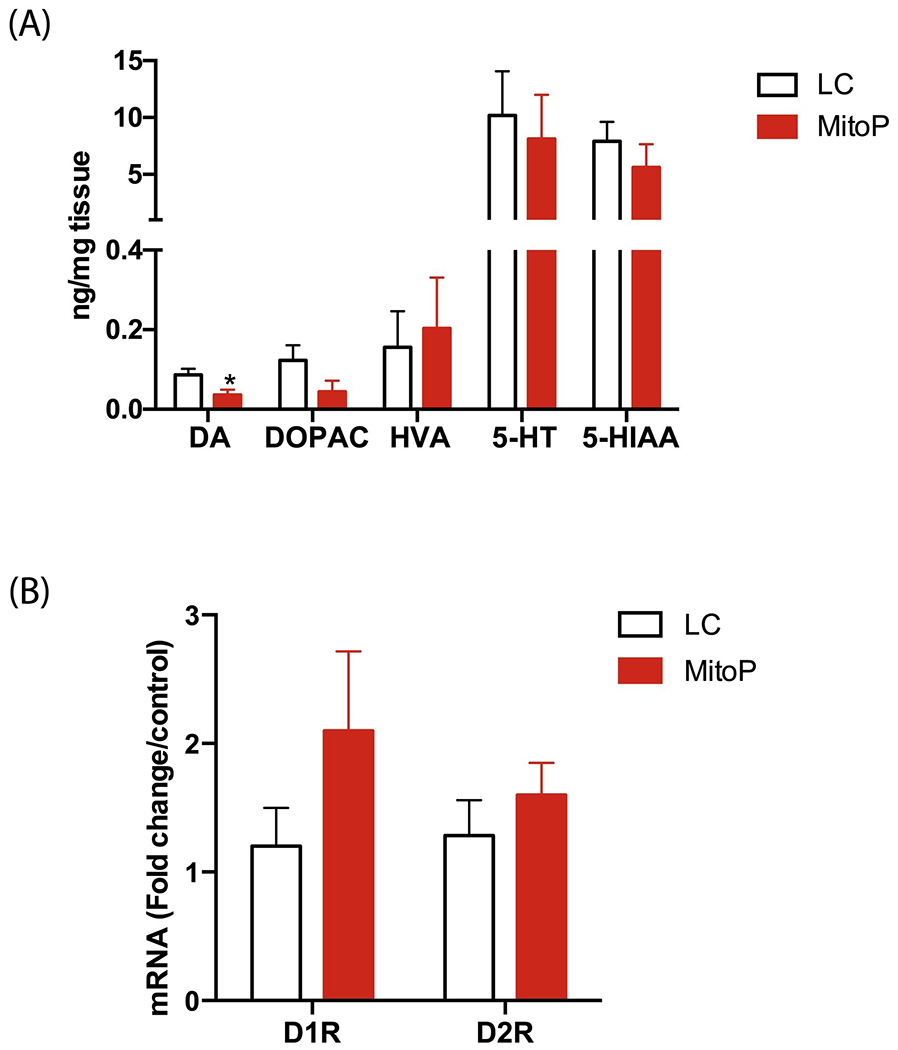
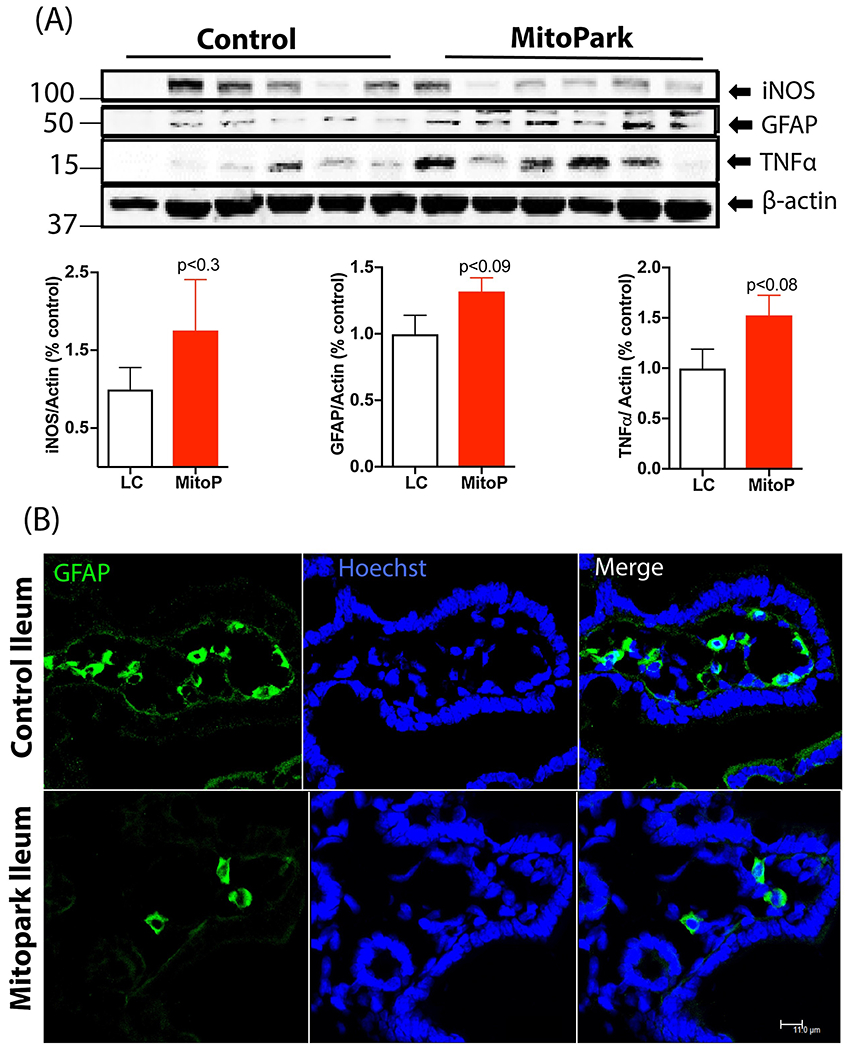
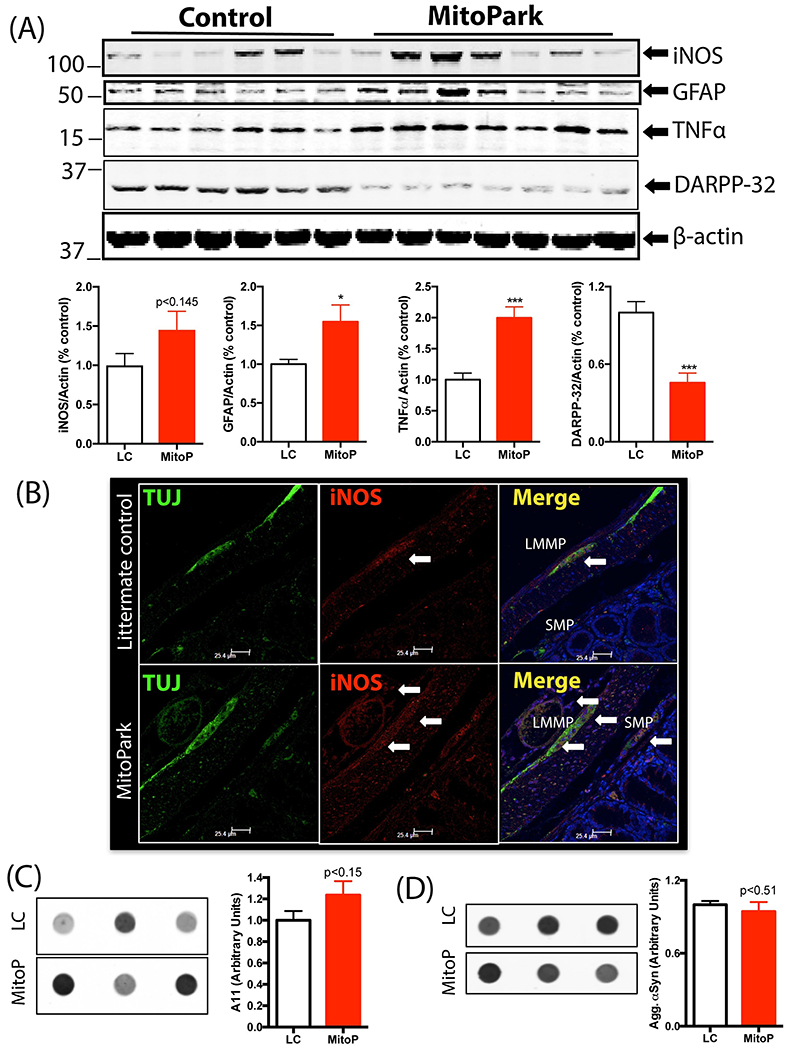
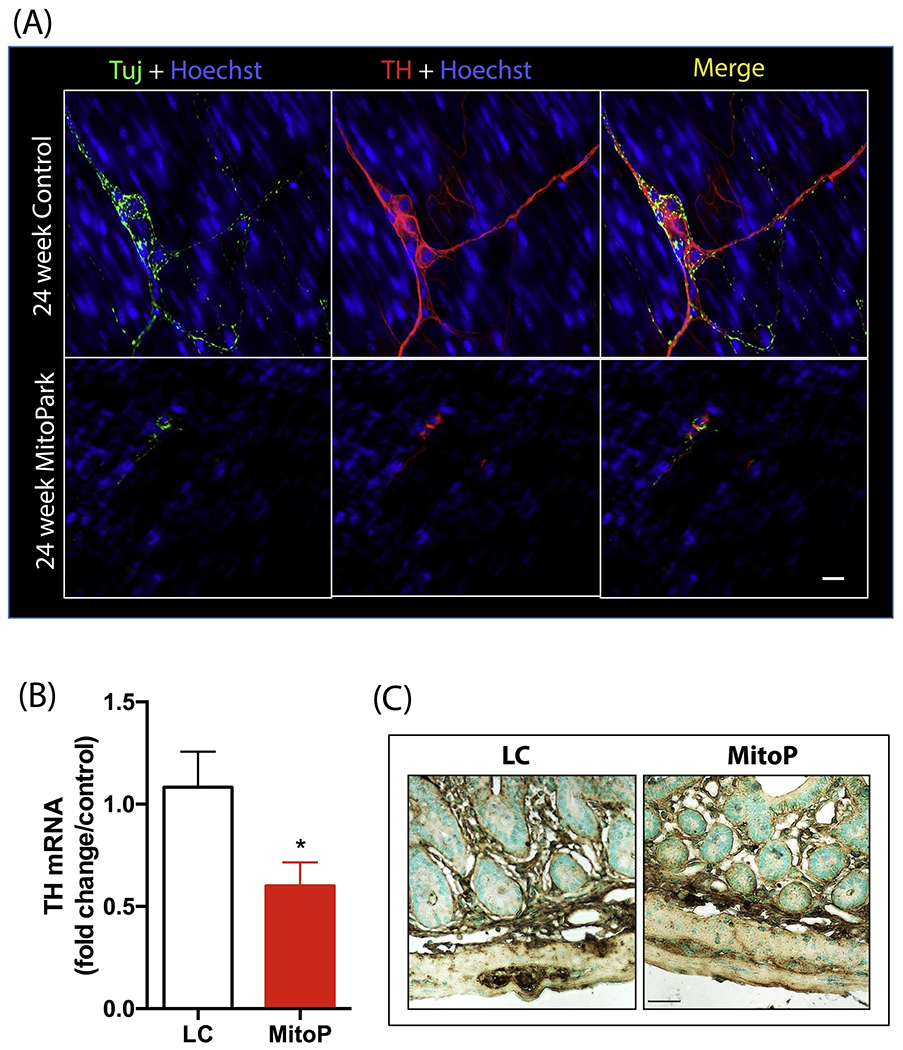
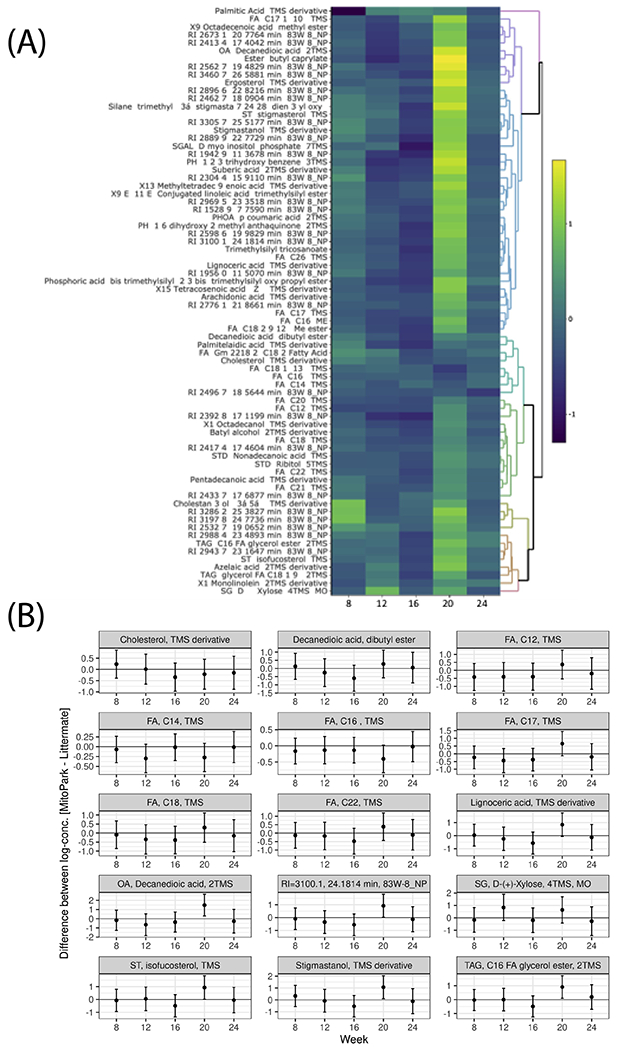
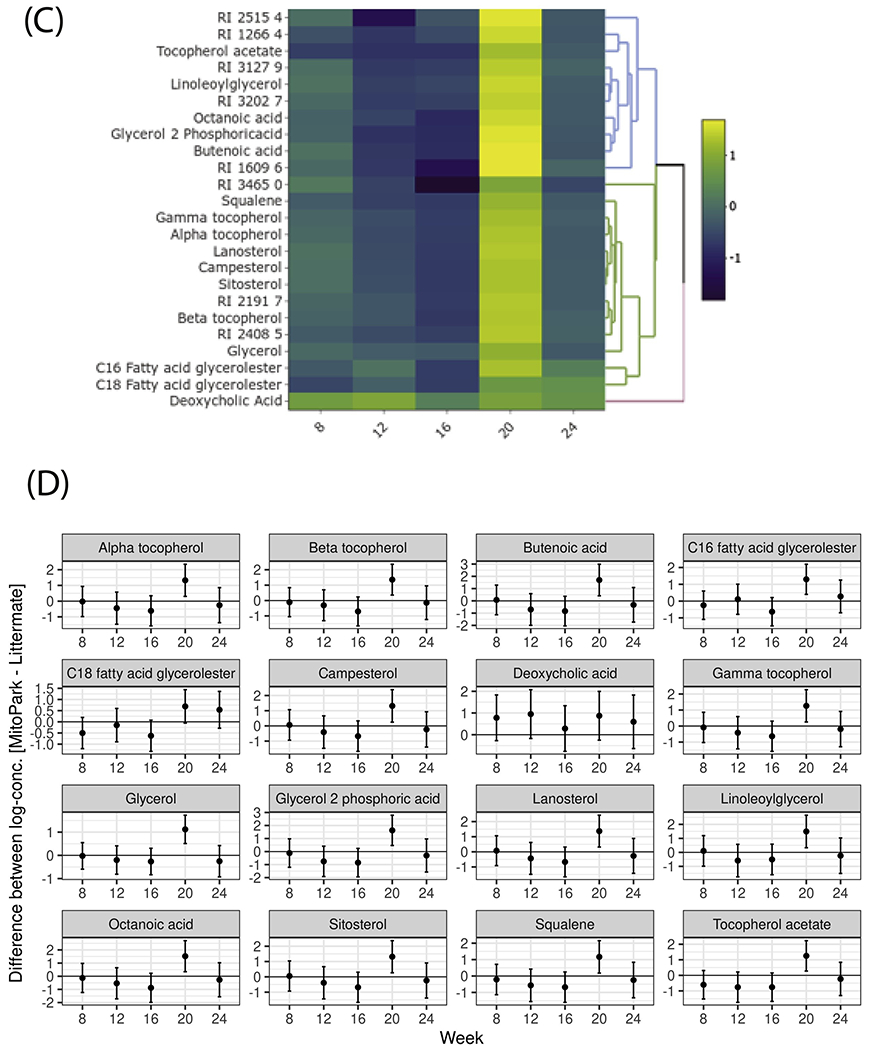
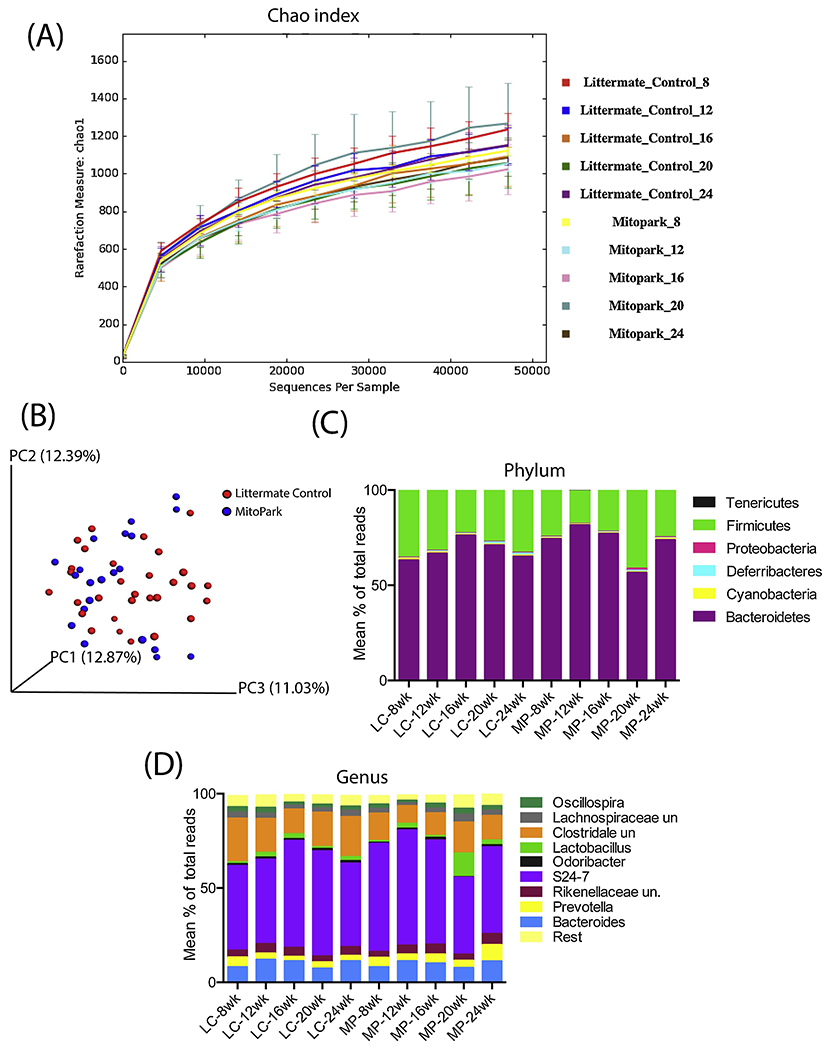
Gastrointestinal (GI) disturbances are one of the earliest symptoms affecting most patients with Parkinson's disease (PD). In many cases, these symptoms are observed years before motor impairments become apparent. Hence, the molecular and cellular underpinnings that contribute to this early GI dysfunction in PD have actively been explored using a relevant animal model. The MitoPark model is a chronic, progressive mouse model recapitulating several key pathophysiological aspects of PD. However, GI dysfunction and gut microbiome changes have not been categorized in this model. Herein, we show that decreased GI motility was one of the first non-motor symptoms to develop, evident as early as 8 weeks with significantly different transit times from 12 weeks onwards. These symptoms were observed well before motor symptoms developed, thereby paralleling PD progression in humans. At age 24 weeks, we observed increased colon transit time and reduced fecal water content, indicative of constipation. Intestinal inflammation was evidenced with increased expression of iNOS and TNFα in the small and large intestine. Specifically, iNOS was observed mainly in the enteric plexi, indicating enteric glial cell activation. A pronounced loss of tyrosine hydroxylase-positive neurons occurred at 24 weeks both in the mid-brain region as well as the gut, leading to a corresponding decrease in dopamine (DA) production. We also observed decreased DARPP-32 expression in the colon, validating the loss of DAergic neurons in the gut. However, the total number of enteric neurons did not significantly differ between the two groups. Metabolomic gas chromatography-mass spectrometry analysis of fecal samples showed increased sterol, glycerol, and tocopherol production in MitoPark mice compared to age-matched littermate controls at 20 weeks of age while 16 s microbiome sequencing showed a transient temporal increase in the genus Prevotella. Altogether, the data shed more light on the role of the gut dopaminergic system in maintaining intestinal health. Importantly, this model recapitulates the chronology and development of GI dysfunction along with other non-motor symptoms and can become an attractive translational animal model for pre-clinical assessment of the efficacy of new anti-Parkinsonian drugs that can alleviate GI dysfunction in PD.
Keywords: Gastrointestinal motility; Intestinal inflammation; Microbiome; Non-motor symptoms; Parkinson’s disease; Translational research.
Copyright © 2019 Elsevier B.V. All rights reserved.
Conflict of interest statement
Potential Conflicts of Interest
AGK and VA have an equity interest in PK Biosciences Corporation located in Ames, IA. The terms of this arrangement have been reviewed and approved by Iowa State University in accordance with its conflict of interest policies. All other authors declare no potential conflicts of interest.
Figures
Similar articles
-
Assessment of gastrointestinal function and enteric nervous system changes over time in the A53T mouse model of Parkinson's disease.Acta Neuropathol Commun. 2025 Mar 12;13(1):58. doi: 10.1186/s40478-025-01956-7. Acta Neuropathol Commun. 2025. PMID: 40075409 Free PMC article.
-
Intestinal Pathology and Gut Microbiota Alterations in a Methyl-4-phenyl-1,2,3,6-tetrahydropyridine (MPTP) Mouse Model of Parkinson's Disease.Neurochem Res. 2018 Oct;43(10):1986-1999. doi: 10.1007/s11064-018-2620-x. Epub 2018 Aug 31. Neurochem Res. 2018. PMID: 30171422
-
Alterations of the gut microbiota with antibiotics protects dopamine neuron loss and improve motor deficits in a pharmacological rodent model of Parkinson's disease.Exp Neurol. 2020 Mar;325:113159. doi: 10.1016/j.expneurol.2019.113159. Epub 2019 Dec 13. Exp Neurol. 2020. PMID: 31843492
-
Chronic stress-induced gut dysfunction exacerbates Parkinson's disease phenotype and pathology in a rotenone-induced mouse model of Parkinson's disease.Neurobiol Dis. 2020 Feb;135:104352. doi: 10.1016/j.nbd.2018.12.012. Epub 2018 Dec 21. Neurobiol Dis. 2020. PMID: 30579705 Review.
-
T-Cell-Driven Inflammation as a Mediator of the Gut-Brain Axis Involved in Parkinson's Disease.Front Immunol. 2019 Feb 15;10:239. doi: 10.3389/fimmu.2019.00239. eCollection 2019. Front Immunol. 2019. PMID: 30828335 Free PMC article. Review.
Cited by
-
STRUCTURAL BASES OF GASTROINTESTINAL MOTILITY CHANGES IN PARKINSON'S DISEASE: STUDY IN RATS.Arq Bras Cir Dig. 2021 Jan 15;33(3):e1548. doi: 10.1590/0102-672020200003e1548. eCollection 2021. Arq Bras Cir Dig. 2021. PMID: 33470378 Free PMC article.
-
Mitochondrial stress-induced H4K12 hyperacetylation dysregulates transcription in Parkinson's disease.Front Cell Neurosci. 2024 Aug 12;18:1422362. doi: 10.3389/fncel.2024.1422362. eCollection 2024. Front Cell Neurosci. 2024. PMID: 39188570 Free PMC article.
-
Role of Microbiota-Gut-Brain Axis in Regulating Dopaminergic Signaling.Biomedicines. 2022 Feb 13;10(2):436. doi: 10.3390/biomedicines10020436. Biomedicines. 2022. PMID: 35203645 Free PMC article. Review.
-
The microbiome-gut-brain axis in Parkinson disease - from basic research to the clinic.Nat Rev Neurol. 2022 Aug;18(8):476-495. doi: 10.1038/s41582-022-00681-2. Epub 2022 Jun 24. Nat Rev Neurol. 2022. PMID: 35750883 Review.
-
Heterogeneity of dopamine release sites in health and degeneration.Neurobiol Dis. 2020 Feb;134:104633. doi: 10.1016/j.nbd.2019.104633. Epub 2019 Nov 5. Neurobiol Dis. 2020. PMID: 31698055 Free PMC article. Review.
References
-
- Ay M, Luo J, Langley M, Jin H, Anantharam V, Kanthasamy A, Kanthasamy AG, 2017. Molecular mechanisms underlying protective effects of quercetin against mitochondrial dysfunction and progressive dopaminergic neurodegeneration in cell culture and MitoPark transgenic mouse models of Parkinson’s Disease. J Neurochem 141(5), 766–782. - PMC - PubMed
-
- Bestetti A, Capozza A, Lacerenza M, Manfredi L, Mancini F, 2017. Delayed Gastric Emptying in Advanced Parkinson Disease: Correlation With Therapeutic Doses. Clin Nucl Med 42(2), 83–87. - PubMed
-
- Brown P, 2003. Oscillatory nature of human basal ganglia activity: relationship to the pathophysiology of Parkinson’s disease. Mov Disord 18(4), 357–363. - PubMed
Publication types
MeSH terms
Substances
Grants and funding
LinkOut - more resources
Full Text Sources
Molecular Biology Databases
