. 2019 Oct:307:106573.
doi: 10.1016/j.jmr.2019.106573. Epub 2019 Aug 14.

Modular, triple-resonance, transmission line DNP MAS probe for 500 MHz/330 GHz

Affiliations

Modular, triple-resonance, transmission line DNP MAS probe for 500 MHz/330 GHz

Marcel Reese et al. J Magn Reson. 2019 Oct.

Abstract

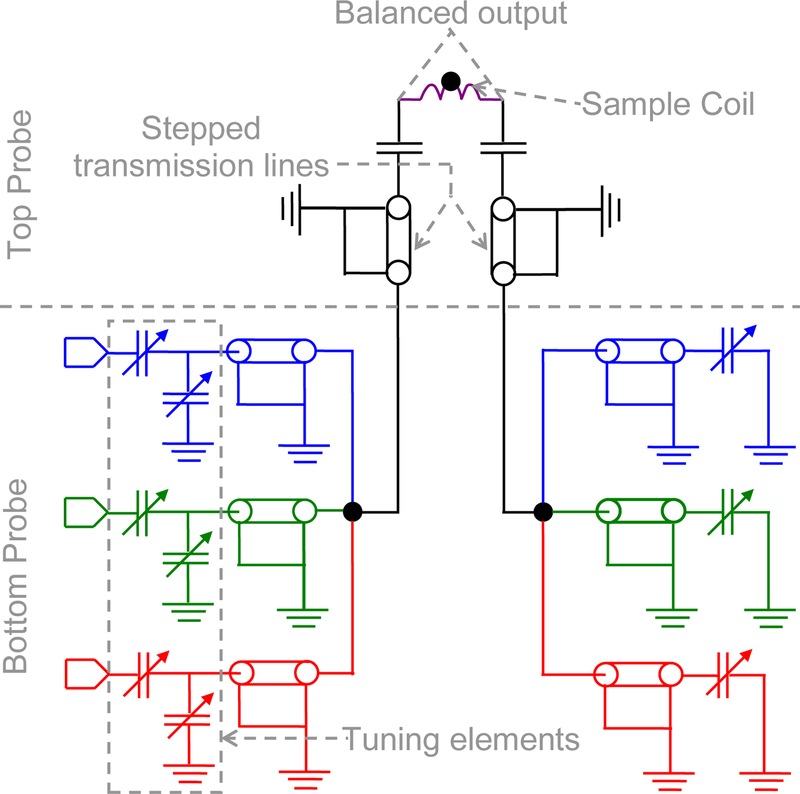
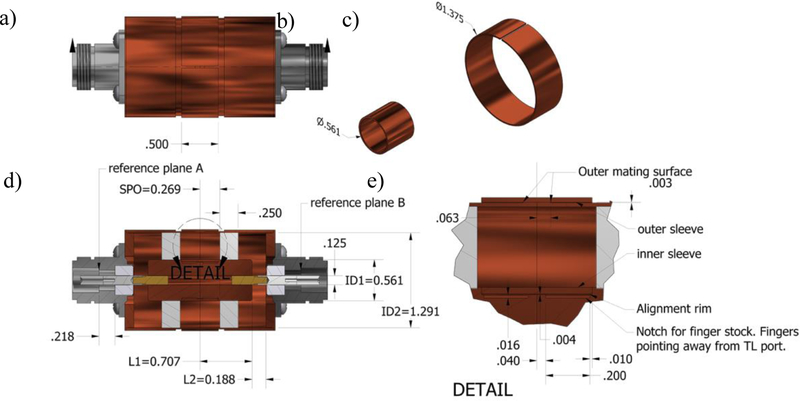
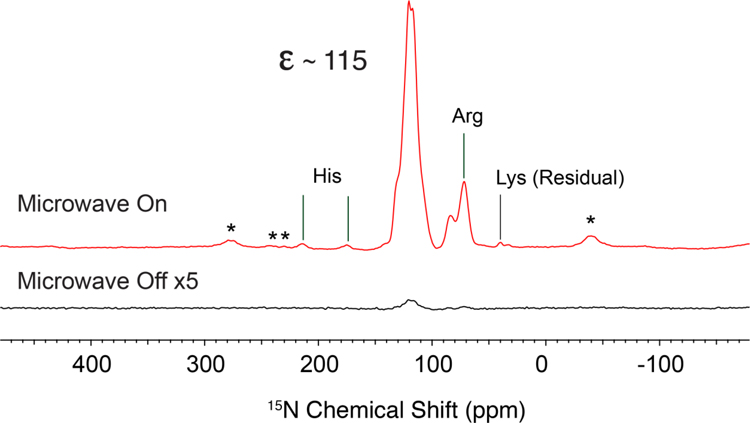
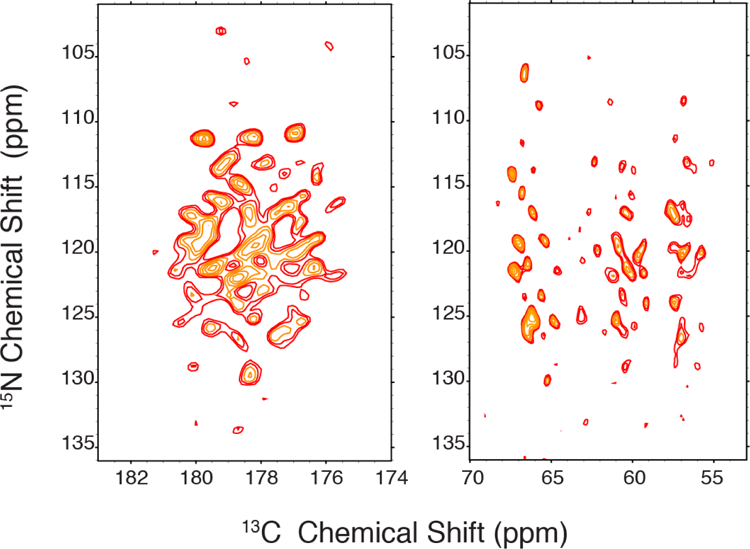
We describe the design and construction of a modular, triple-resonance, fully balanced, DNP-MAS probe based on transmission line technology and its integration into a 500 MHz/330 GHz DNP-NMR spectrometer. A novel quantitative probe design and characterization strategy is developed and employed to achieve optimal sensitivity, RF homogeneity and excellent isolation between channels. The resulting three channel HCN probe has a modular design with each individual, swappable module being equipped with connectorized, transmission line ports. This strategy permits attachment of a mating connector that facilitates accurate impedance measurements at these ports and allows characterization and adjustment (e.g. for balancing or tuning/matching) of each component individually. The RF performance of the probe is excellent; for example, the 13C channel attains a Rabi frequency of 280 kHz for a 3.2 mm rotor. In addition, a frequency tunable 330 GHz gyrotron operating at the second harmonic of the electron cyclotron frequency was developed for DNP applications. Careful alignment of the corrugated waveguide led to minimal loss of the microwave power, and an enhancement factor ε = 180 was achieved for U-13C urea in the glassy matrix at 80 K. We demonstrated the operation of the system with acquisition of multidimensional spectra of cross-linked lysozyme crystals which are insoluble in glycerol-water mixtures used for DNP and samples of RNA.

Keywords: Balanced transmission line probe; NMR probe characterization; Novel probe design; Solid state DNP.


Figures

Figure 1.
Figure 1.
Simplified schematic of a balanced triple resonance RF circuit. Different colors indicate three different working frequencies. The RF circuit of the top probe is symmetric with respect to the solenoid sample coil. The system is divided in a tuning /matching side (left) and a balancing side (right). Black dots (●) corresponds to common impedance nodes.
Figure 2:
Figure 2:
Various parts of the probe a) Probe with cryostat; b) Probe without cryostat; c), d) and e) Sample chamber upon removal of the sample chamber cap, three different views; c) VT line is not connected in this photograph d) 1. Wave guide, 2. Lens, 3. Eject pipe, 4. Temperature sensor, 5&6 spin detection fibres, 7. Stator housing, 8. Sample chamber base plate / compression plate; f) Tuning/matching and balancing circuits in the bottom probe; g) Back of the probe with connectors for purge gas (green), spinning (red), temperature sensing (silver) and microwaves (brass). The evacuation ports of the cryogen transfer lines are visible on the left (blue), and extend beyond the NMR magnet and are accessible during operation. Some of the transmission lines are left open in this photograph.
Figure 2:
Figure 2:
Various parts of the probe a) Probe with cryostat; b) Probe without cryostat; c), d) and e) Sample chamber upon removal of the sample chamber cap, three different views; c) VT line is not connected in this photograph d) 1. Wave guide, 2. Lens, 3. Eject pipe, 4. Temperature sensor, 5&6 spin detection fibres, 7. Stator housing, 8. Sample chamber base plate / compression plate; f) Tuning/matching and balancing circuits in the bottom probe; g) Back of the probe with connectors for purge gas (green), spinning (red), temperature sensing (silver) and microwaves (brass). The evacuation ports of the cryogen transfer lines are visible on the left (blue), and extend beyond the NMR magnet and are accessible during operation. Some of the transmission lines are left open in this photograph.
Figure 3:
Figure 3:
Adapters from the custom designed 50 Ω transmission line standard 50 Ω type-N connectors a) photograph of TL Adapters b) Schematic of a TL adapter (all dimensions in inches). These adapters were used to measure impedances and scattering parameters of probe modules.
Figure 4:
Figure 4:
Adapter design resulting from geometry optimization in HFSS. Shown are a) two adapters connected to each other at the TL ports, corresponding to the models used during optimization in HFSS, b) the internal and c) external connecting sleeve. In d) the dimensions of the optimization result and in e) details of the connector interface are given.
Figure 5:
Figure 5:
a) (left) 4-way tee showing the construction of the ports to which the three RF channels and the transmission line are connected. Additional details on the design and construction of the tee are available in the Supplementary Information, Section 12 and Figure S32. (right) Experimental assembly employed to measure scattering parameters of the 4-way tee from port 4 to port 3. b) Comparison of simulated (x) and measured scattering parameters using port extension (orange) and the parametrized TL calibration standards (green).
Figure 6:
Figure 6:
Schematic diagram of the instrumentation for characterizing the balancing conditions of the RF coil.
Figure 7:
Figure 7:
Top: Main transmission line with the stepped inner conductor protruding from the inside. Gray: 316 stainless steel, Copper: Cu. Bottom: Stepped transmission line, with the left side is on the top. Cross hatched grey: PTFE; Cross hatched copper: Cu. All dimensions are in inches.
Figure 8:
Figure 8:
Ball shift test illustrating the balanced tuning of the coil at all three frequencies – 13C, 15N and 1H.
Figure 9:
Figure 9:
Photograph showing the configuration of the 330 GHz/500 MHz DNP-NMR spectrometer. The 330 GHz gyrotron is shown on the left in an 8 T Bruker magnet. The 11.8 T NMR magnet is shown on the right.
Figure 10:
Figure 10:
DNP enhanced 13C CPMAS spectra of 1 M uniformly 13C labelled urea in 60:30:10 (w/w) glycerol-d8:D2O:H2O with and without microwave irradiation. The spectra were recorded using a 3.2 mm sapphire rotor at a MAS rate of 5 kHz at 77 K. The sample contained 8.85 mM AMUPol as the polarizing agent and the estimated µw power at the sample is 9.1 W.
Figure 11:
Figure 11:
(top) 800 MHz MAS spectrum recorded at ωr/2π =20 kHz of 15N label hen egg white lysozyme (15N-HEWL) exhibiting he expected lines from the amide (120–130 ppm), Arg (~80 ppm) and Lys ((~40 ppm). (bottom) 800 MHz MAS spectrum obtained from cross-linked 15N-HEWL illustrating that the Lys lines are gone and replaced by Schiff base at 360–380 ppm.
Figure 12:
Figure 12:
DNP enhanced 15N CP MAS spectra of uniformly 15N labelled cross-linked hen egg white lysozyme (HEWL) equilibrated in 60:30:10 (w/w/w) glycerol-d8:D2O:H2O solvent containing 10mM AMUPol. The spectra were recorded using a 3.2 mm sapphire rotor at a ωr/2π=8 kHz and the estimated µw power at the sample is 9.1 W. Top trace: Microwave on, 94.5 K, 32 scans; Bottom Trace: Microwave off: 91.5 K, 256 scans. The asterisk denote the position of rotational sidebands.
Figure 13:
Figure 13:
DNP enhanced TEDOR spectra of natural abundance 13C, uniformly 15N labelled cross-linked HEWL, dissolved in 60:30:10 (w/w) glycerol-d8: D2O:H2O with 10 mM AMUPol at 124 K. Left: Carbonyl region, Right: Cα region. The spectrum was recorded with 2.2 ms 13C-15N mixing. Other experimental parameters are: 128 evolution increments with 192 scans each, recycle delay 4 s, 83 kHz TPPM decoupling, 136 μs evolution increment, continuous µw irradiation (9.1 W)
Figure 14:
Figure 14:
a)13C b)15N CP MAS spectra of uniformly 13C/15N labelled 2’dG-sensing 70-mer RNA, 4 mg, dissolved in 60:30:10 (w/w) glycerol-d8:D2O:H2O with and without microwave irradiation. The spectra were recorded using a 3.2 mm Zirconia rotor at a MAS rate of 6.4 kHz. Assignments were done according to Wenk et al. [70]. An enhancement of 30 was observed for both 13C and 15N at 92.6 K. The sample contained 5 mM AMUPol as the polarizing agent and the estimated μw power at the sample is 2.1 W.
Figure 14:
Figure 14:
a)13C b)15N CP MAS spectra of uniformly 13C/15N labelled 2’dG-sensing 70-mer RNA, 4 mg, dissolved in 60:30:10 (w/w) glycerol-d8:D2O:H2O with and without microwave irradiation. The spectra were recorded using a 3.2 mm Zirconia rotor at a MAS rate of 6.4 kHz. Assignments were done according to Wenk et al. [70]. An enhancement of 30 was observed for both 13C and 15N at 92.6 K. The sample contained 5 mM AMUPol as the polarizing agent and the estimated μw power at the sample is 2.1 W.
Figure 15:
Figure 15:
DNP enhanced TEDOR spectra of uniformly 13C/15N labelled 2’dG-sensing 70-mer RNA, 4 mg, dissolved in 60:30:10 (w/w) glycerol-d8: D2O:H2O at 93 K. The spectrum was recorded in 2 h 20 min. with 2 ms 13C-15N mixing. Other experimental parameters are: 64 evolution increments with 16 scans each, recycle delay 4 s, 83 kHz TPPM decoupling, 129 μs evolution increment, continuous μw irradiation (2.1 W).

Similar articles

Cited by

References

    1. Becerra LR, Gerfen GJ, Temkin RJ, Singel DJ, Griffin RG, Dynamic Nuclear Polarization with a Cyclotron Resonance Maser at 5 T, Phys Rev Lett, 71 (1993) 3561–3564. - PubMed
    1. Gerfen GJ, Becerra LR, Hall DA, Griffin RG, Temkin RJ, Singel DJ, High-Frequency (140 GHz) Dynamic Nuclear-Polarization - Polarization Transfer to a Solute in Frozen Aqueous-Solution, J Chem Phys, 102 (1995) 9494–9497.
    1. Hall DA, Maus DC, Gerfen GJ, Inati SJ, Becerra LR, Dahlquist FW, Griffin RG, Polarization-Enhanced NMR Spectroscopy of Biomolecules in Frozen Solution, Science, 276 (1997) 930–932. - PubMed
    1. Ni QZ, Daviso E, Cana TV, Markhasin E, Jawla SK, Temkin RJ, Herzfeld J, Griffin RG, High Frequency Dynamic Nuclear Polarization Accounts of Chem Research, (in press) (2013). - PMC - PubMed
    1. Lee D, Bouleau E, Saint-Bonnet P, Hediger S, De Paepe G, Ultra-low temperature MAS-DNP, J Magn Reson, 264 (2016) 116–124. - PubMed

Publication types

LinkOut - more resources